True lifelong financial planning for the serious business of life.
True lifelong financial planning
for the serious business of life.
True lifelong financial planning for the serious business of life.
True lifelong financial planning
for the serious business of life.
Tags: Adventurer Portfolio, Defender Portfolio, Discretionary Investment Management, Explorer Portfolio, funds, investment, Meridian Portfolio, MGTS Clarion Explorer, MGTS Clarion Meridian, MGTS Clarion Prudence, MTGS Clarion Navigator, Navigator Portfolio, Pioneer Portfolio, Prudence Portfolio, Voyager Portfolio
Category:
Investment management
This article provides a brief overview of the topics discussed in the recent investment committee meeting and the decisions made following those discussions.
The following notes summarise the main points discussed by the Investment Committee.
BoE is buying c.£4bn worth of bonds each week and currently owns around 31% of the entire Gilt market, bringing Gilt yields down to an artificially low level.
Market participants are predicting inflation will rise above the BoE’s and the Fed’s targets; if this occurs, BoE and the Fed will be less able to continue their asset-buying programmes.
Countries that had previously lagged in the vaccine rollout are catching up and new vaccines continue to be developed and approved.
UK hospitalisation and deaths data shows the vaccines are having an effect and reducing the number of critically ill patients, particularly among the double vaccinated.
The G7 agreed, in principle, to a multinational minimum tax rate of 15% which would see taxes raised from where revenue is earned rather than where income is declared.
The UK agreed a free trade deal with Australia.
Inflation remains a concern, with used car prices leaping in the US as new models are held up due to semiconductor shortages. House prices in the US and UK are also showing signs of overheating with double-digit rises year on year.
Federal Reserve comments on moving interest rate rises forward to 2023 from 2024 put the brakes on the reflation trade.
Whether inflationary pressure proves to be “transitory” or not, it makes for an unpleasant atmosphere for bondholders. While interest rate rises are not imminent, with the US projecting 2023 at the earliest and other central banks unlikely to commit ahead of the US, inflation will make already slim real returns even sparser, especially for investors with long duration bond holdings. Our bond selection is primarily positioned at the short-dated end in investment-grade corporates, which ought to outperform in a rising yield environment and offer sufficient income to help protect investors from inflation.
Despite the recent stumble of the reflationary trade, we still expect outperformance from value stocks as economies reopen, with battered industries in services, leisure, and tourism likely to see significant rebounds as pent-up savings are spent after over a year of limited consumption opportunity. The UK is well-positioned for this outcome, with an inherent bias in the major indices towards these types of companies. UK equities as a whole continue to trade well below other developed markets, offering an attractive opportunity for relative outperformance. The Clarion Portfolio funds and model portfolios are overweight UK across the range on this basis.
US equities have the greatest potential for underperformance in the future, as the benign financial conditions, in which they have prospered, begin to shift. Most outperformance has come from the top of the major indices, where a few tech companies account for over 20% of the S&P 500. Regulation and taxation headwinds are likely to hamper companies like Alphabet and Facebook in the future, and make their earnings multiples seem increasingly unrealistic. Our underweight US positioning is due to these factors.
For a fuller version of Clarion’s Economic and Stock Market Commentary, written by Clarion Group Chairman Keith Thompson, please click here.
The charts below show the tactical asset allocation of the Defender Portfolio against the neutral/strategic asset allocation as well as the historical performance of the portfolio against a relevant benchmark since the start of the available data.
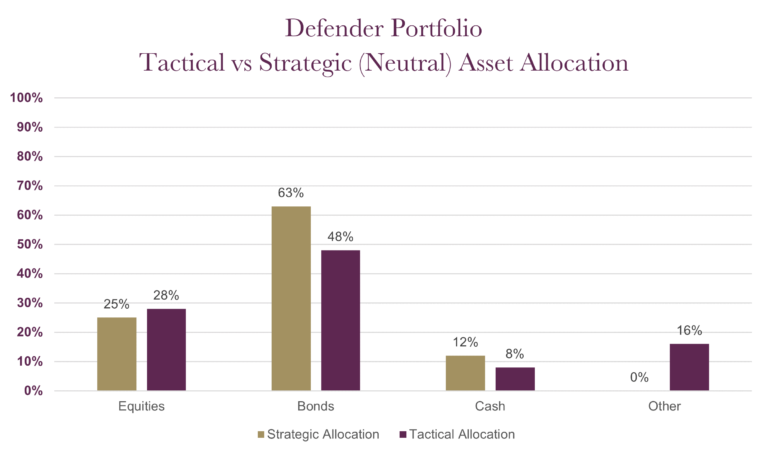
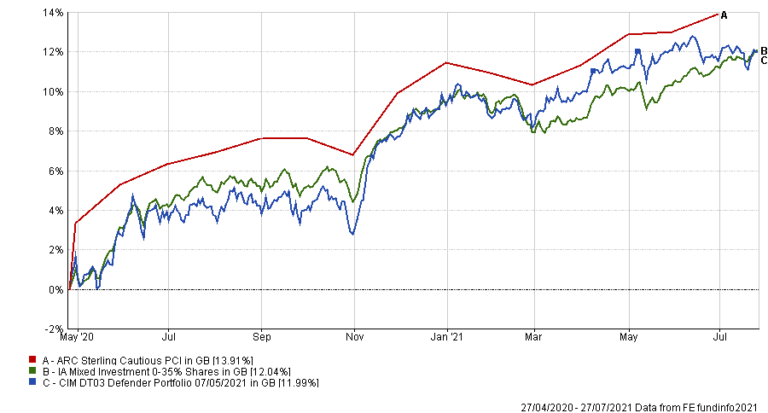
The table below shows the annualised performance to the last quarter end:
| 30/06/20 to 30/06/21 | |
| CIM DT03 Defender Portfolio | 7.35% |
| ARC Sterling Cautious PCI | 7.13% |
| IA Mixed Investment 0-35% Shares | 6.64% |
The charts below show the tactical asset allocation of the Prudence Portfolio against the neutral/strategic asset allocation as well as the historical performance of the portfolio against a relevant benchmark(s) since the start of the available data.
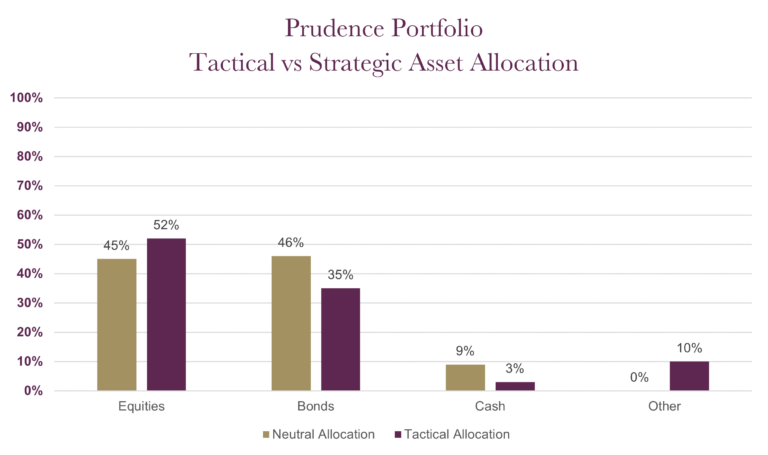
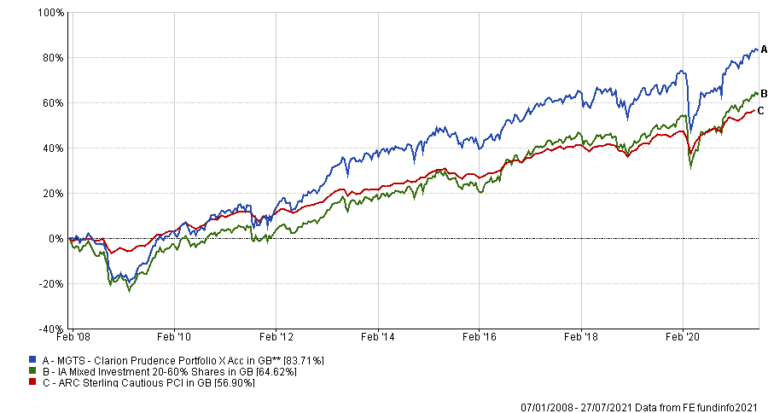
The table below shows the annualised performance to the last quarter end:
| 30/06/20 to 30/06/21 | 30/06/19 to 30/06/20 | 30/06/18 to 30/06/19 | 30/06/17 to 30/06/18 | 30/06/16 to 30/06/17 | |
| MGTS Clarion Prudence X Acc | 12.32% | -1.60% | 0.69% | 2.35% | 11.44% |
| CIM DT04 Prudence Portfolio | 12.26% | -1.71% | 0.88% | 3.02% | |
| ARC Sterling Cautious PCI | 7.13% | 1.66% | 2.37% | 1.41% | 6.53% |
| IA Mixed Investment 20-60% Shares | 12.10% | -1.30% | 0.69% | 1.83% | 11.19% |
The charts below show the tactical asset allocation of the Navigator Portfolio against the neutral/strategic asset allocation as well as the historical performance of the portfolio against a relevant benchmark(s) since the start of the available data.
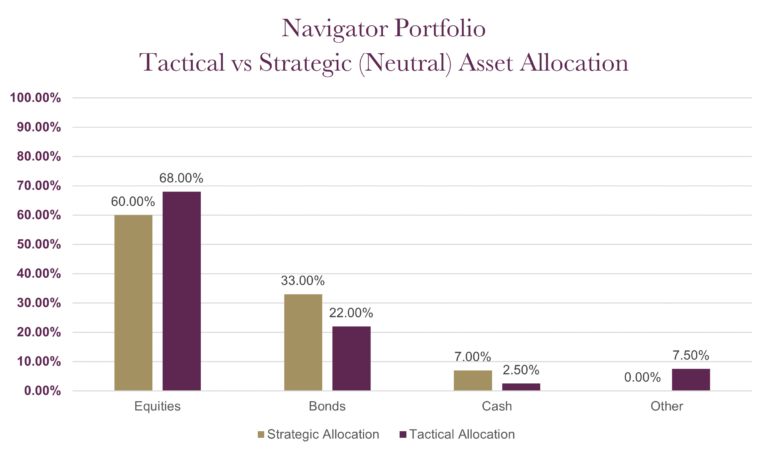
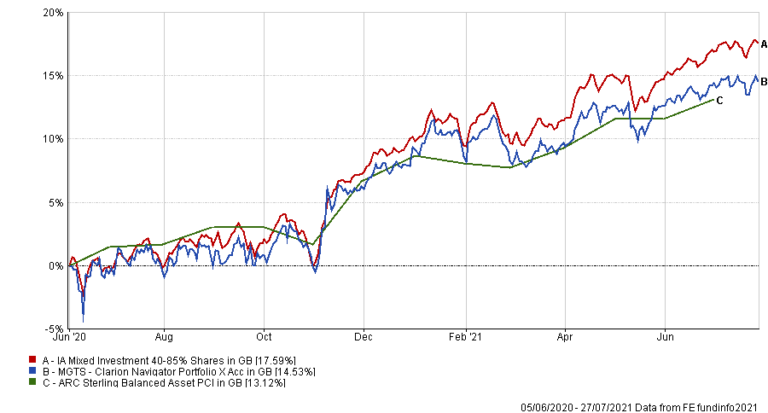
The table below shows the annualised performance to the last quarter end:
| 30/06/20 to 30/06/21 | |
| MGTS Clarion Navigator X Acc | 15.12% |
| CIM DT05 Navigator Portfolio | 16.14% |
| IA Mixed Investment 40-85% Shares | 17.29% |
The charts below show the tactical asset allocation of the Meridian Portfolio against the neutral/strategic asset allocation as well as the historical performance of the portfolio against a relevant benchmark(s) since the start of the available data.
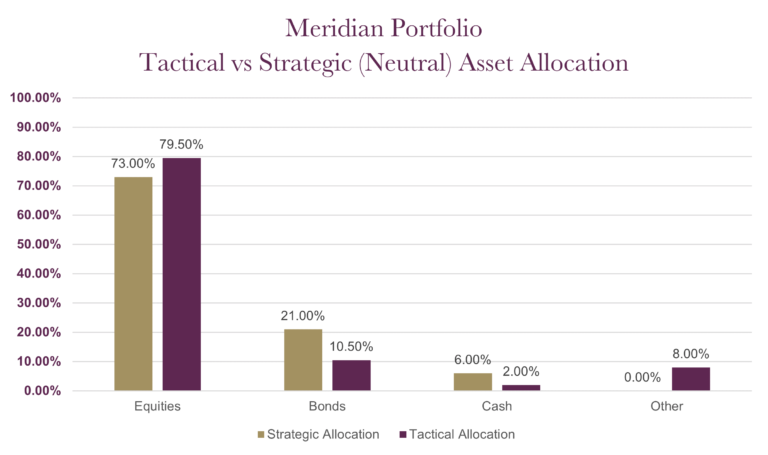
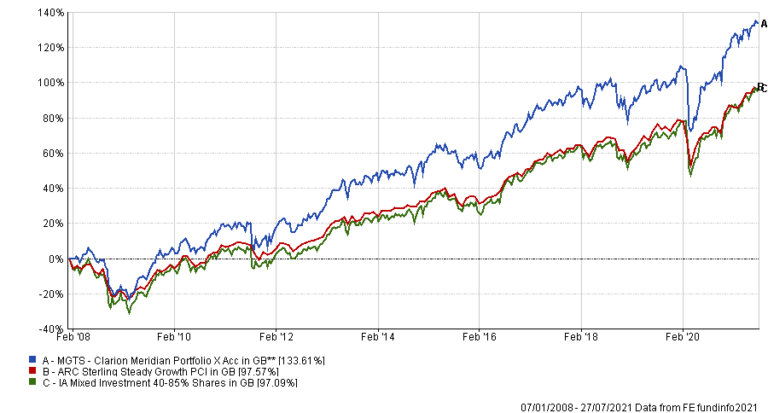
The table below shows the annualised performance to the last quarter end:
| 30/06/20 to 30/06/21 | 30/06/19 to 30/06/20 | 30/06/18 to 30/06/19 | 30/06/17 to 30/06/18 | 30/06/16 to 30/06/17 | |
| MGTS Clarion Meridian X Acc | 19.62% | -0.98% | 0.73% | 5.00% | 17.71% |
| CIM DT06 Meridian Portfolio | 19.73% | -0.62% | 3.08% | 5.17% | |
| ARC Steady Growth PCI | 15.37% | -0.51% | 3.54% | 4.92% | |
| IA Mixed Investment 40-85% Shares | 16.99% | -0.48% | 3.19% | 4.48% | 15.76% |
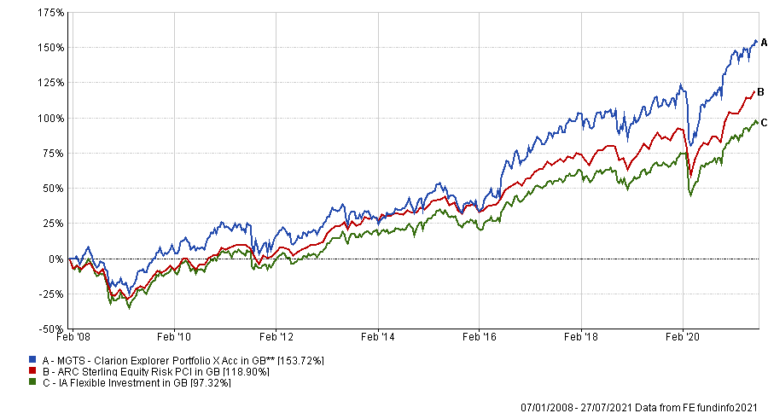
The charts below show the tactical asset allocation of the Explorer Portfolio against the neutral/strategic asset allocation as well as the historical performance of the portfolio against a relevant benchmark(s) since the start of the available data.
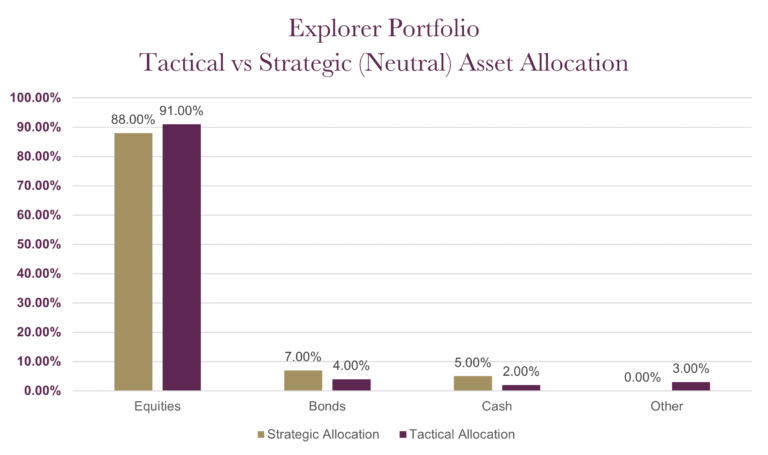
The table below shows the annualised performance to the last quarter end:
| 30/06/20 to 30/06/21 | 30/06/19 to 30/06/20 | 30/06/18 to 30/06/19 | 30/06/17 to 30/06/18 | 30/06/16 to 30/06/17 | |
| MGTS Clarion Explorer R Acc | 22.72% | -1.22% | 5.33% | 6.96% | 21.79% |
| CIM DT07 Explorer Portfolio | 22.39% | -1.22% | 5.61% | 8.57% | |
| ARC Equity Risk PCI | 20.24% | -1.13% | 4.02% | 6.36% | 17.05% |
| IA Flexible Investment | 19.24% | -0.04% | 2.70% | 4.85% | 17.69% |
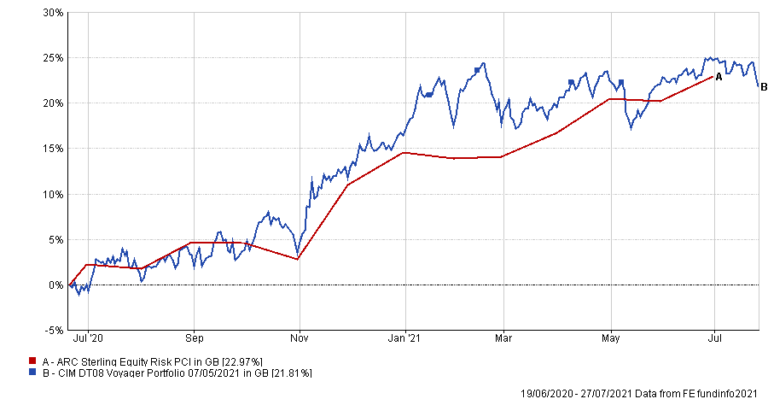
The charts below show the tactical asset allocation of the Voyager Portfolio against the neutral/strategic asset allocation as well as the historical performance of the portfolio against a relevant benchmark(s) since the start of the available data.
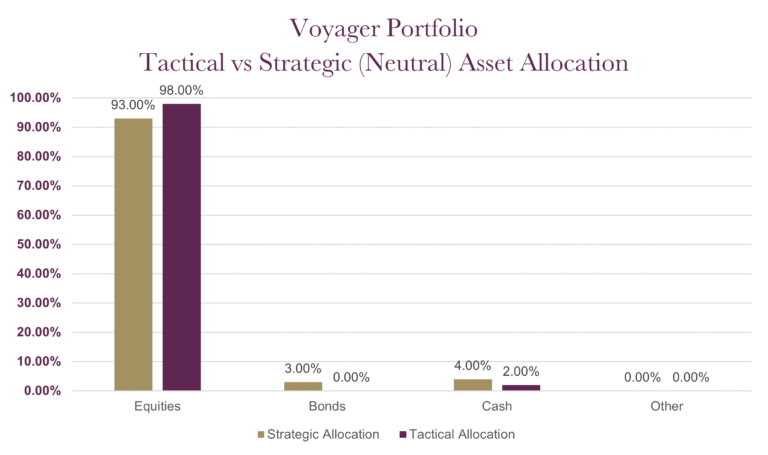
The table below shows the annualised performance to the last quarter end:
| 30/06/20 to 30/06/21 | 30/06/19 to 30/06/20 | 30/06/18 to 30/06/19 | 30/06/17 to 30/06/18 | 30/06/16 to 30/06/17 | |
| CIM DT08 Voyager Portfolio | 24.74% | ||||
| ARC Equity Risk PCI | 20.24% | -1.13% | 4.02% | 6.36% | 17.05% |
The charts below show the tactical asset allocation of the Aventurer Portfolio against the neutral/strategic asset allocation as well as the historical performance of the portfolio against a relevant benchmark(s) since the start of the available data.
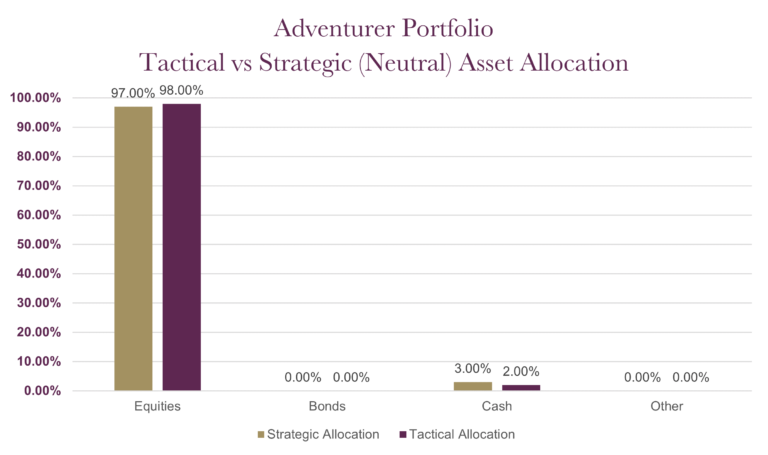
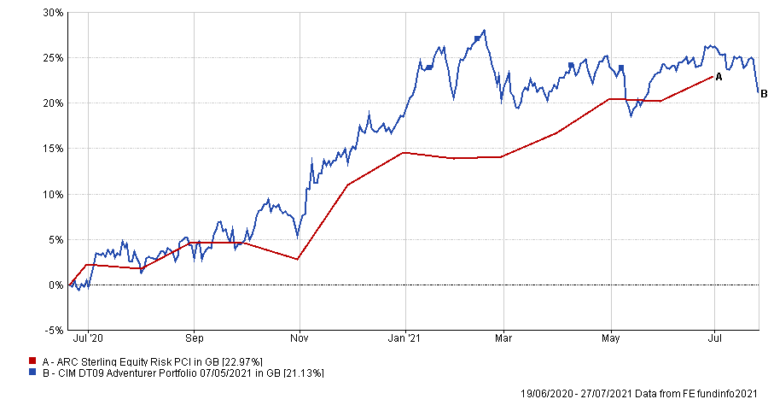
The table below shows the annualised performance to the last quarter end:
| 30/06/20 to 30/06/21 | 30/06/19 to 30/06/20 | 30/06/18 to 30/06/19 | 30/06/17 to 30/06/18 | 30/06/16 to 30/06/17 | |
| CIM DT09 Adventurer Portfolio | 25.49% | ||||
| ARC Equity Risk PCI | 20.24% | -1.13% | 4.02% | 6.36% | 17.05% |
The charts below show the tactical asset allocation of the Pioneer Portfolio against the neutral/strategic asset allocation as well as the historical performance of the portfolio against a relevant benchmark(s) since the start of the available data.
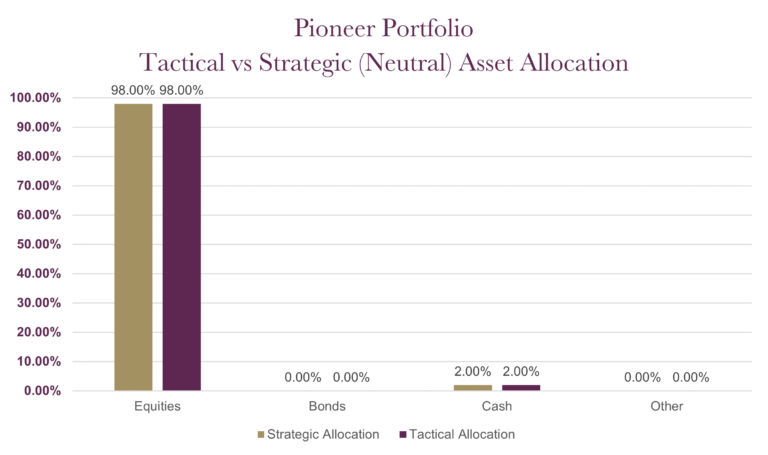
The table below shows the annualised performance to the last quarter end:
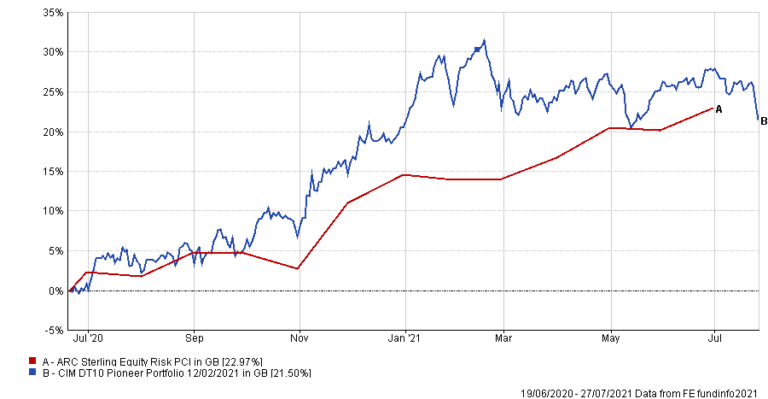
| 30/06/20 to 30/06/21 | 30/06/19 to 30/06/20 | 30/06/18 to 30/06/19 | 30/06/17 to 30/06/18 | 30/06/16 to 30/06/17 | |
| CIM DT10 Pioneer Portfolio | 26.74% | ||||
| ARC Equity Risk PCI | 20.24% | -1.13% | 4.02% | 6.36% | 17.05% |
Any investment performance figures referred to relate to past performance which is not a reliable indicator of future results and should not be the sole factor of consideration when selecting a product or strategy. The value of investments, and the income arising from them, can go down as well as up and is not guaranteed, which means that you may not get back what you invested. Unless indicated otherwise, performance figures are stated in British Pounds. Where performance figures are stated in other currencies, changes in exchange rates may also cause an investment to fluctuate in value.
If you’d like more information about this article, or any other aspect of our true lifelong financial planning, we’d be happy to hear from you. Please call +44 (0)1625 466 360 or email enquiries@clarionwealth.co.uk.
Click here to sign-up to The Clarion for regular updates.