
True lifelong financial planning for the serious business of life.
True lifelong financial planning
for the serious business of life.
True lifelong financial planning for the serious business of life.
True lifelong financial planning
for the serious business of life.
Category: Investment management
The Clarion Investment Committee met on 22 October 2026. The following notes summarise the main points of consideration in the Investment Committee Discussions but have been updated to include commentary on recent events and the wider implications for financial markets.
Please click here to access our October Stock Market & Economic Commentary written by Clarion Group Chairman, Keith Thompson.
Our investment philosophy is guided by proven financial research, applied with care by our in-house Investment Committee. We do not chase trends or make predictions. Instead, we rely on evidence, structure, and oversight to manage wealth responsibly over the long term.
We focus on what can be controlled: diversification, discipline, and costs. This allows us to create efficient portfolios designed to weather uncertainty and deliver the returns that markets provide.
Our approach is built on five enduring principles, which together form the foundation of our Investment Philosophy.
Each of the five philosophy pillars reflects our commitment to managing your wealth with clarity, discipline, and care.
1) Evidence-based investing. Disciplined, diversified portfolios deliver better long-term outcomes than chasing the latest market trend.
2) A systematic process. A structured repeatable process designed to remove guesswork and emotion.
3) Cost efficiency. We carefully select cost effective investment solutions without compromising quality.
4) Independent oversight. Every decision is reviewed and challenged by our in-house Investment Committee, supported by Margetts Fund Management and Dynamic Planner.
5) A responsible perspective. Identifying risks and opportunities that could affect your wealth in the years to come and building resilience into client portfolios.
Economic commentary & market outlook
Markets encountered a more challenging environment during October, particularly across Asia and the emerging world. Concerns surrounding the pace and financing of investment into AI infrastructure prompted a sharp pullback in technology-related shares, leading to weakness in several markets that had been among the strongest performers over the previous twelve months. Asia Pacific ex Japan fell 7.37% during the month, while emerging markets declined 6.49%.
This inevitably affected the higher-risk Clarion portfolios, which maintain meaningful exposure to these regions. While short-term performance was disappointing, it is important to view this in a broader context. The same geographic exposure that detracted from returns this month has been a significant contributor to performance over the past year. Indeed, all four Clarion portfolios remain ahead of their respective peer group sectors over the last twelve months, with Explorer ahead by 6.02 percentage points and Meridian by 4.46 percentage points.
One of the enduring lessons of investing is that leadership within markets constantly changes. Areas that perform strongly for a period will inevitably experience setbacks, while others emerge to provide support.
That dynamic was evident during October. While Asian and emerging markets struggled, UK equities proved more resilient and shorter-dated bond holdings continued to provide stability.
Encouragingly, the majority of the underlying funds held within the Clarion portfolios outperformed their respective sector averages during the month.
This matters because diversification is not designed to eliminate volatility. Rather, it is intended to ensure that portfolios are not dependent on any single market, region or investment theme. October provided a useful reminder of why that discipline remains valuable.
The economic backdrop also became more complicated. UK inflation rose to 3.5%, driven in part by rising fuel prices and persistent inflation within the service sector. As a result, financial markets have become increasingly focused on the possibility of further interest-rate increases from the Bank of England.
For investors, this presents both challenges and opportunities.
Higher interest rates can place pressure on economic growth and company valuations. However, they also create a much more attractive environment for savers and fixed-income investors than has existed for many years.
The Investment Committee noted that gilt yields have reached levels not seen for almost two decades, meaning newly invested capital can now secure significantly higher levels of income than was possible throughout much of the last decade.
Bond markets have become increasingly sensitive to government finances and fiscal discipline. During October, the yield on the 10-year gilt reached 5.53%, the highest level for nineteen years, while the 30-year gilt yield briefly rose above 6% for the first time since 1998.
These developments reflect concerns about inflation, future interest-rate policy and the sustainability of government borrowing. Investors will therefore be paying close attention to both fiscal policy and central bank decisions in the months ahead.
Whilst rising yields can create short-term pressure on existing bond holdings, they also improve the long-term return potential available from fixed-income investments. Put simply, today’s bond market offers income opportunities that were largely absent during the era of ultra-low interest rates.
The underlying funds
As always, diversification was invaluable, particularly when markets fall. Of our 30 funds, 23 beat their sector average over the month.
Overseas, the value and income funds held up best in a sell-off led by growth shares, and every short-dated bond fund beat its sector again, as they have in every report this year.
The UK value funds that led in September trailed a rising UK market this time, the normal ebb and flow of investment style.
Standouts
A tougher month
Summary
Read together, the tables split on style rather than region. Four of the six leaders are value, income or smaller-company funds that held up in a growth-led sell-off, and Baillie Gifford Pacific, the most growth-heavy holding, heads the laggards. The UK is the reverse of September, with UK Value and UK Small Companies behind a rising sector. The exception is BNY Mellon Global Infrastructure Income, behind on all three horizons by more than any other holding. This Fund is now on the Committee’s watch list.
The value premium is still the main long-term story: Dimensional UK Value is 77.53 percentage points ahead of IA UK All Companies over five years and European Value 69.76 percentage points ahead of its sector, while Emerging Markets Targeted Value is 11.36 percentage points ahead over five years but 16.40 percentage points behind over three. The 2022 bond rout stays in the five-year window until late 2027, with IA UK Gilts at −19.21% and index-linked at −40.60%. Short duration bonds provide a more positive picture, with iShares UK Gilts 0-5y 27.87 percentage points ahead.
How the portfolios are invested
The portfolios follow the Dynamic Planner strategic allocations for each risk level, which spread equity allocations widely around the world, with meaningful weightings to Asia Pacific, emerging markets and Japan alongside the UK, US, and Europe. Listed infrastructure, shares in companies owning assets such as toll roads, pipelines and utilities, makes up 10–11% of each portfolio.
Equity allocation rises from 47% in Prudence to 91% in Explorer. Navigator and Meridian share a sector but not a risk level: Meridian holds 80% in equities against Navigator’s 63%, so it should be expected to move further than Navigator in both directions. The weighting to Asia Pacific and emerging markets climbs with risk, from 6% in Prudence to 38% in Explorer, which is why this month’s falls in those regions hit the higher-risk portfolios hardest and why they have done so well over the past year.
Changes agreed this month
The October committee moved each portfolio back to its strategic weightings. The main shifts were a smaller UK equity weighting (3% lower in Prudence, Meridian and Explorer, 2% in Navigator) and, in most portfolios, more in Japan, listed infrastructure and global investment grade corporate bonds. Meridian moved 3% into North America and Explorer 2% into Europe. Two small tactical positions remain: Meridian holds 2% in cash in place of UK gilts and index-linked gilts, and Explorer holds 2% in cash in place of global corporate bonds.
The coming weeks contain several potentially significant events, including the next Federal Reserve policy decision in the United States and the Bank of England’s forthcoming interest-rate announcement. Markets are likely to react to each in their own way.
However, short-term uncertainty is a normal feature of successful long-term investing. Rather than attempting to predict every market movement, the Investment Committee remains focused on maintaining diversified portfolios aligned with clients’ long-term objectives, risk tolerances and financial plans.
The broader picture remains encouraging. Although October proved difficult for some areas of the market, the portfolios continue to benefit from broad global diversification and remain well positioned to participate in future opportunities as they emerge.
October served as a reminder that markets do not move in straight lines. Periods of enthusiasm are often followed by periods of doubt, and sectors that lead one month can lag the next. Such fluctuations are part of investing, not evidence that something is broken.
Against an uncertain economic backdrop, our focus remains unchanged: maintaining diversified portfolios, controlling risk and looking beyond today’s headlines towards the opportunities and challenges that will shape the years ahead.
Markets rarely reward certainty for very long.
The past year has been a useful reminder that investment returns often emerge from places that investors least expect. It has also reinforced the importance of diversification at a time when many market indices remain dominated by an increasingly small group of companies and sectors.
As we move towards 2027, three themes appear likely to remain central: rising government indebtedness, geopolitical uncertainty and the substantial investment required to support economic and technological transformation.
None of these themes are new.
What has changed is that markets are beginning to price them more seriously.
For investors, that is exactly why periodic recalibration matters. Good navigation does not require perfect foresight. It requires a clear understanding of where you are, a realistic assessment of the risks ahead and the discipline to adjust course when conditions change.
The road is rarely smooth, but for patient investors it is the long journey, rather than any individual month’s progress, that ultimately matters. That remains the essence of long-term investing.
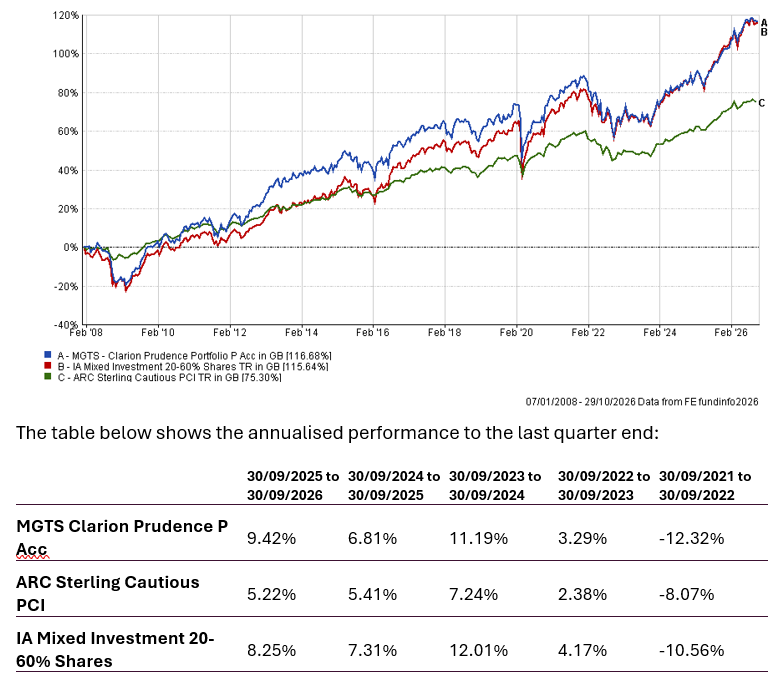
The chart below shows the historical performance of the Prudence Portfolio against a relevant benchmark since the start of the available data.
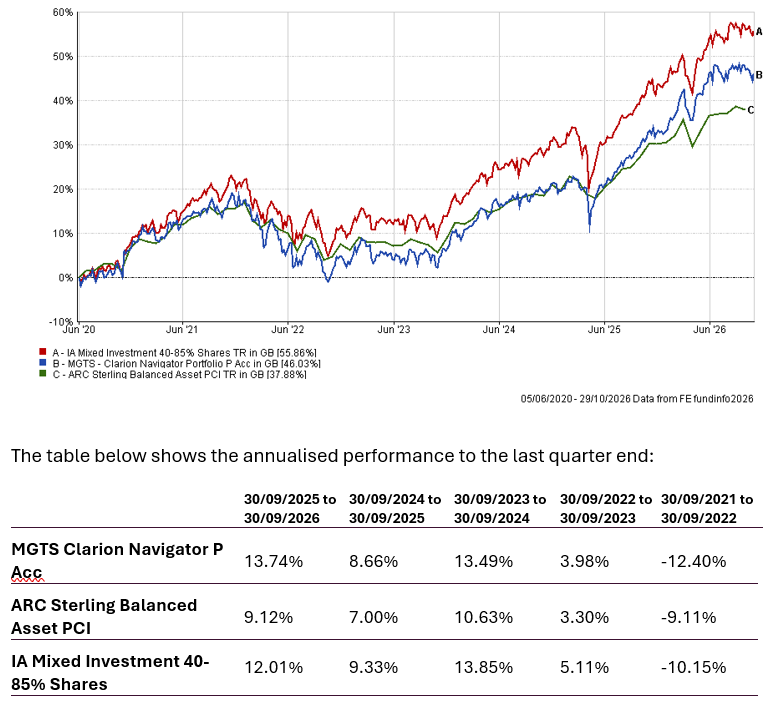
The chart below shows the historical performance of the Navigator Portfolio against a relevant benchmark since the start of the available data.
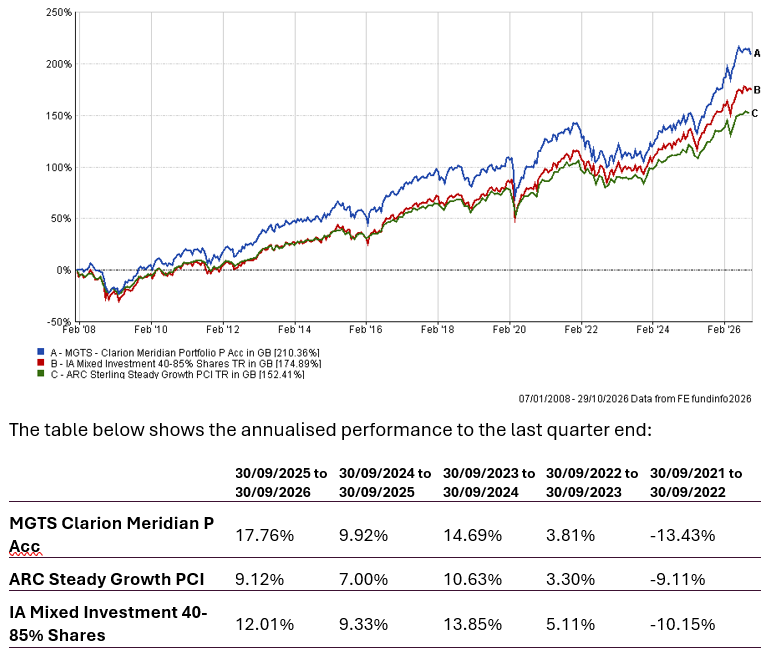
The chart below shows the historical performance of the Meridian Portfolio against a relevant benchmark since the start of the available data.
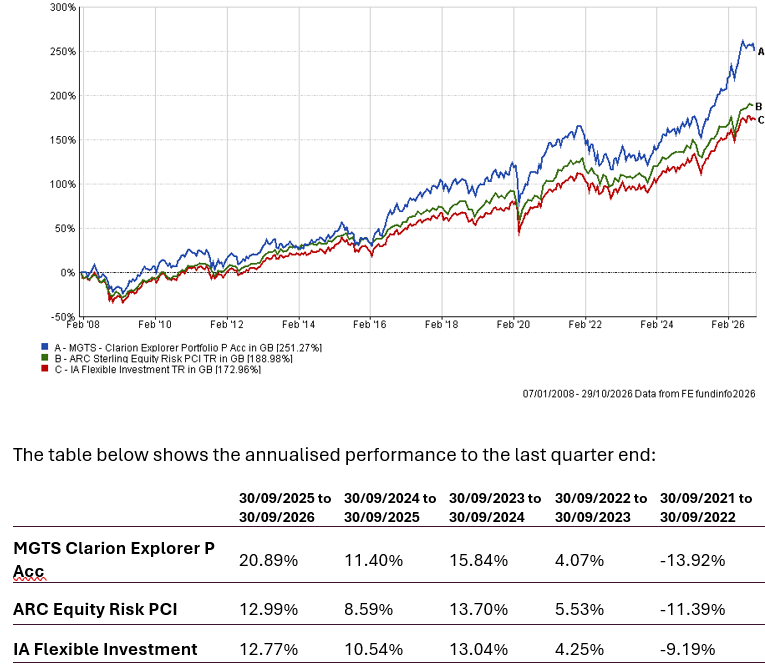
The chart below shows the historical performance of the Explorer Portfolio against a relevant benchmark since the start of the available data.
Keith W Thompson
Clarion Wealth Group Chairman
October 2026
Any investment performance figures referred to relate to past performance which is not a reliable indicator of future results and should not be the sole factor of consideration when selecting a product or strategy. The value of investments, and the income arising from them, can go down as well as up and is not guaranteed, which means that you may not get back what you invested. Unless indicated otherwise, performance figures are stated in British Pounds. Where performance figures are stated in other currencies, changes in exchange rates may also cause an investment to fluctuate in value.
The content of this article does not constitute financial advice, and you may wish to seek professional advice based on your individual circumstances before making any financial decisions.
If you’d like more information about this article, or any other aspect of our true lifelong financial planning, we’d be happy to hear from you. Please call +44 (0)1625 466 360 or email [email protected].
Click here to sign-up to The Clarion for regular updates.