True lifelong financial planning for the serious business of life.
True lifelong financial planning
for the serious business of life.
True lifelong financial planning for the serious business of life.
True lifelong financial planning
for the serious business of life.
Tags: Adventurer Portfolio, Defender Portfolio, Discretionary Investment Management, Explorer Portfolio, funds, investment, Meridian Portfolio, MGTS Clarion Explorer, MGTS Clarion Meridian, MGTS Clarion Prudence, MTGS Clarion Navigator, Navigator Portfolio, Pioneer Portfolio, Prudence Portfolio, Voyager Portfolio
Category:
Investment management
This article provides a brief overview of the topics discussed in the recent investment committee meeting (7th April 2022) and the decisions made following those discussions.
The following notes summarise the main points discussed by the Investment Committee.
China is experiencing its worst COVID outbreak since the first wave in Wuhan with case rates running at more than four times the February 2020 peak. Lockdowns in Shanghai and other cities have badly disrupted activity and China’s trucking industry, crucial to moving goods within the country and to major ports. Cargo volumes through the world’s largest port in Shanghai have dropped by about a third since mid-March as freight is rerouted to other cities. Globally shipping times and backlogs of unfilled orders are rising.
Circa 25m people will be affected by the lockdown in Shanghai, the largest single city lockdown since the onset of the pandemic. China has maintained its originally successful zero-Covid policy which many Asian economies also found successful in the early days of the pandemic. With the advent of the Delta and Omicron mutations, the spread of the virus has become much more rapid and maintaining a zero-tolerance approach of localised lockdowns and testing turned much more complex. The SinoVac vaccine has been a failure in comparison to the potent western MRNA-based vaccines and does not offer the way out of the pandemic as has been seen in the UK.
The impact could be significant for Chinese GDP progression, itself now a substantial provider of worldwide GDP growth. A study by a Chinese University of Hong Kong, Professor Song (using data tracked from c.2m trucks travelling across China) conservatively projects a $46bn monthly impact, equivalent to 3.1% of Chinese GDP, due to the current lockdown measures in place. This projection could get substantially worse if extended to other cities:
If China’s four largest cities all underwent a strict lockdown together, national inflation-adjusted GDP would fall 12% for the duration of the shutdowns.
This could also have significant implications for inflationary pressure. Goods supply falling behind demand has been the major driver of western inflation, and likelihood of Chinese exports dropping as factories are forced to close in lockdowns, on top of the impact from the war in Ukraine, could push this yet higher. Conversely, some pressure may be lifted as oil prices have dropped due to the expected fall in demand in China. Either way, central banks now have additional factors to weigh up in their decision making in the months ahead, and the camel they are trying to pass through the eye of a needle has acquired additional baggage.
The yield curve inverted in the US, with the yield on the two-year treasury rising above the yield on the ten-year treasury for the first time since 2019. The spread between two- and ten-year bond yields has long been regarded as a great indicator of an oncoming recession, and as a phenomenon that can limit the Federal Reserve’s freedom of action. Usually, 10-year bonds will command a higher yield, for the sensible reason that more risk is involved in investing further into the future, and investors require a higher return to compensate for it. Whenever the curve inverts, with two-year bonds yielding more, it’s taken as a signal that a recession is coming, and that at some point soon interest rates will have to come down.
However, its reliability as an indicator is arguably less plausible due to heavy manipulation of the long end of the yield curve due to quantitative easing. Indeed, another predictor of economic stress, the high yield bond market has been remarkably calm this year. The difference in yield on high yield bonds and US Treasuries, a measure of the risk of lending to private companies versus the government, has risen a little since the start of the Russia-Ukraine conflict but has remained well below any signal of distress in the economy.
UK inflation hit 6.2% for CPI, and core CPI hit 5.5% according to March’s data released recently. Both rose above the predicted consensus of economists. Housing and transport costs were notable contributors due primarily to rising energy prices, and other goods (clothing, household and food) were also significant contributors from above typical levels. One potential sign that inflation is putting pressure on UK households is the increase in spending on credit cards in February & March. Individuals borrowed a net £1.5bn on credit cards in February, the highest monthly amount since records began in 1993, according to the Bank of England. Notably, this data is not factoring in the outbreak of war in Ukraine late in February. While it is possible that some of this spending could be delayed consumption (i.e. people booking a first summer holiday in two years), the likelihood that people are turning to credit in order to maintain their current lifestyles is not a positive sign.
Bond yields have continued to rise in western economies as inflation numbers continue to increase. The concern that central banks may have to increase interest rates and speed up quantitative tightening is palpable across market participants. Short-dated and tactical bond funds are preferred instruments in a rising rate environment that offers little comfort to longer duration assets.
The reversal in bond markets and increased borrowing costs puts pressure on growth equities to justify current valuations, as the expectation of future cashflows becomes less predictable. The top of the US equity market is the most prone to impact as the prime beneficiary of the last decade’s easy monetary policy. The Investment Committee continue to underweight this portion of the US equity market accordingly and, conversely, see value opportunities in smaller companies and the lower end of the S&P 500.
Value markets ought to see relative outperformance from financials, energy and miners inter alia, via increased margins due to interest rate rises and investors focusing on real assets as inflation hedges. The UK indices are tilted towards such companies and ought to see relative outperformance as a result. UK equities continue to trade at a deep discount to other peer developed equity markets, with equivalent companies trading at higher earnings multiples on other exchanges. The Investment Committee see ample scope for outperformance and overweight the UK across the Clarion Portfolio Funds and model portfolios.
The Asia Pacific region also offers scope for long term capital growth. Following last year’s rout in technology stocks due to government regulatory intervention, which dragged markets down across unrelated sectors, current valuations look reasonable with lower downside risk. Eastern central banks are acting in contrast to western ones, with the Peoples Bank of China loosening monetary policy and the Bank of Japan maintaining quantitative easing as part of their yield curve control. This should be conducive to long-term equity performance in the region. Asia Pacific equities are held in overweight allocations across the Portfolio Funds and model portfolio.
Continuing to hold diversified high-quality assets over the longer term remains the appropriate method for allocation of investor capital.
For a fuller version of Clarion’s Economic and Stock Market Commentary, written by Clarion Group Chairman Keith Thompson, please click here
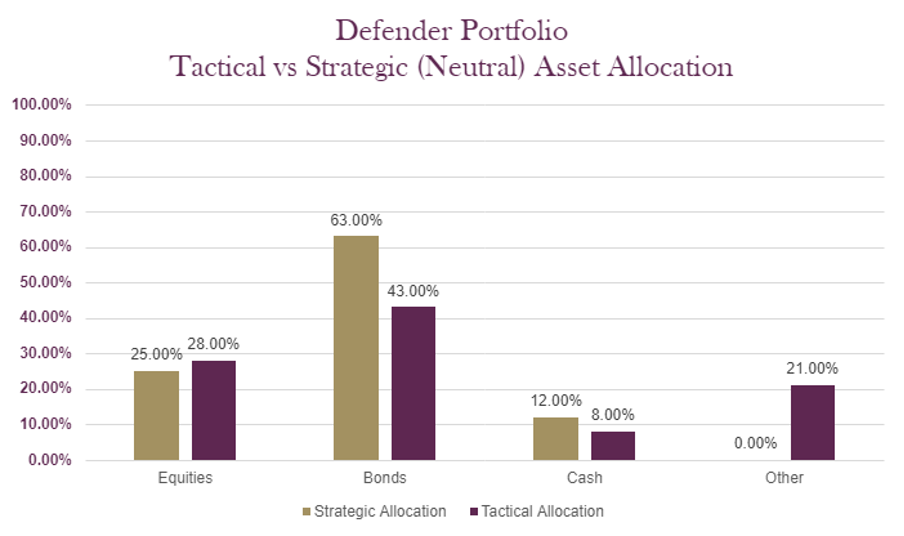
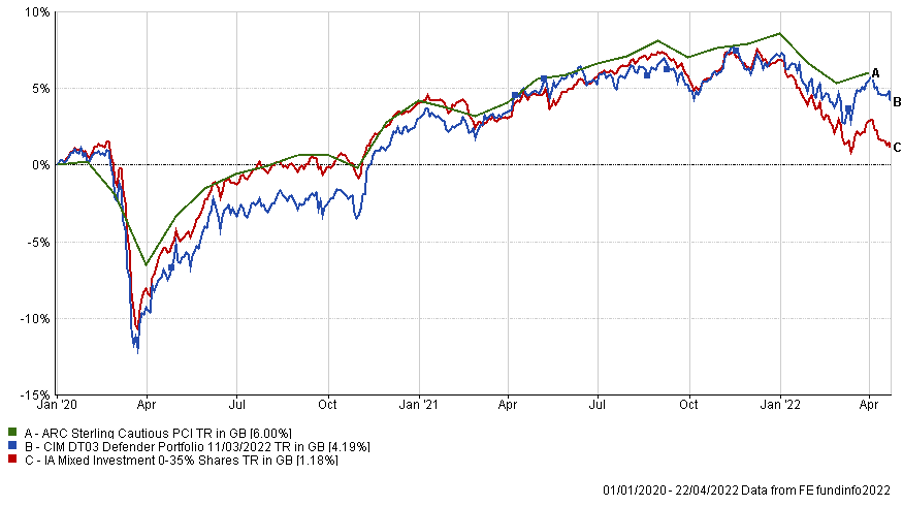
The charts below show the tactical asset allocation of the Defender Portfolio against the neutral/strategic asset allocation as well as the historical performance of the portfolio against a relevant benchmark since the start of the available data.
*Past performance data covering the most recent five-year period is unavailable therefore only past performance data available since inception of the fund is illustrated.
The table below shows the annualised performance to the last quarter end:
| 31/03/21 31/03/20
to to 31/03/22 31/03/21 |
|
| CIM DT03 Defender Portfolio | 1.94% 14.04% |
| ARC Sterling Cautious PCI | 1.82% 11.34% |
| IA Mixed Investment 0-35% Shares | -0.20% 12.09% |
Changes to the Defender model
There were no changes made to the Defender portfolio in April 2022
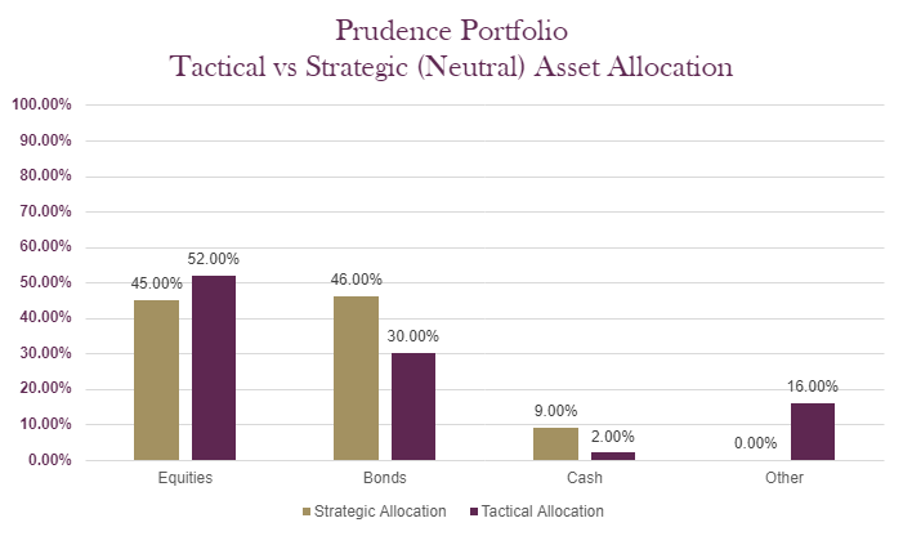
The charts below show the tactical asset allocation of the Prudence Portfolio against the neutral/strategic asset allocation as well as the historical performance of the portfolio against a relevant benchmark(s) since the start of the available data.
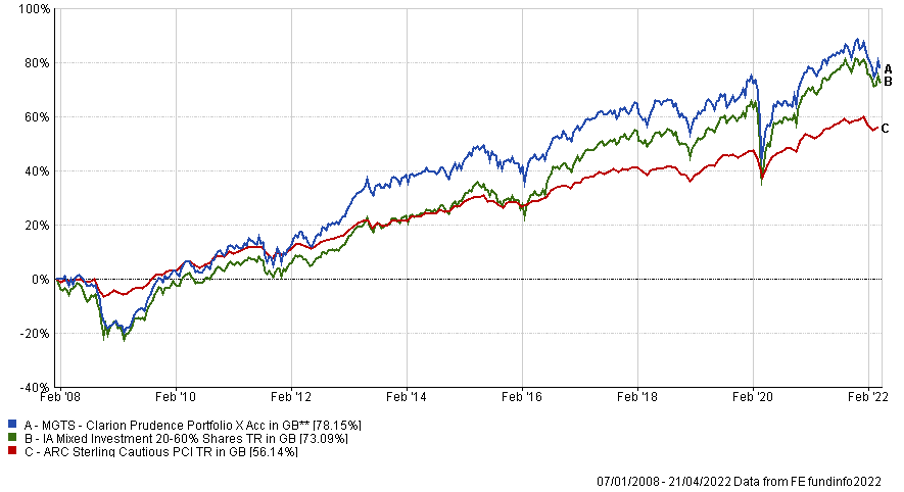
The table below shows the annualised performance to the last quarter end:
| 31/03/21 to 31/03/22 | 31/03/20 to 31/03/21 | 31/03/19 to 31/03/20 | 31/03/18 to 31/03/19 | 31/03/17 to 31/03/18 | |
| MGTS Clarion Prudence X Acc | 2.22% | 18.18% | -7.89% | 3.87% | -1.24% |
| CIM DT04 Prudence Portfolio | 2.88% | 18.24% | -7.42% | 4.15% | |
| ARC Sterling Cautious PCI | 1.82% | 11.34% | -2.29% | 1.71% | 0.65% |
| IA Mixed Investment 20-60% Shares | 2.73% | 19.83% | -7.19% | 2.86% | 0.83% |
Changes to the Prudence fund & model
There were no changes made to the Prudence portfolio in April 2022
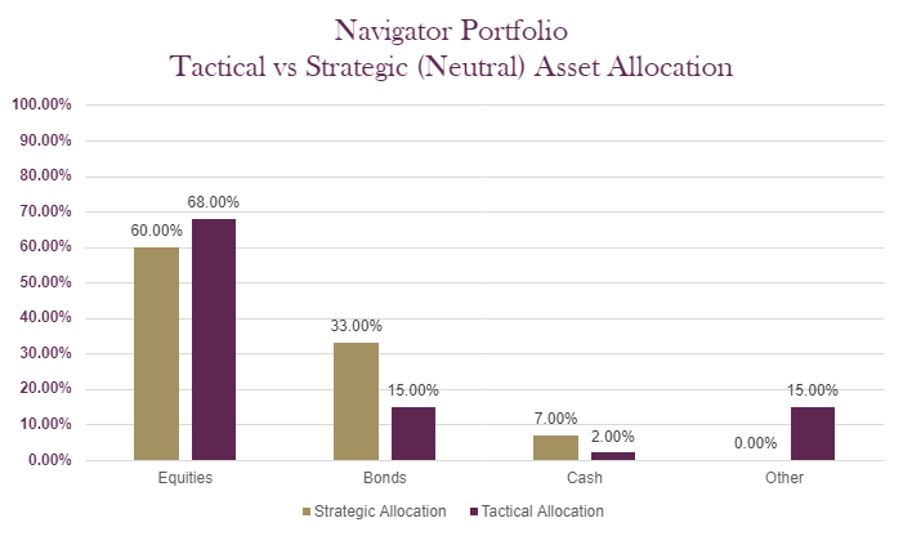
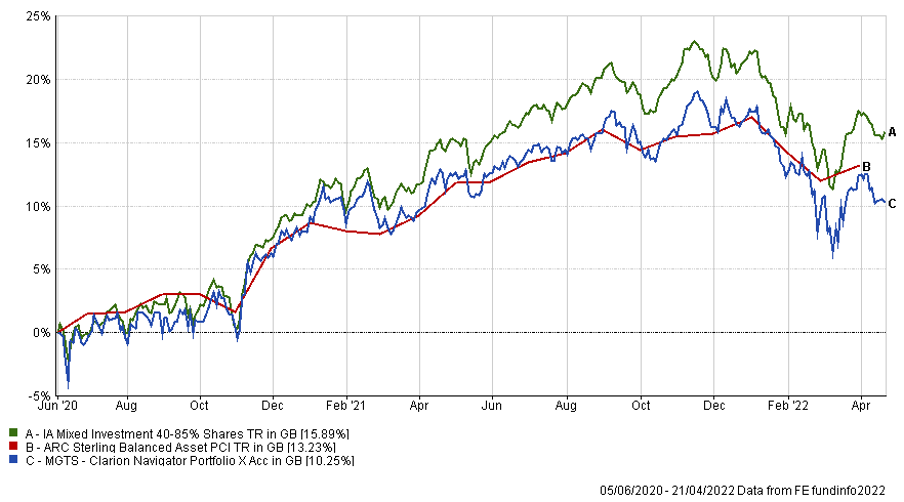
The charts below show the tactical asset allocation of the Navigator Portfolio against the neutral/strategic asset allocation as well as the historical performance of the portfolio against a relevant benchmark(s) since the start of the available data.
*Past performance data covering the most recent five-year period is unavailable therefore only past performance data available since inception of the fund is illustrated.
The table below shows the annualised performance to the last quarter end:
| 31/03/21 to 31/03/22 | |
| MGTS Clarion Navigator X Acc | 2.71% |
| CIM DT05 Navigator Portfolio | 3.09% |
| IA Mixed Investment 40-85% Shares | 5.23% |
| ARC Sterling Balanced Asset PCI | 3.63% |
Changes to the Navigator fund & model
There were no changes made to the Navigator portfolio in April 2022
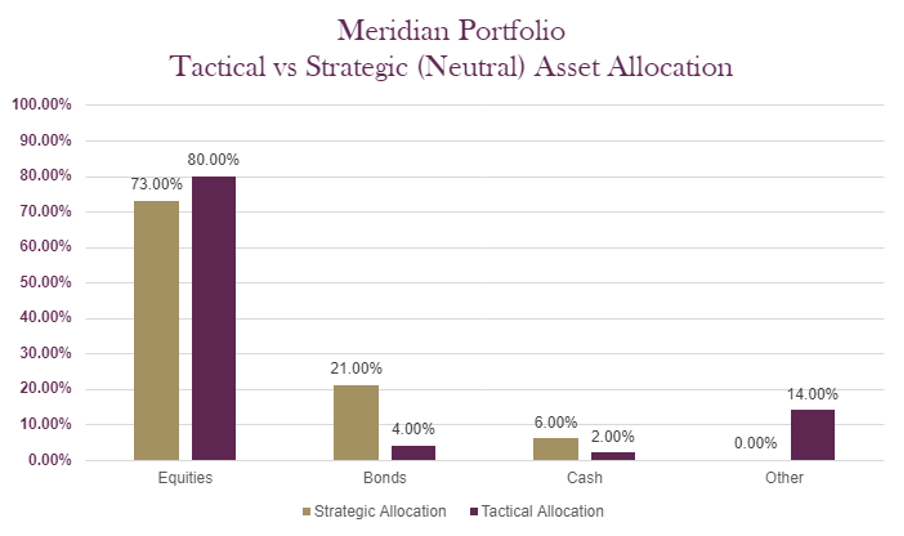
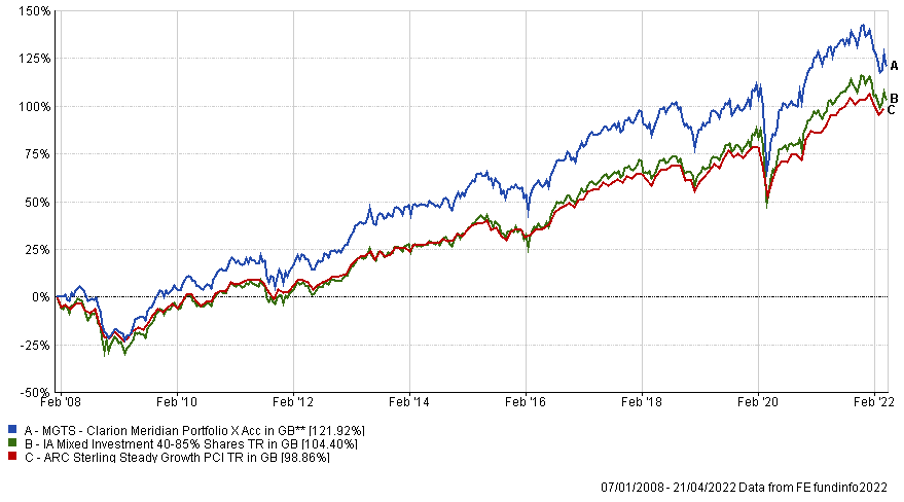
The charts below show the tactical asset allocation of the Meridian Portfolio against the neutral/strategic asset allocation as well as the historical performance of the portfolio against a relevant benchmark(s) since the start of the available data.
The table below shows the annualised performance to the last quarter end:
| 31/03/21 to 31/03/22 | 31/03/20 to 31/03/21 | 31/03/19 to 31/03/20 | 31/03/18 to 31/03/19 | 31/03/17 to 31/03/18 | |
| MGTS Clarion Meridian X Acc | 1.40% | 30.01% | -10.01% | 4.27% | -0.40% |
| CIM DT06 Meridian Portfolio | 1.76% | 30.90% | -9.43% | 4.28% | |
| ARC Steady Growth PCI | 5.13% | 23.53% | -7.71% | 4.85% | 1.31% |
| IA Mixed Investment 40-85% Shares | 5.23% | 26.44% | -7.99% | 4.30% | 1.54% |
Changes to the Meridian fund & model
There were no changes made to the Meridian portfolio in April 2022
The charts below show the tactical asset allocation of the Explorer Portfolio against the neutral/strategic asset allocation as well as the historical performance of the portfolio against a relevant benchmark(s) since the start of the available data.
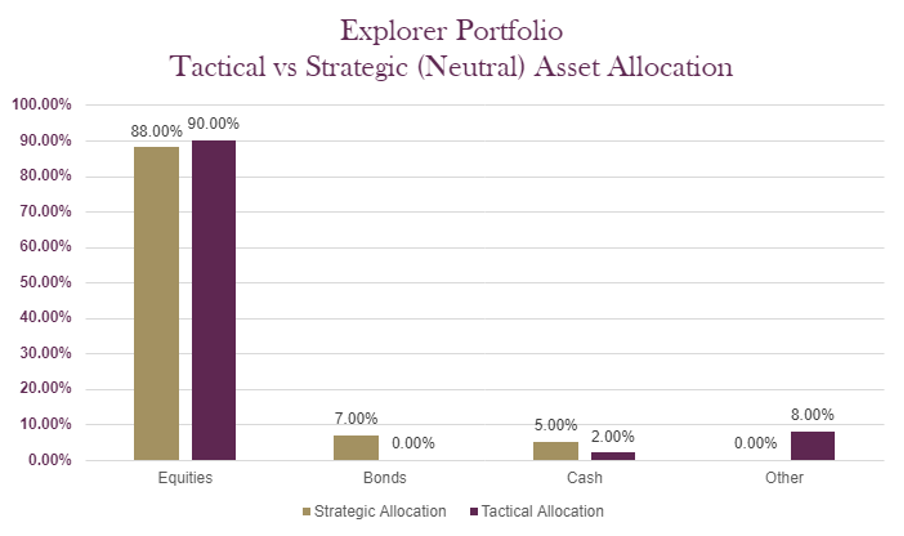
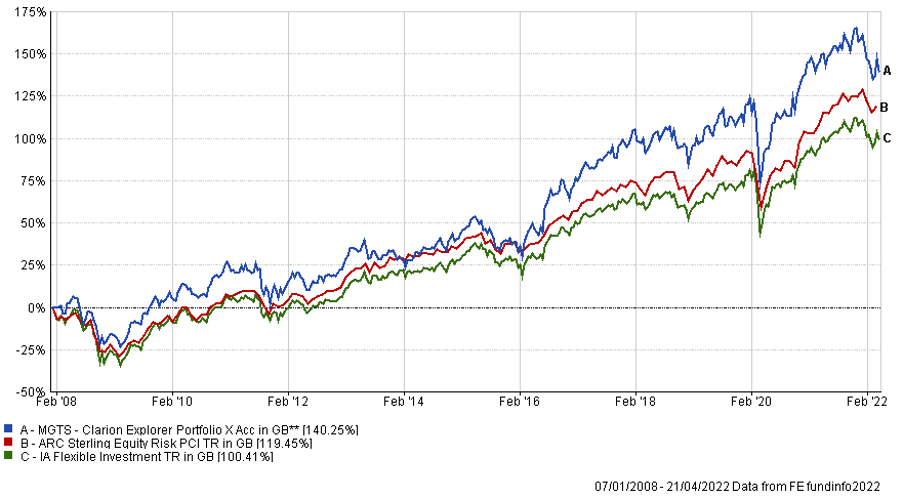
The table below shows the annualised performance to the last quarter end:
| 31/03/21 to 31/03/22 | 31/03/20 to 31/03/21 | 31/03/19 to 31/03/20 | 31/03/18 to 31/03/19 | 31/03/17 to 31/03/18 | |
| MGTS Clarion Explorer X Acc | 1.79% | 34.64% | -9.05% | 4.23% | 3.50% |
| CIM DT07 Explorer Portfolio | 1.61% | 35.28% | -10.10% | 5.22% | |
| ARC Equity Risk PCI | 5.63% | 30.35% | -9.65% | 6.04% | 1.77% |
| IA Flexible Investment | 4.95% | 29.10% | -8.14% | 3.31% | 2.36% |
Changes to the Explorer fund & model
There were no changes made to the Explorer portfolio in April 2022
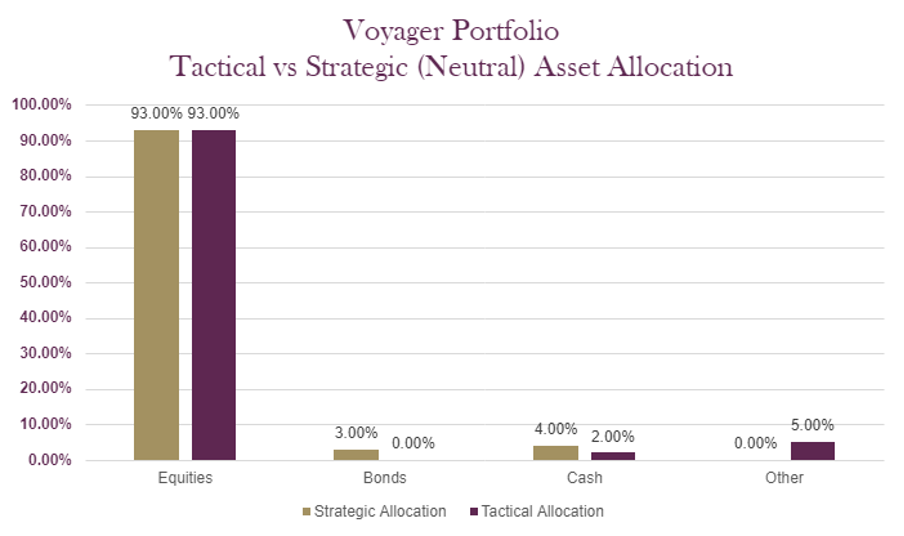
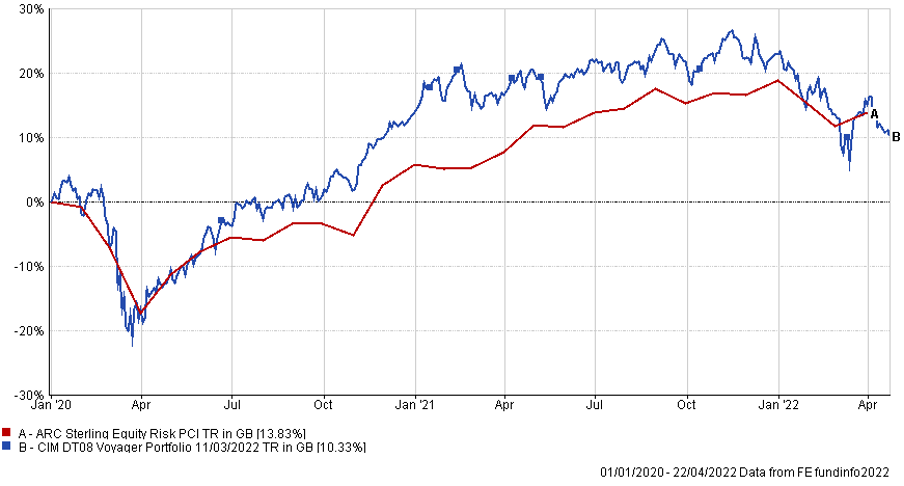
The charts below show the tactical asset allocation of the Voyager Portfolio against the neutral/strategic asset allocation as well as the historical performance of the portfolio against a relevant benchmark(s) since the start of the available data.
*Past performance data covering the most recent five-year period is unavailable therefore only past performance data available since inception of the fund is illustrated.
The table below shows the annualised performance to the last quarter end:
| 31/03/21
to 31/03/22 |
31/03/20
to 31/03/21 |
|||||
| CIM DT08 Voyager Portfolio | -1.32% | 40.16% | ||||
| ARC Equity Risk PCI | 5.63% | 30.35% |
Changes to the Voyager fund & model
There were no changes made to the Voyager portfolio in April 2022
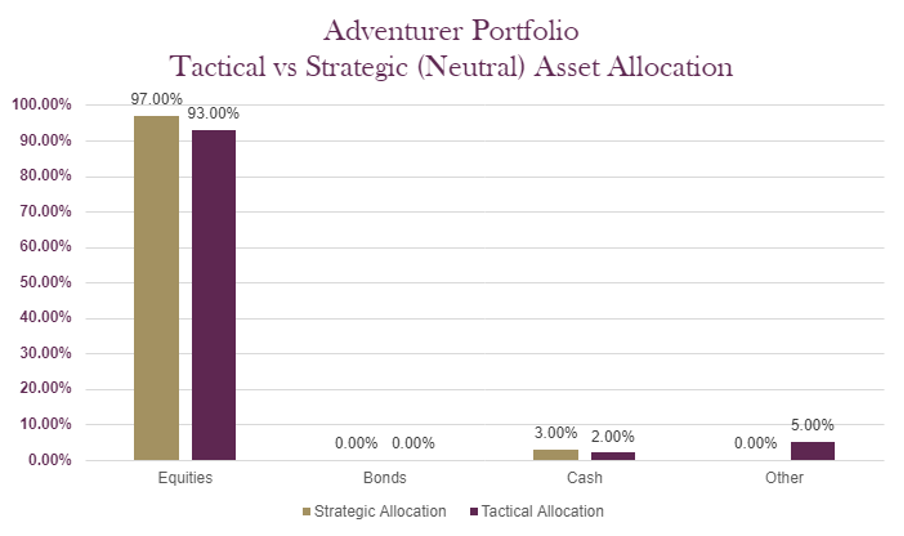
The charts below show the tactical asset allocation of the Adventurer Portfolio against the neutral/strategic asset allocation as well as the historical performance of the portfolio against a relevant benchmark(s) since the start of the available data.
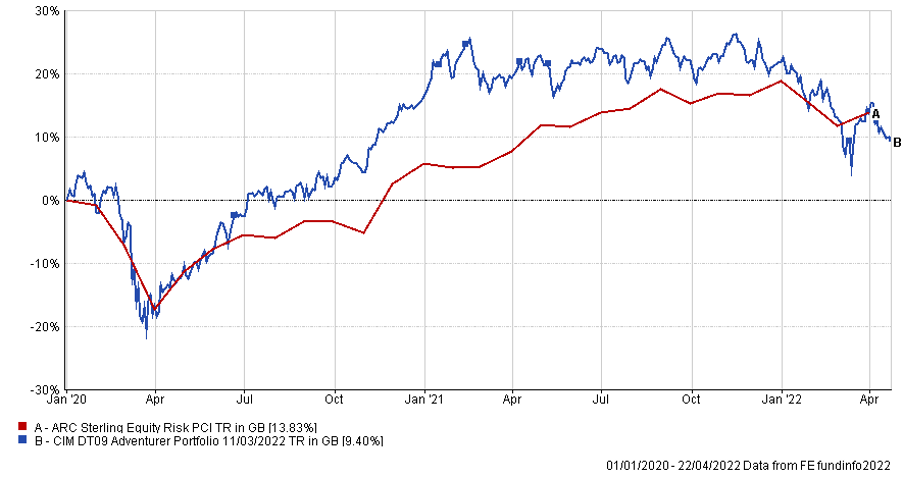
*Past performance data covering the most recent five-year period is unavailable therefore only past performance data available since inception of the fund is illustrated.
The table below shows the annualised performance to the last quarter end:
| 31/03/21
to 31/03/22 |
31/03/20
to 31/03/21 |
||||
| CIM DT09 Adventurer Portfolio | -4.50% | 43.24% | |||
| ARC Equity Risk PCI | 5.63% | 30.35% |
Changes to the Adventurer model
There were no changes made to the Adventurer portfolio in April 2022
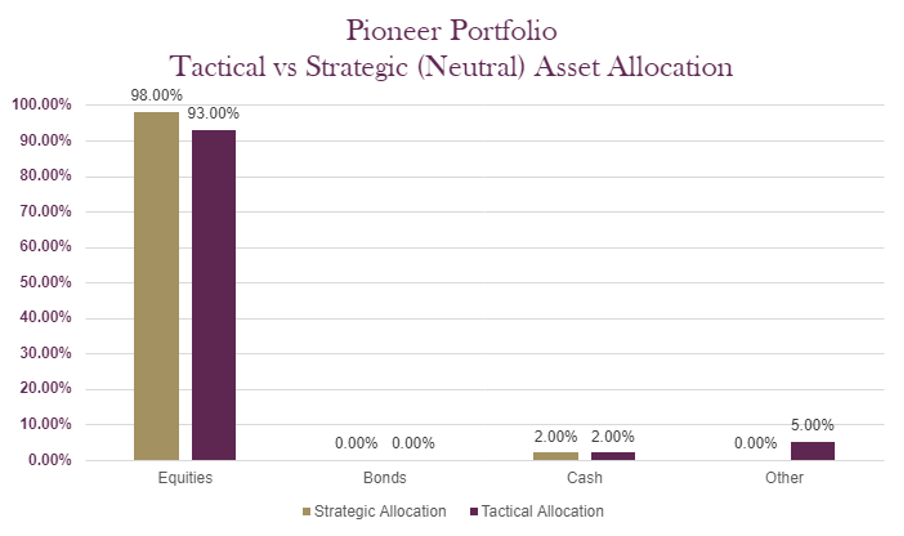
The charts below show the tactical asset allocation of the Pioneer Portfolio against the neutral/strategic asset allocation as well as the historical performance of the portfolio against a relevant benchmark(s) since the start of the available data.
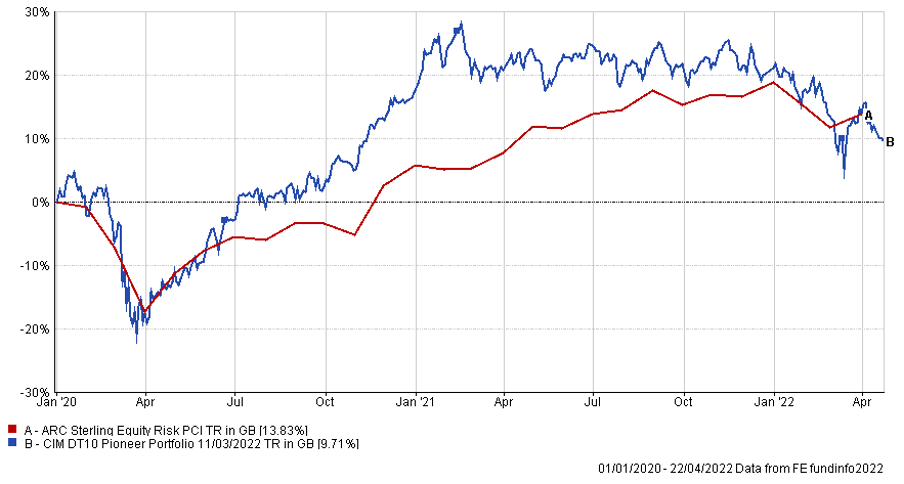
*Past performance data covering the most recent five-year period is unavailable therefore only past performance data available since inception of the fund is illustrated.
The table below shows the annualised performance to the last quarter end:
| 31/03/21
to 31/03/22 |
31/03/20
to 31/03/21 |
||||
| CIM DT10 Pioneer Portfolio | -5.56% | 46.53% | |||
| ARC Equity Risk PCI | 5.63% | 30.35% |
Changes to the Pioneer model
There were no changes made to the Pioneer portfolio in April 2022
The content of this article does not constitute financial advice and you may wish to seek professional advice based on your individual circumstances before making any financial decisions.
Any investment performance figures referred to relate to past performance which is not a reliable indicator of future results and should not be the sole factor of consideration when selecting a product or strategy. The value of investments, and the income arising from them, can go down as well as up and is not guaranteed, which means that you may not get back what you invested. Unless indicated otherwise, performance figures are stated in British Pounds. Where performance figures are stated in other currencies, changes in exchange rates may also cause an investment to fluctuate in value.
If you’d like more information about this article, or any other aspect of our true lifelong financial planning, we’d be happy to hear from you. Please call +44 (0)1625 466 360 or email [email protected].
Click here to sign-up to The Clarion for regular updates.