True lifelong financial planning for the serious business of life.
True lifelong financial planning
for the serious business of life.
True lifelong financial planning for the serious business of life.
True lifelong financial planning
for the serious business of life.
Tags: Adventurer Portfolio, Defender Portfolio, Discretionary Investment Management, Explorer Portfolio, funds, investment, Meridian Portfolio, MGTS Clarion Explorer, MGTS Clarion Meridian, MGTS Clarion Prudence, MTGS Clarion Navigator, Navigator Portfolio, Pioneer Portfolio, Prudence Portfolio, Voyager Portfolio
Category:
Investment management
This article provides a brief overview of the topics discussed in the recent investment committee meeting and the decisions made following those discussions.
The following notes summarise the main points discussed by the Investment Committee.
Covid-19 stimulus exceeds $18 trillion or 21% of global GDP in 2020/21.
Vaccine strategy provides light at the end of the tunnel, but risks of variants remain.
The eviction moratorium imposed by the Centres for Disease Control and Prevention in America came to an end recently without renewal, potentially exposing millions to eviction if federal funds cannot reach them in time.
The two-year pause of the US debt ceiling came to an end with no agreement from Congress about a new limit, meaning the US treasury will run out of money if an agreement is not reached in the next few months.
The Chinese government intervened heavily in tech companies and remote tutoring companies, sending share prices plummeting.
Bond yields should have edged higher following a rise in inflation but, with fears of the new Covid variant spreading quickly and postponing the recovery, they ended July slightly lower.
Real yields on government bonds are deeply negative and, if inflation is not transitory, the value of fixed-income investments will depreciate quickly once higher inflation expectations are priced in.
Bonds cannot be treated as low-risk assets in this market environment, providing a certain loss in value in real terms.
Value rotation stalls but we expect it to resume.
UK assets continue to look attractive with Brexit re-positioning underway, the economy now re-open and significant savings due to be spent by consumers.
In the US, the Fed is under pressure to start tapering and raise interest rates earlier than the initial schedule targeting in 2024 and the revised schedule targeting in 2023.
Jerome Powell retains his view that current rises in inflation are transitory and it will revert back in the coming months.
Lower average returns and higher volatility for the next decade.
Diversification necessary as ‘false positives and negatives’ likely.
The UK remains the most attractive developed equity market on valuation terms, trading at a significant discount to peers. With a successful vaccine rollout and self-isolation requirements loosened, the UK economy should see relative outperformance against other countries. There is strong potential for upward re-rating of equities on this basis, and our overweight position reflects our confidence in this scenario.
US mega-cap tech stocks trading on high earnings multiples are most at risk from rising bond yields, and this could trigger a correction. With US inflation continuing to run in excess of expectation, the possibility that the Federal Reserve will have to undertake quantitative tightening in some capacity in the near future increases. The possibility that markets end up in another taper tantrum is plausible and would likely see yields rise. The debt ceiling standoff in Congress could also affect bond markets and hamper the Treasury’s ability to issue new debt instruments. Our US positioning is underweight due to these factors.
Bonds remain deeply unattractive from an investment perspective, with the vast majority of bonds yielding less than inflation, resulting in a real-terms loss to maturity even in the present conditions.
The current strategy is well placed should bond yields rise as we anticipate. Our short-duration bond positioning ought to outperform, and rising yields would also weigh upon growth equities.
The portfolios are blended in order to avoid style bias and to provide diversification to help offset the sort of stock-specific risks we have seen in China recently.
For a fuller version of Clarion’s Economic and Stock Market Commentary, written by Clarion Group Chairman Keith Thompson, please click here.
The charts below show the tactical asset allocation of the Defender Portfolio against the neutral/strategic asset allocation as well as the historical performance of the portfolio against a relevant benchmark since the start of the available data.
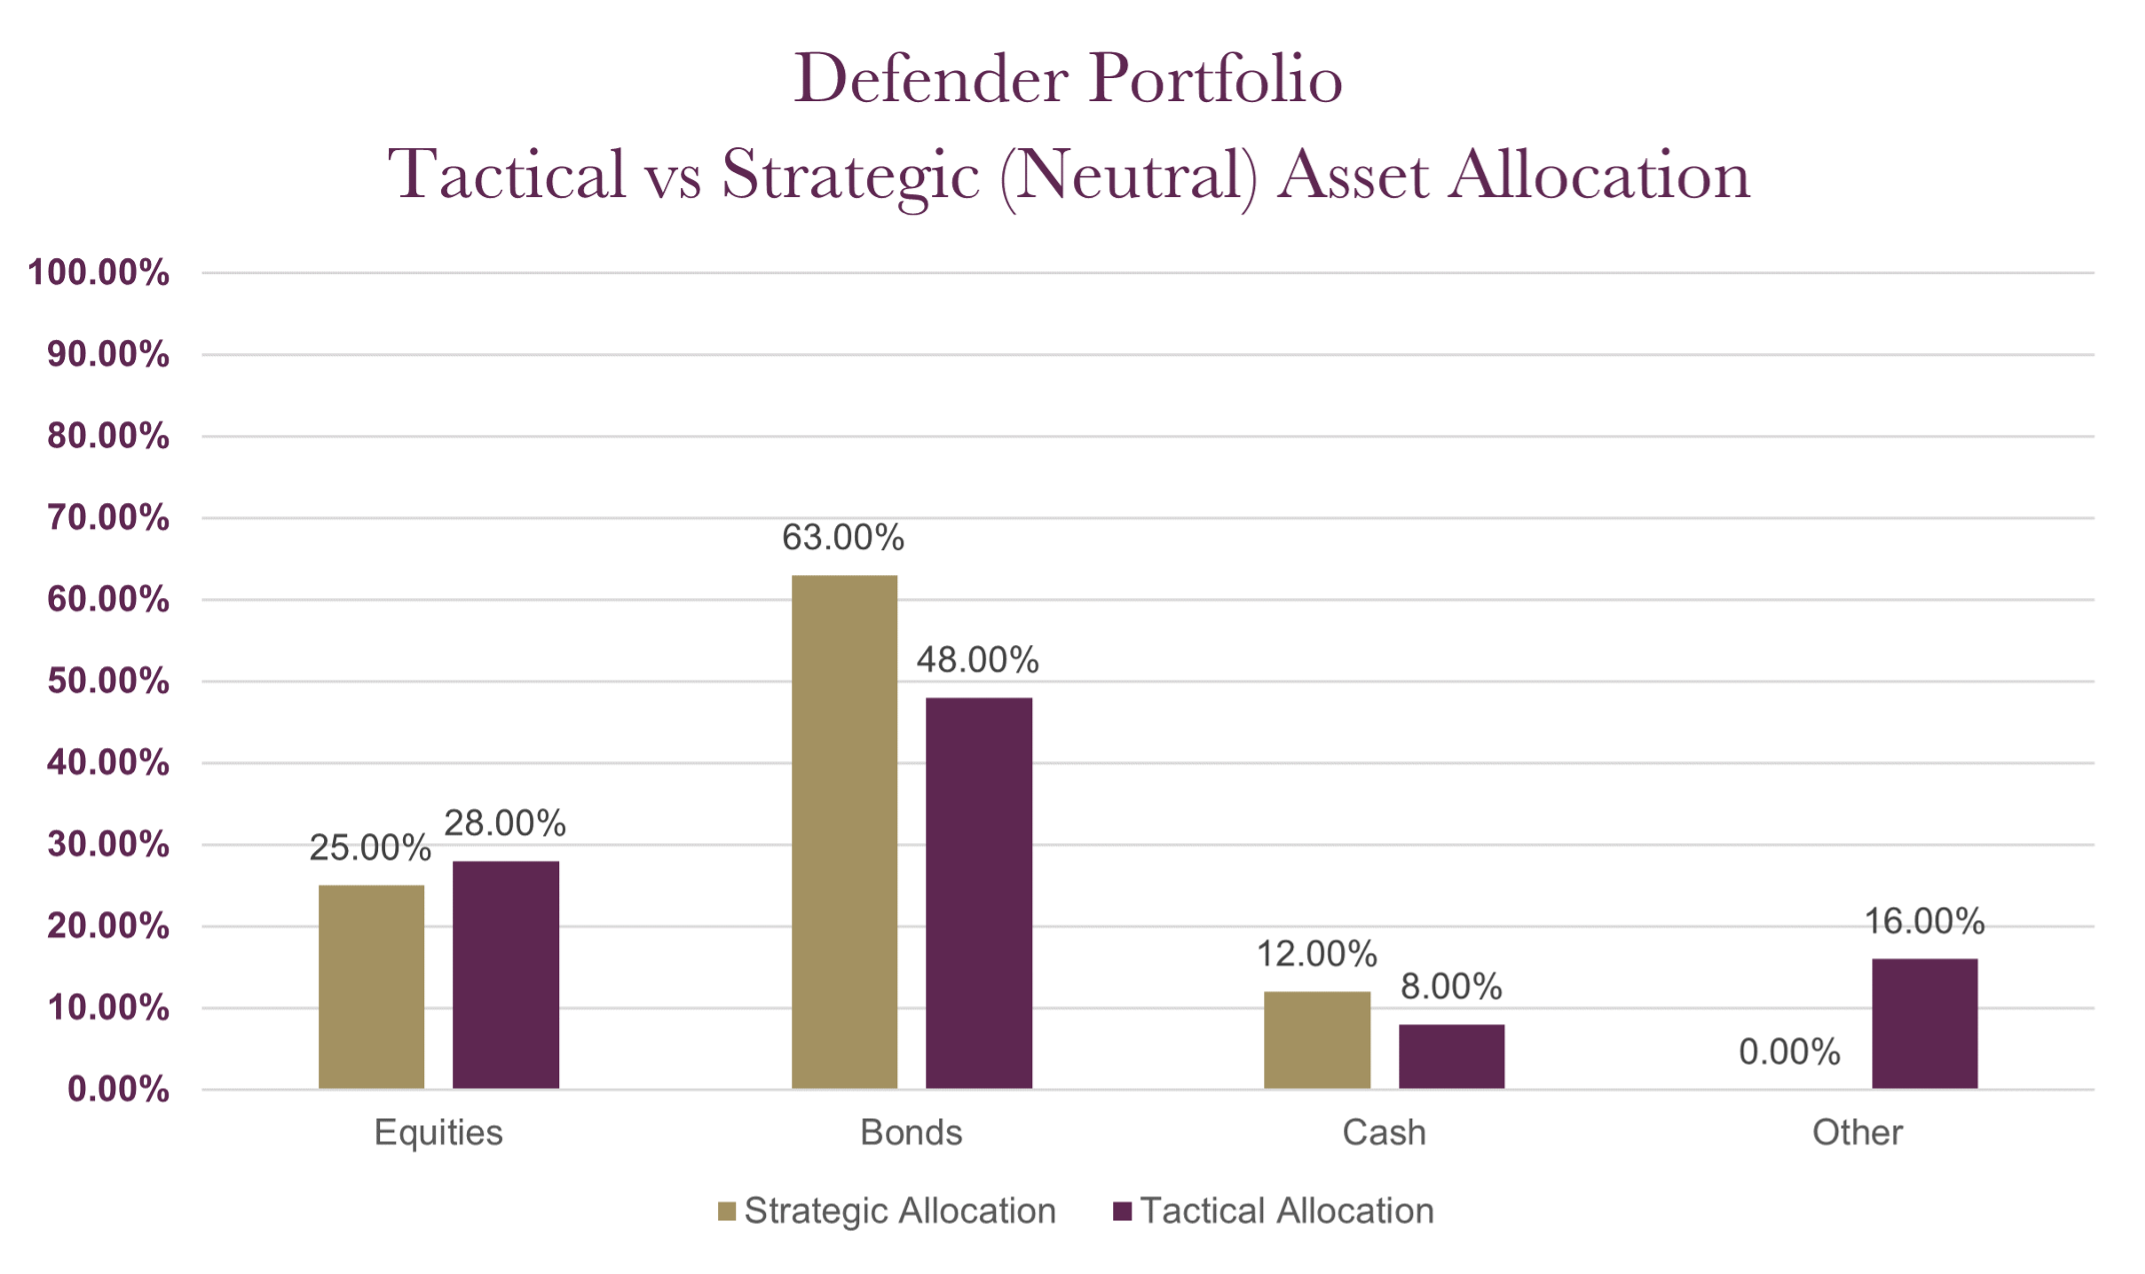
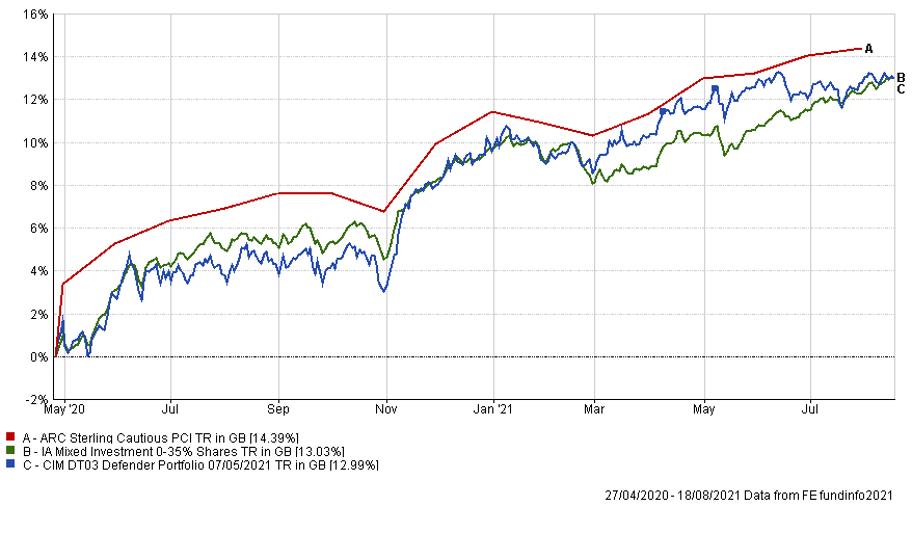
The table below shows the annualised performance to the last quarter end:
| 30/06/20 to 30/06/21 | |
| CIM DT03 Defender Portfolio | 7.35% |
| ARC Sterling Cautious PCI | 7.13% |
| IA Mixed Investment 0-35% Shares | 6.64% |
The charts below show the tactical asset allocation of the Prudence Portfolio against the neutral/strategic asset allocation as well as the historical performance of the portfolio against a relevant benchmark(s) since the start of the available data.
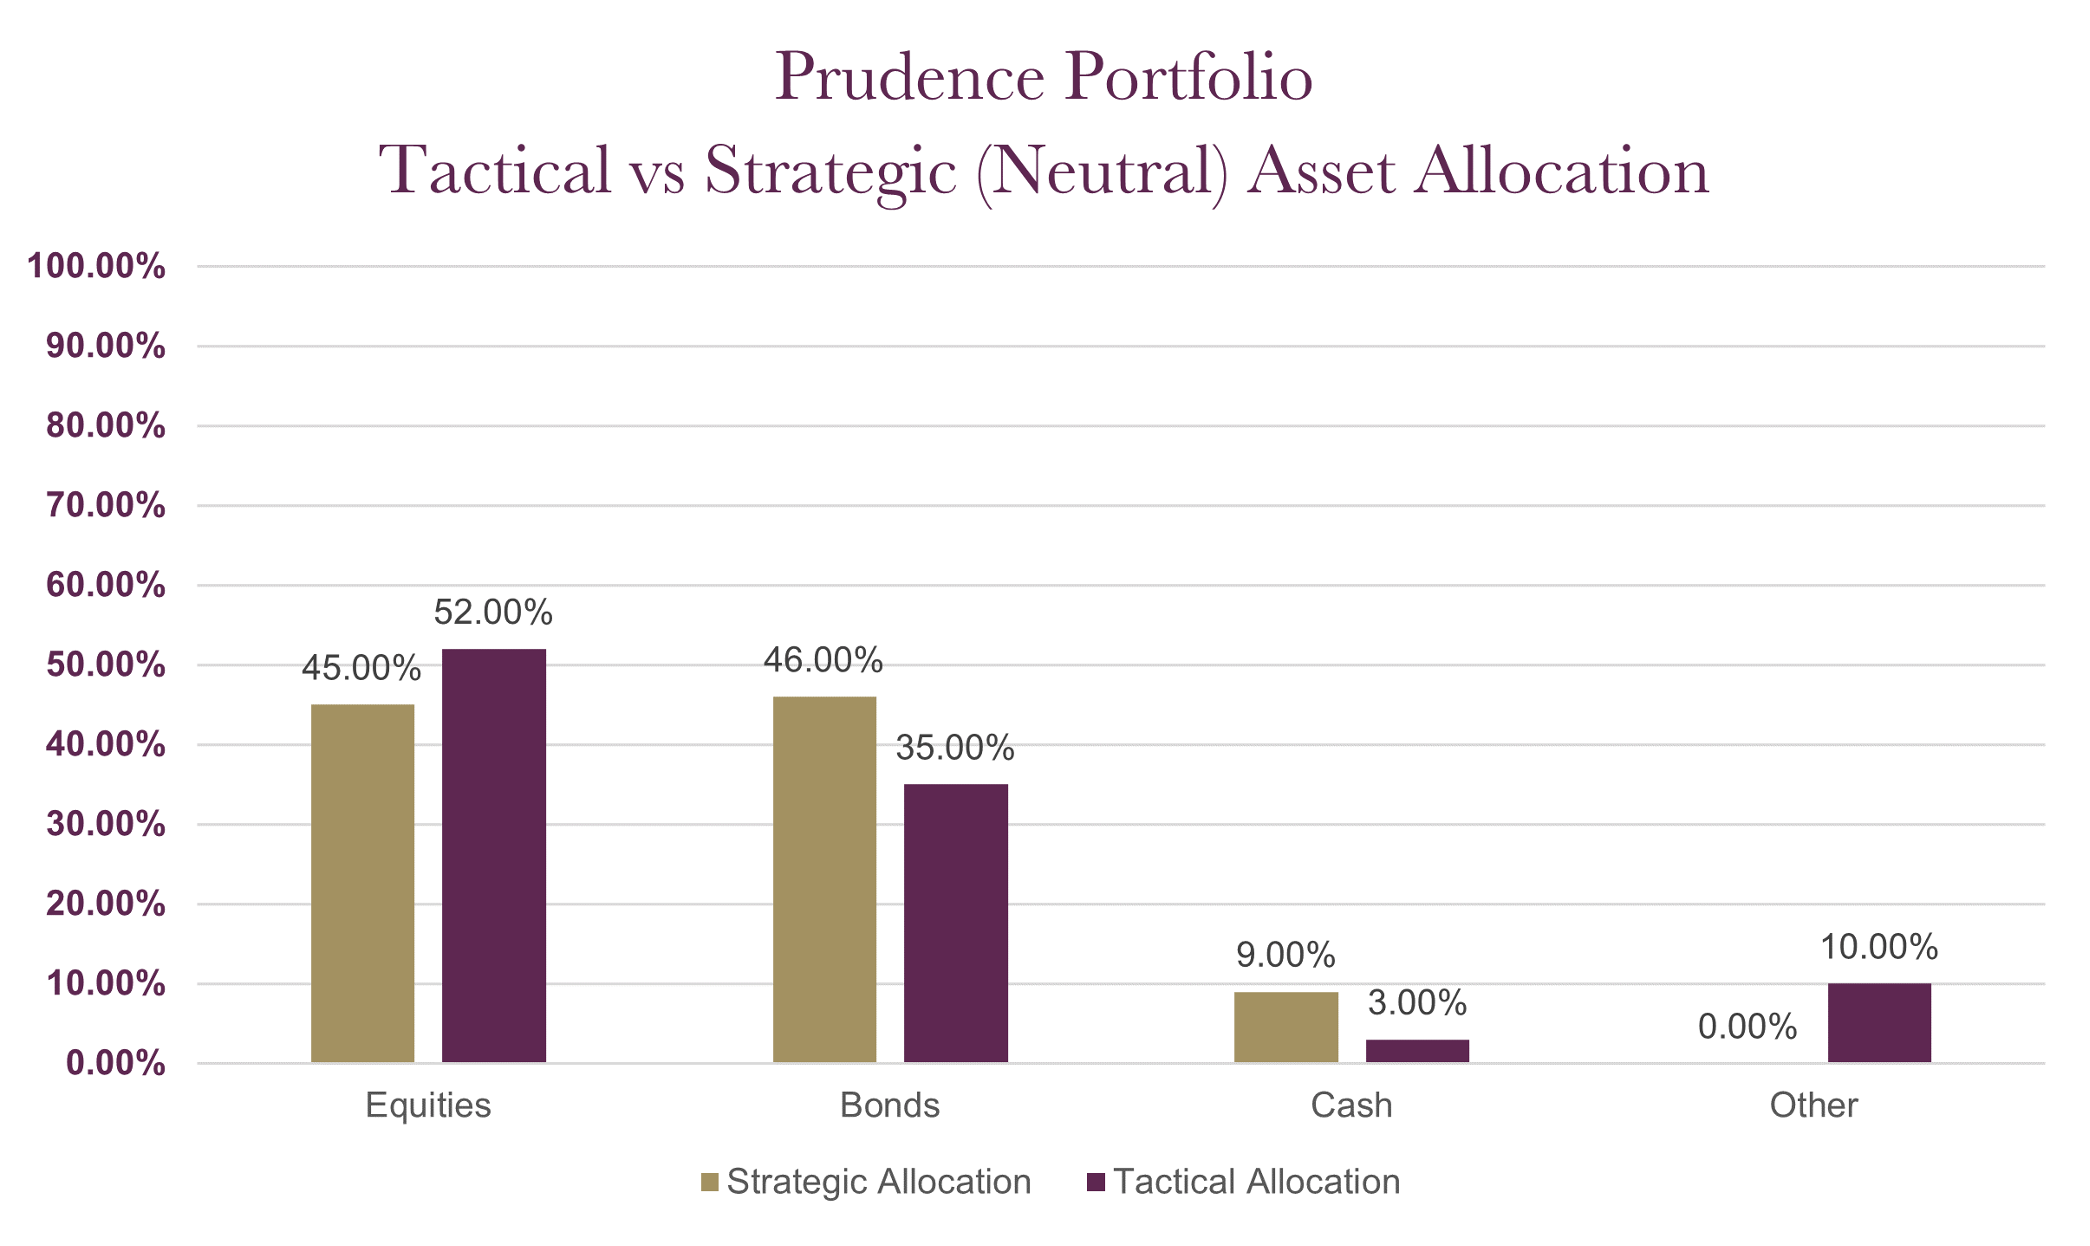
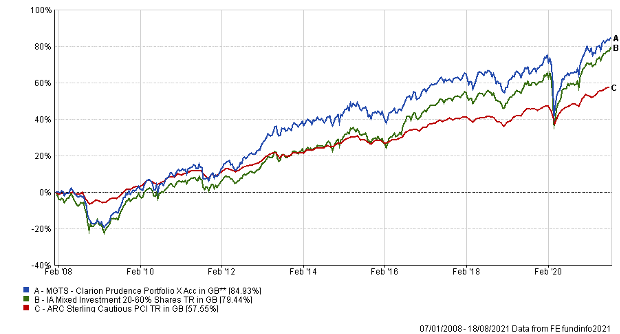
The table below shows the annualised performance to the last quarter end:
| 30/06/20 to 30/06/21 | 30/06/19 to 30/06/20 | 30/06/18 to 30/06/19 | 30/06/17 to 30/06/18 | 30/06/16 to 30/06/17 | |
| MGTS Clarion Prudence X Acc | 12.32% | -1.60% | 0.69% | 2.35% | 11.44% |
| CIM DT04 Prudence Portfolio | 12.26% | -1.71% | 0.88% | 3.02% | |
| ARC Sterling Cautious PCI | 7.13% | 1.66% | 2.37% | 1.41% | 6.53% |
| IA Mixed Investment 20-60% Shares | 12.10% | -1.30% | 0.69% | 1.83% | 11.19% |
The charts below show the tactical asset allocation of the Navigator Portfolio against the neutral/strategic asset allocation as well as the historical performance of the portfolio against a relevant benchmark(s) since the start of the available data.
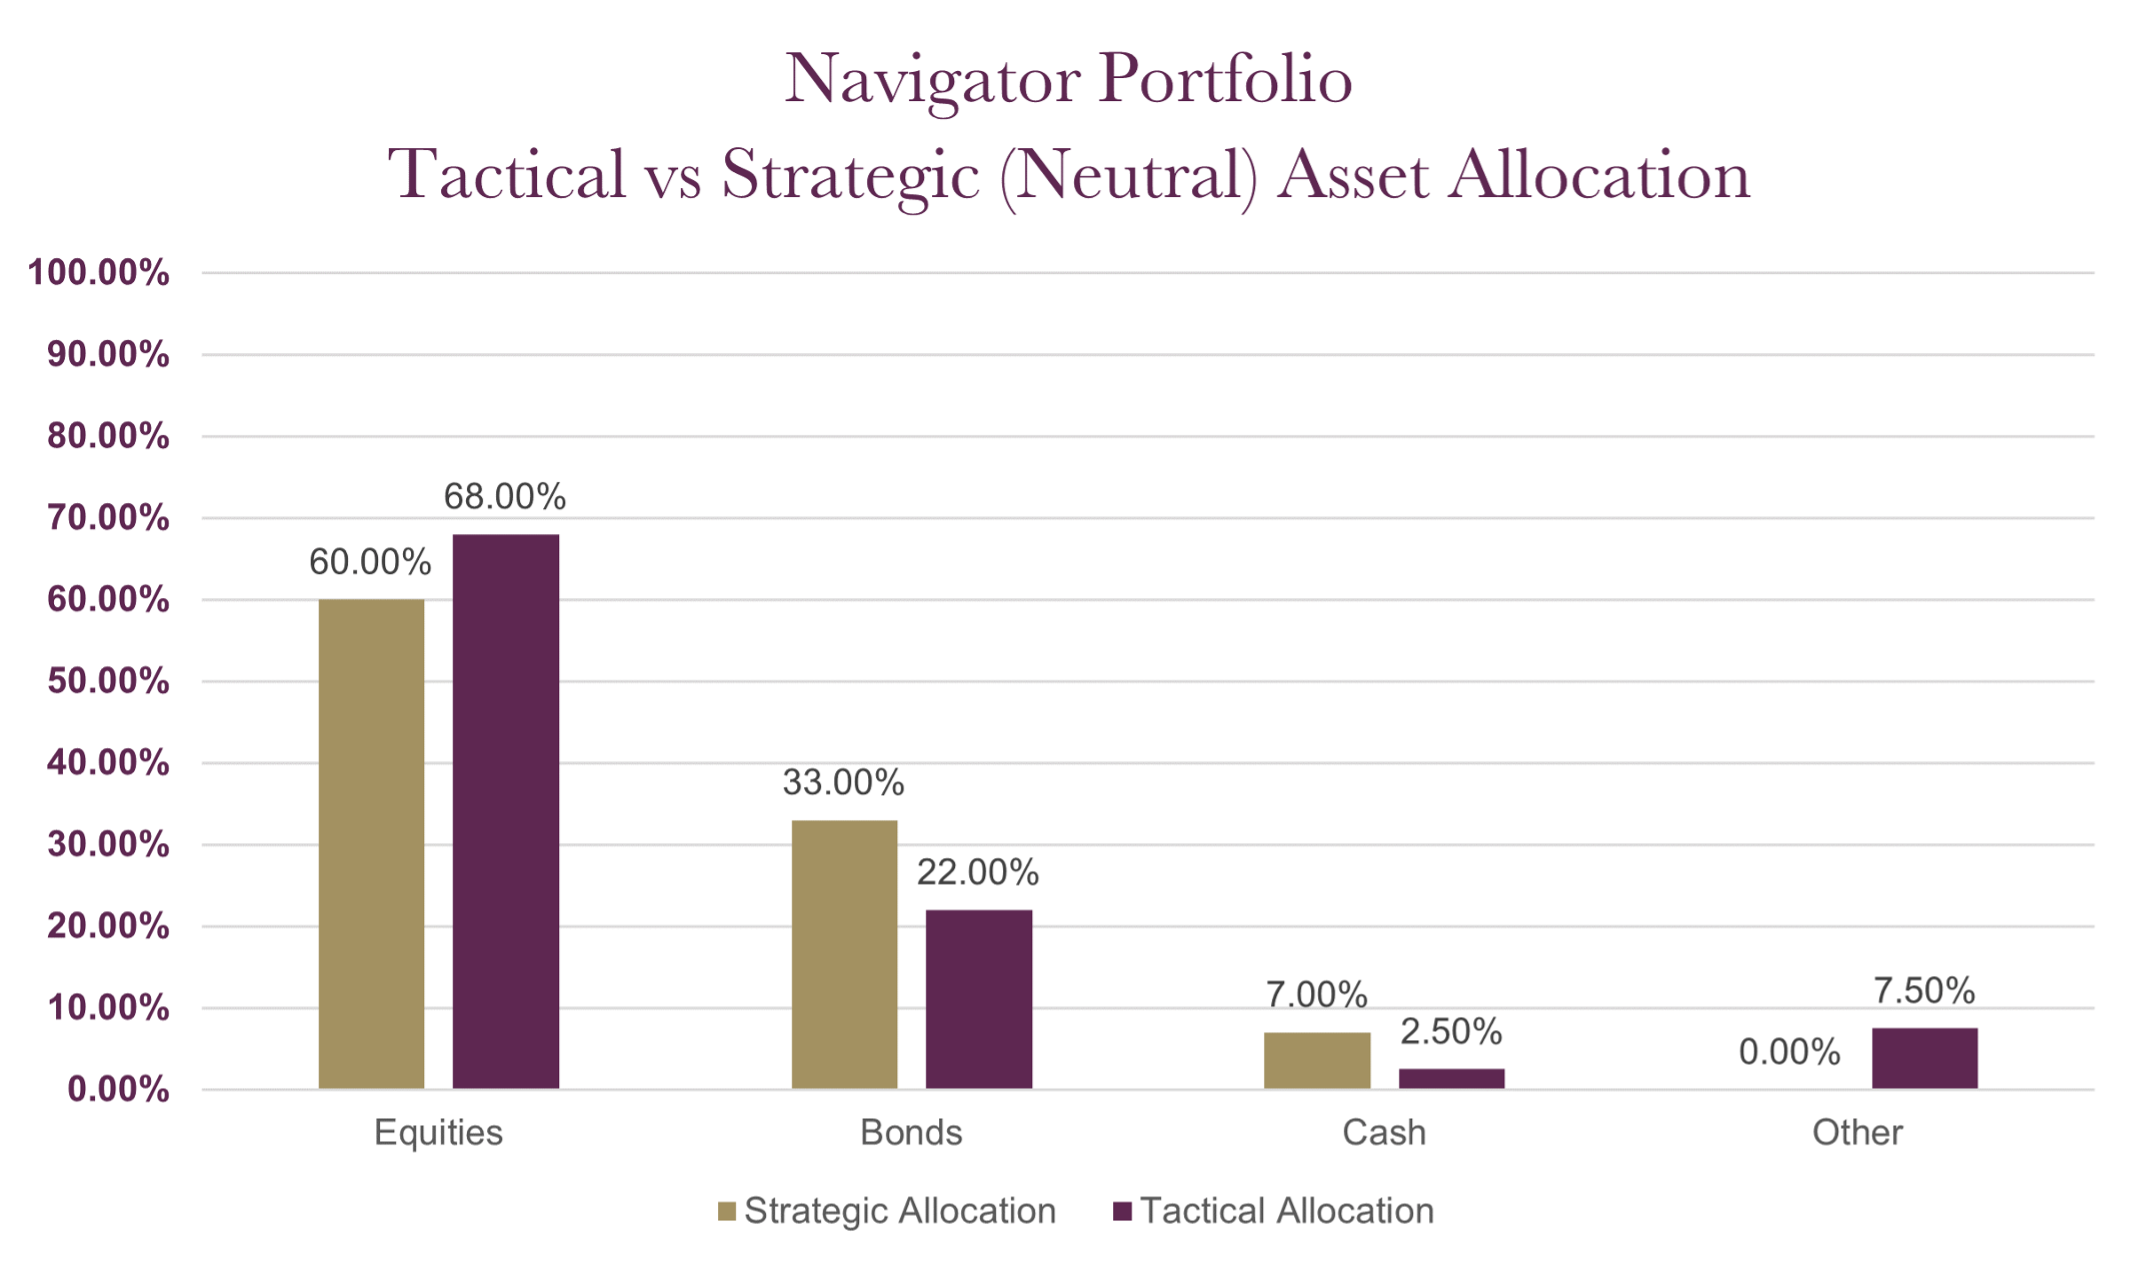
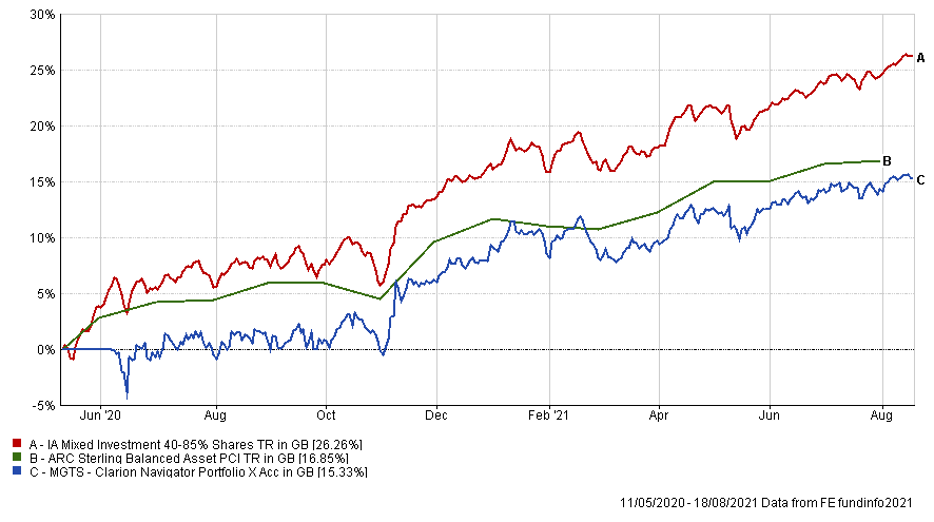
The table below shows the annualised performance to the last quarter end:
| 30/06/20 to 30/06/21 | |
| MGTS Clarion Navigator X Acc | 15.12% |
| CIM DT05 Navigator Portfolio | 16.14% |
| IA Mixed Investment 40-85% Shares | 17.29% |
The charts below show the tactical asset allocation of the Meridian Portfolio against the neutral/strategic asset allocation as well as the historical performance of the portfolio against a relevant benchmark(s) since the start of the available data.
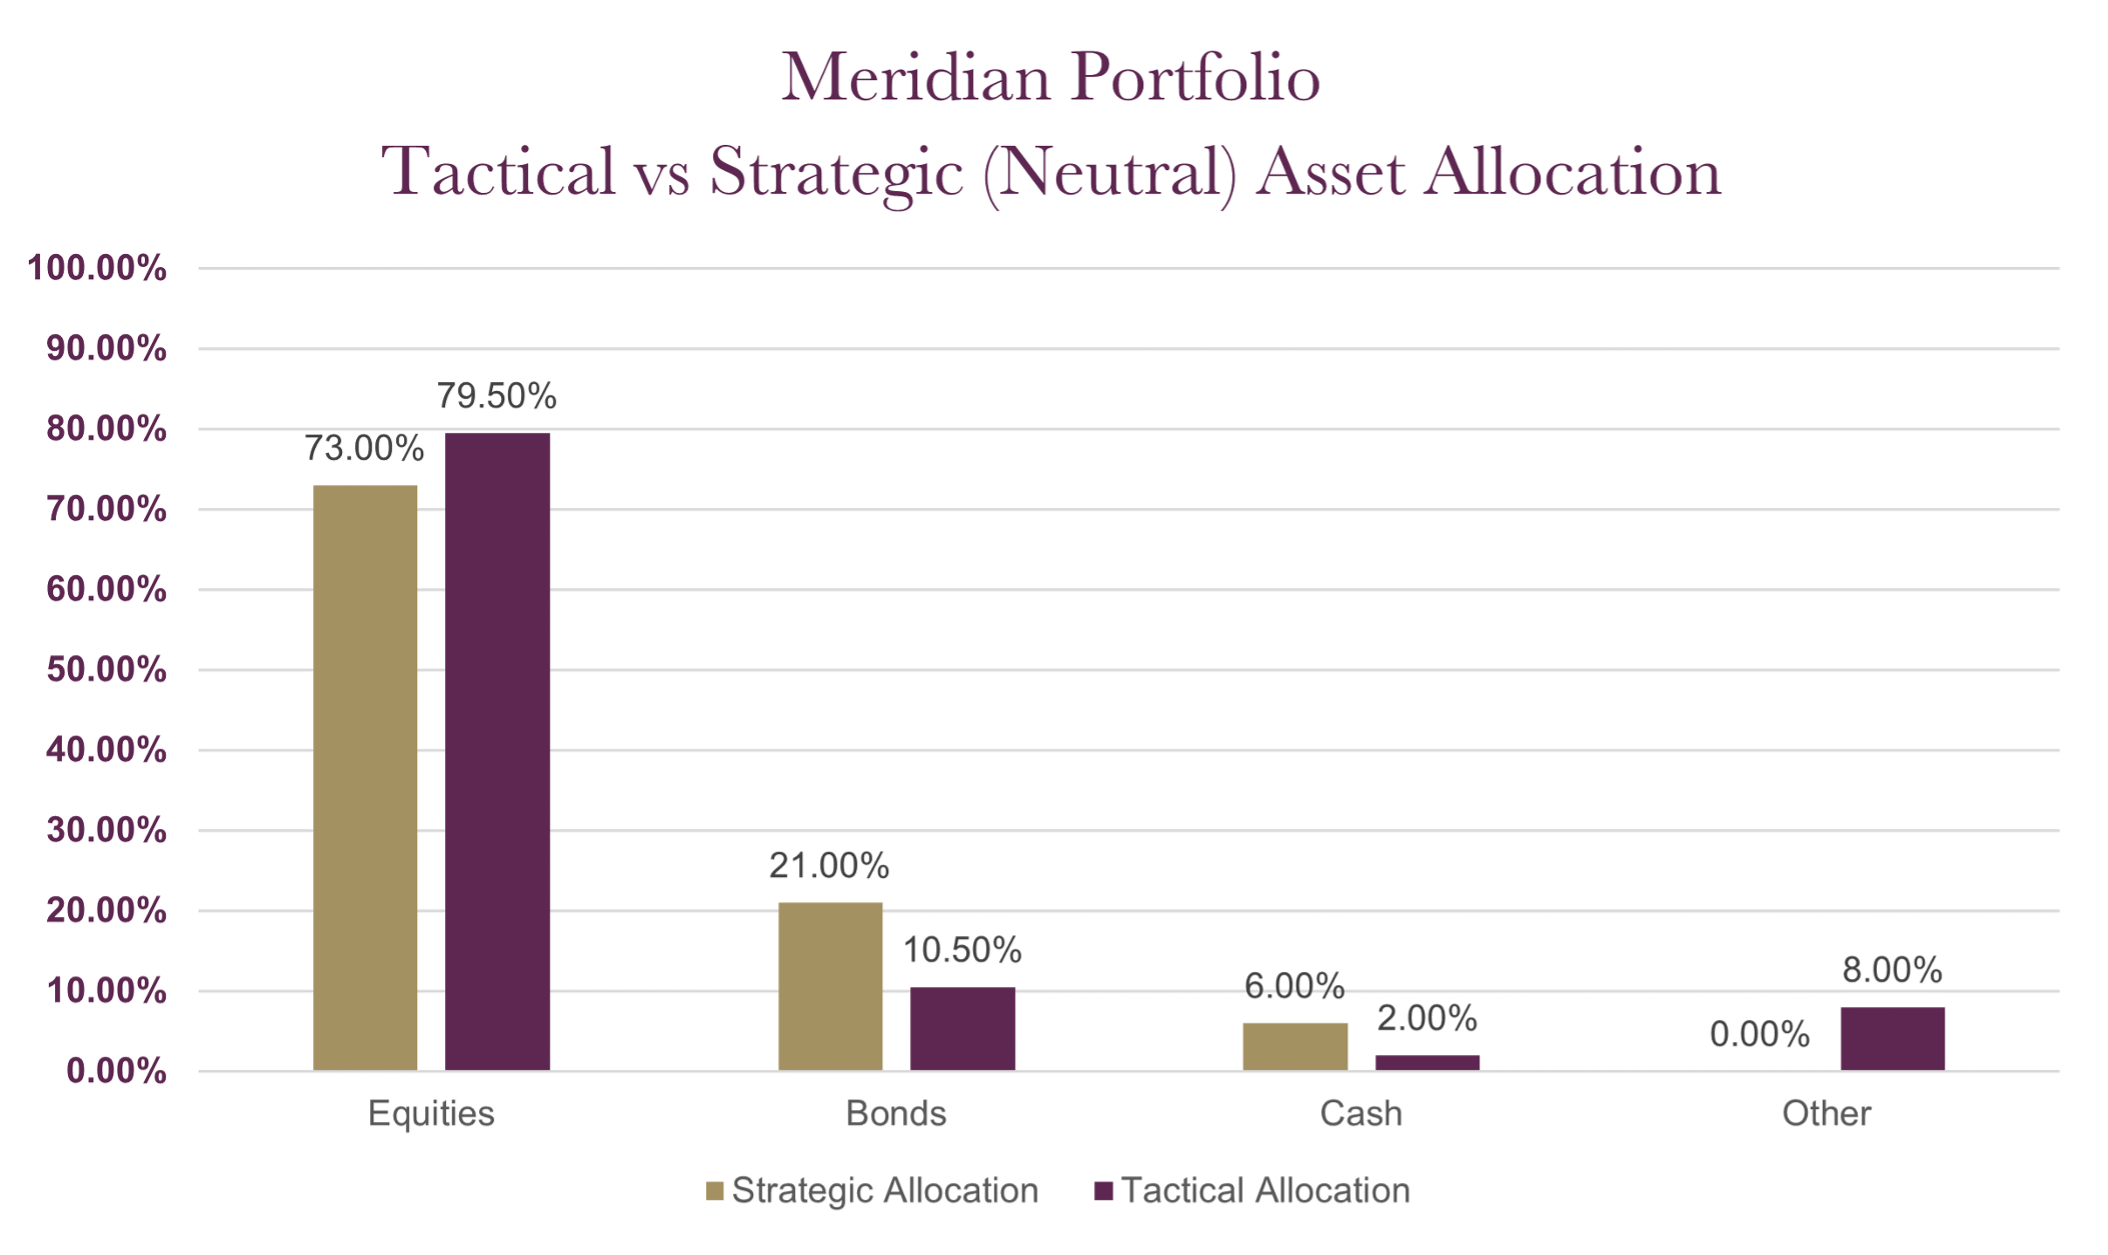
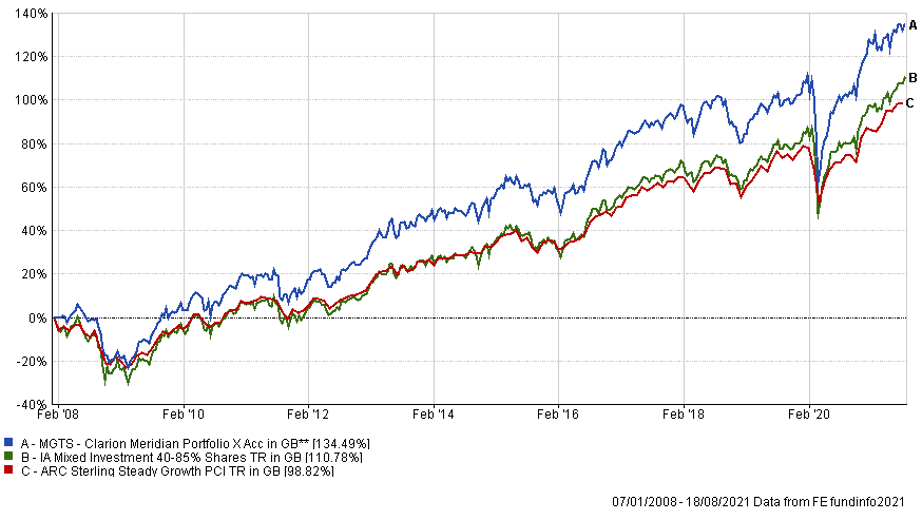
The table below shows the annualised performance to the last quarter end:
| 30/06/20 to 30/06/21 | 30/06/19 to 30/06/20 | 30/06/18 to 30/06/19 | 30/06/17 to 30/06/18 | 30/06/16 to 30/06/17 | |
| MGTS Clarion Meridian X Acc | 19.62% | -0.98% | 0.73% | 5.00% | 17.71% |
| CIM DT06 Meridian Portfolio | 19.73% | -0.62% | 3.08% | 5.17% | |
| ARC Steady Growth PCI | 15.37% | -0.51% | 3.54% | 4.92% | |
| IA Mixed Investment 40-85% Shares | 16.99% | -0.48% | 3.19% | 4.48% | 15.76% |
The charts below show the tactical asset allocation of the Explorer Portfolio against the neutral/strategic asset allocation as well as the historical performance of the portfolio against a relevant benchmark(s) since the start of the available data.
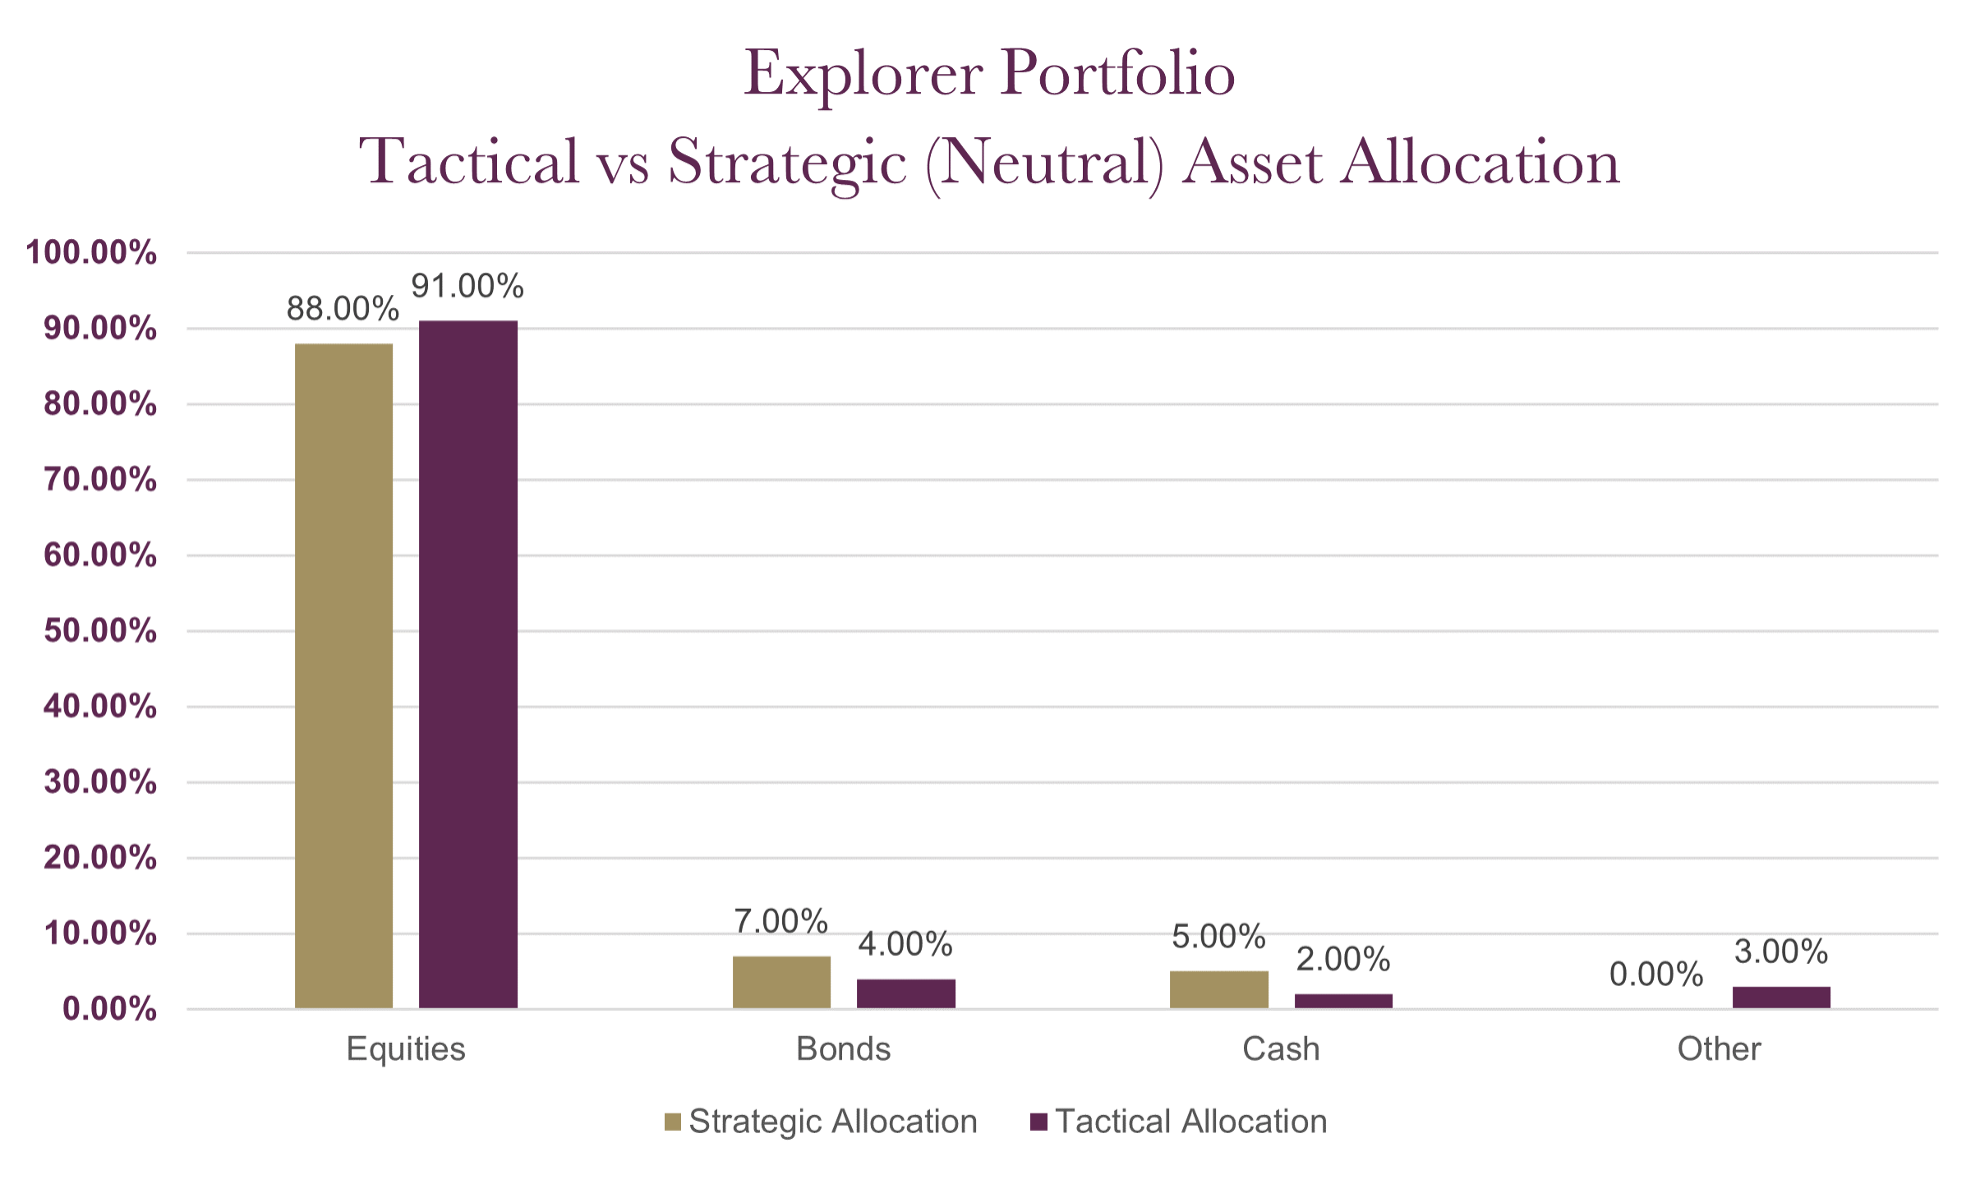
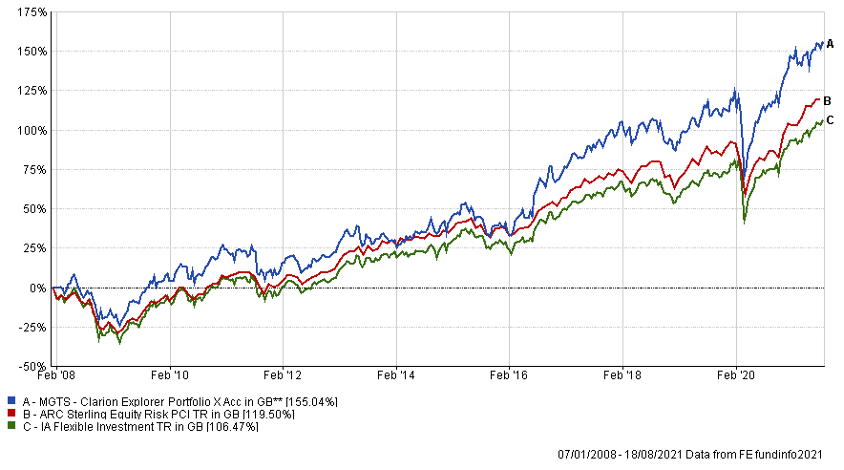
The table below shows the annualised performance to the last quarter end:
| 30/06/20 to 30/06/21 | 30/06/19 to 30/06/20 | 30/06/18 to 30/06/19 | 30/06/17 to 30/06/18 | 30/06/16 to 30/06/17 | |
| MGTS Clarion Explorer R Acc | 22.72% | -1.22% | 5.33% | 6.96% | 21.79% |
| CIM DT07 Explorer Portfolio | 22.39% | -1.22% | 5.61% | 8.57% | |
| ARC Equity Risk PCI | 20.24% | -1.13% | 4.02% | 6.36% | 17.05% |
| IA Flexible Investment | 19.24% | -0.04% | 2.70% | 4.85% | 17.69% |
The charts below show the tactical asset allocation of the Voyager Portfolio against the neutral/strategic asset allocation as well as the historical performance of the portfolio against a relevant benchmark(s) since the start of the available data.
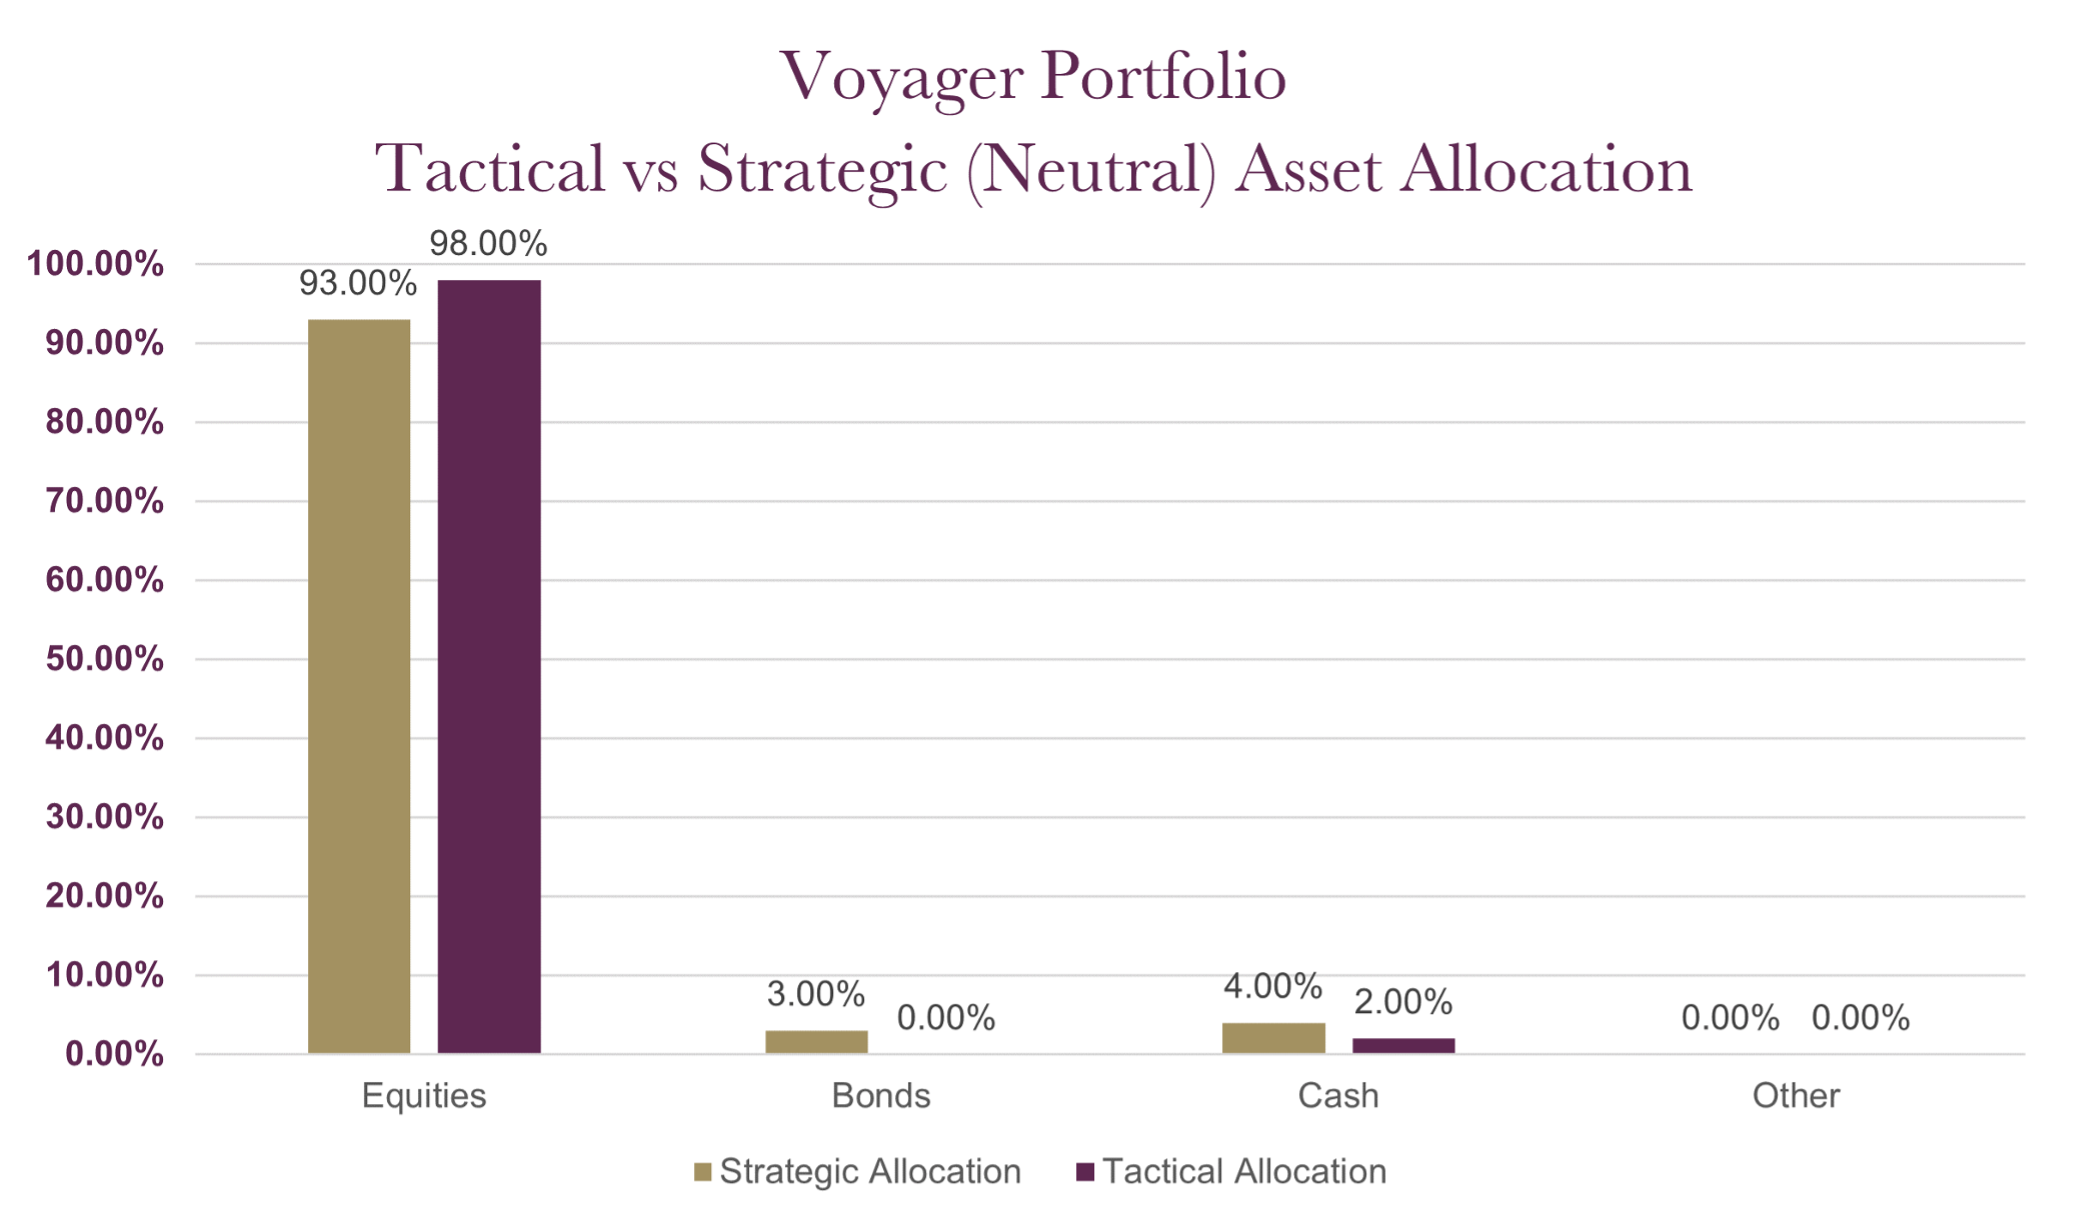
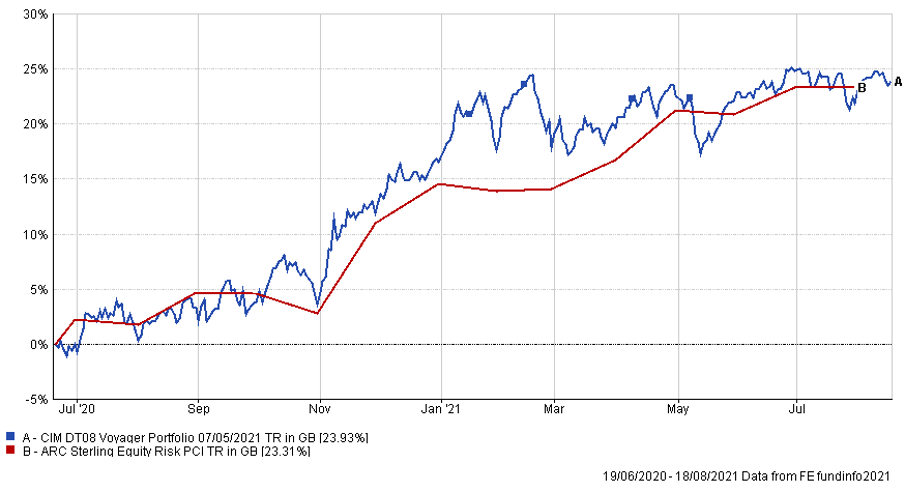
The table below shows the annualised performance to the last quarter end:
| 30/06/20 to 30/06/21 | 30/06/19 to 30/06/20 | 30/06/18 to 30/06/19 | 30/06/17 to 30/06/18 | 30/06/16 to 30/06/17 | |
| CIM DT08 Voyager Portfolio | 24.74% | ||||
| ARC Equity Risk PCI | 20.24% | -1.13% | 4.02% | 6.36% | 17.05% |
The charts below show the tactical asset allocation of the Adventurer Portfolio against the neutral/strategic asset allocation as well as the historical performance of the portfolio against a relevant benchmark(s) since the start of the available data.
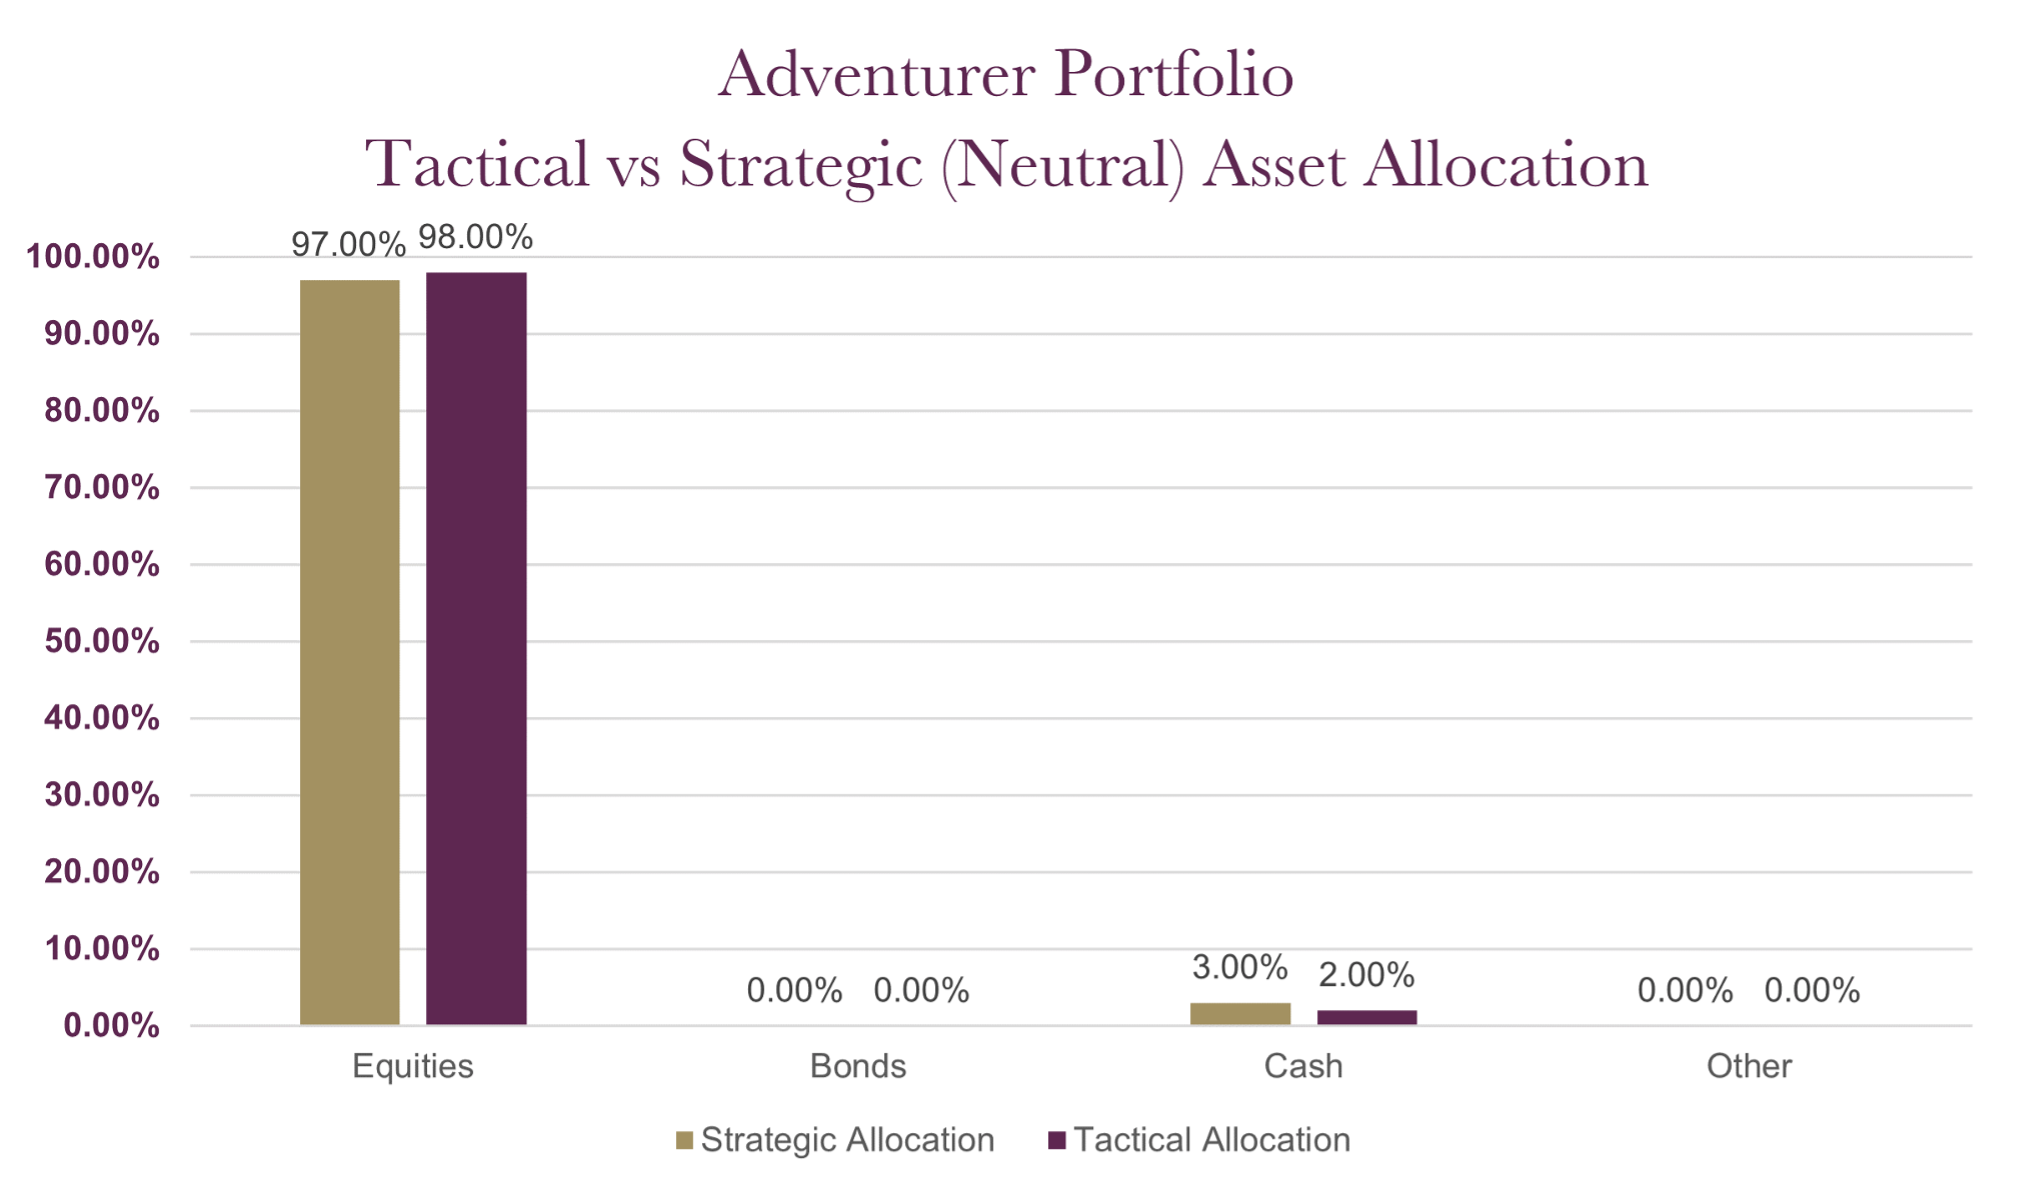
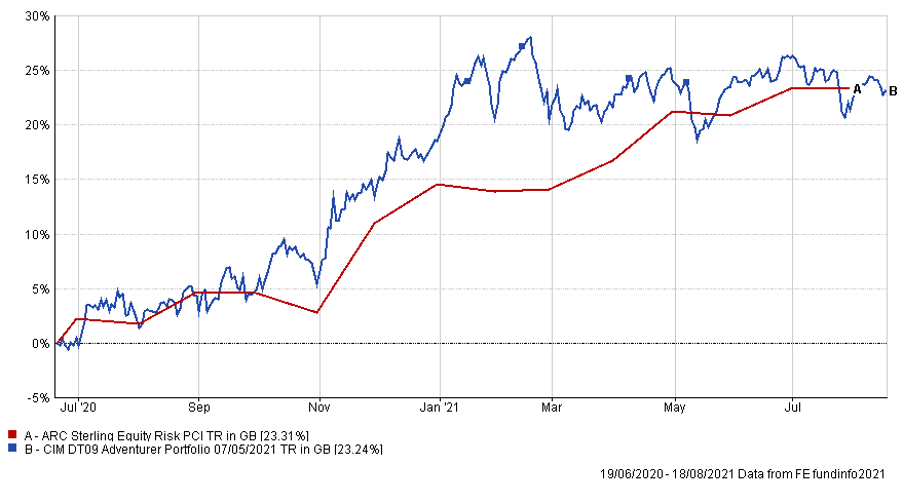
The table below shows the annualised performance to the last quarter end:
| 30/06/20 to 30/06/21 | 30/06/19 to 30/06/20 | 30/06/18 to 30/06/19 | 30/06/17 to 30/06/18 | 30/06/16 to 30/06/17 | |
| CIM DT09 Adventurer Portfolio | 25.49% | ||||
| ARC Equity Risk PCI | 20.24% | -1.13% | 4.02% | 6.36% | 17.05% |
The charts below show the tactical asset allocation of the Pioneer Portfolio against the neutral/strategic asset allocation as well as the historical performance of the portfolio against a relevant benchmark(s) since the start of the available data.
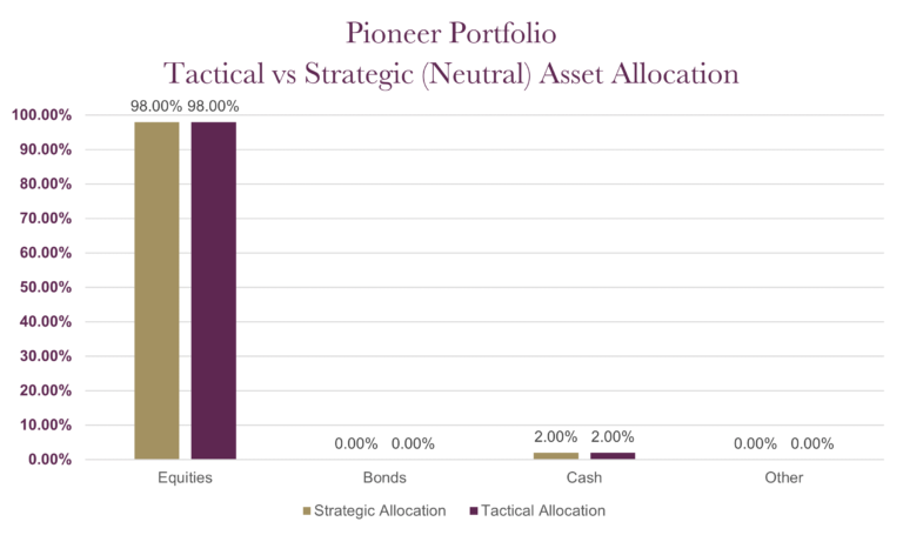
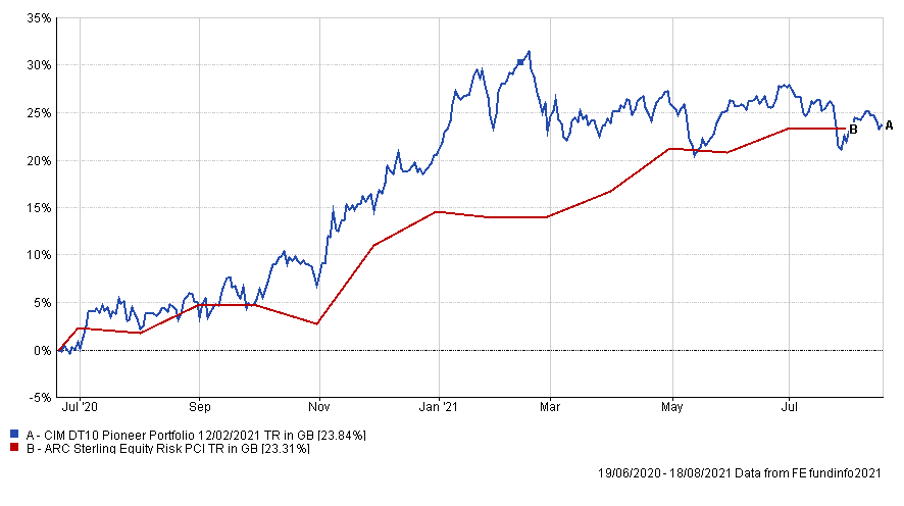
The table below shows the annualised performance to the last quarter end:
| 30/06/20 to 30/06/21 | 30/06/19 to 30/06/20 | 30/06/18 to 30/06/19 | 30/06/17 to 30/06/18 | 30/06/16 to 30/06/17 | |
| CIM DT10 Pioneer Portfolio | 26.74% | ||||
| ARC Equity Risk PCI | 20.24% | -1.13% | 4.02% | 6.36% | 17.05% |
Any investment performance figures referred to relate to past performance which is not a reliable indicator of future results and should not be the sole factor of consideration when selecting a product or strategy. The value of investments, and the income arising from them, can go down as well as up and is not guaranteed, which means that you may not get back what you invested. Unless indicated otherwise, performance figures are stated in British Pounds. Where performance figures are stated in other currencies, changes in exchange rates may also cause an investment to fluctuate in value.
If you’d like more information about this article, or any other aspect of our true lifelong financial planning, we’d be happy to hear from you. Please call +44 (0)1625 466 360 or email [email protected].
Click here to sign-up to The Clarion for regular updates.