Tags: Adventurer Portfolio, Defender Portfolio, Discretionary Investment Management, Explorer Portfolio, funds, investment, Meridian Portfolio, MGTS Clarion Explorer, MGTS Clarion Meridian, MGTS Clarion Prudence, MTGS Clarion Navigator, Navigator Portfolio, Pioneer Portfolio, Prudence Portfolio, Voyager Portfolio
Category:
Investment management
The Clarion Investment Committee met on Thursday 18th August 2022. The following notes summarise the main points of consideration in the investment Committee discussions.
For a fuller version of Clarion’s Economic and Stock Market Commentary, written by Clarion Group Chairman Keith Thompson, please click here
The Investment Committee have been identifying the risks of rising inflation and interest rates for a considerable time, being actively discussed at the monthly meetings and reflected in decisions taken. This month is no different.
The IC remains confident that its capital market assumptions & asset allocation strategies are valid in these market conditions. Following the rapid economic bounce back from Covid lockdowns, the IC had become increasingly concerned about the impact of rising inflation expectations taking hold. With UK inflation currently running at over 10% the highest level experienced for more than 40 years, it is understandably grabbing the headlines.
The corrosive impact of inflation on living standards and reduction in spending power of accumulated wealth should not be underestimated, even when at modest levels. So, what can be done when the Bank of England is warning of inflation reaching 13% and staying at ‘very elevated levels’ throughout much of next year, before eventually returning to its long-term 2% target in 2024?
Interest rates are already on the rise, with the biggest UK increase in 27 years announced earlier this month (the Bank of England base rate now stands at 1.75%). Similar measures to put up borrowing costs are happening elsewhere around the world, with the US Federal Reserve having hawkishly raised rates to a range of 2.25% to 2.5%, and the European Central Bank delivering its first interest rate hike in over a decade, taking the eurozone out of negative rates.
The current combination of stagnating economic growth and rising inflation, referred to as ‘stagflation’, is particularly troublesome for asset allocators. Tightening monetary policy to tackle stubbornly high inflation, at a time when the economy is already slowing, can be a very difficult tightrope for central banks to walk, if recession is to be avoided. This unwelcome scenario has been a risk of growing concern for the IC, even back when market consensus expected inflationary pressures to be temporary in nature.
A drawn-out stagflationary environment would create the most serious challenge for the multi-asset portfolio benchmarks. This is mainly due to the potential impact of sharply rising interest rates on bond values and their increasing correlation with equities. The latter has been magnified as yields have been driven to rock-bottom levels, due to unprecedented monetary stimulus post the 2008/09 Financial Crisis.
Using long-term trend analysis and research sources, the strategic asset allocation decisions taken by the IC over a number of years can be summarised below:
The multi-asset benchmarks, which have been running since 2008 have experienced periods of considerable market stress, but these decisions have helped prove them to be extremely resilient and perform in line with our long-term expectations.
As we navigate these prevailing cross-currents of acute economic and geo-political uncertainties, the IC will continue its laser focus on ensuring the benchmarks remain best positioned for long-term investors looking for protection of their wealth against both inflation and volatility.
Continuing to hold diversified high-quality assets over the longer term remains the appropriate method for allocation of investor capital.
Keith W Thompson
Clarion Group Chairman
August 2022
Creating better lives now and in the future for our clients, their families and those who are important to them.
The chart below shows the historical performance of the Defender Portfolio against a relevant benchmark since the start of the available data.
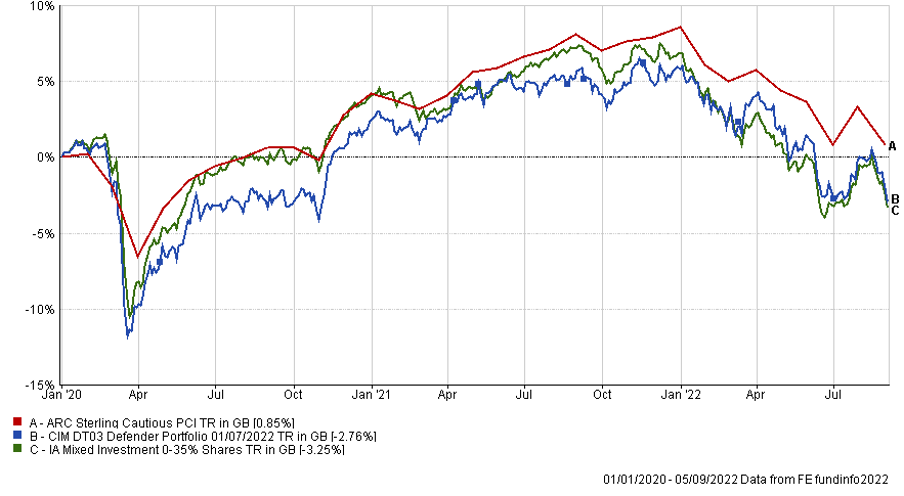
The table below shows the annualised performance to the last quarter end:
| 30/06/21 30/06/20
to to 30/06/22 30/06/21 |
|
| CIM DT03 Defender Portfolio | -6.88% 7.80% |
| ARC Sterling Cautious PCI | -5.21% 7.25% |
| IA Mixed Investment 0-35% Shares | -8.57% 6.86% |
The chart below shows the historical performance of the Prudence Portfolio against a relevant benchmark since the start of the available data.
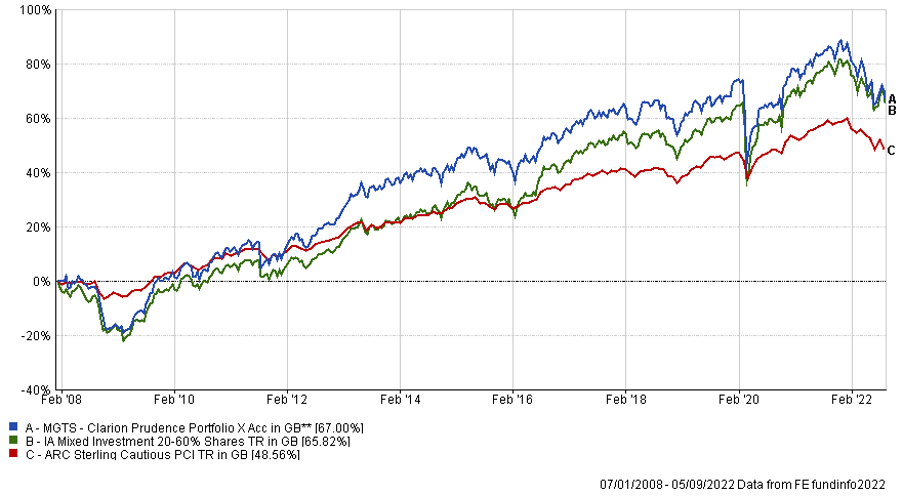
The table below shows the annualised performance to the last quarter end:
| 30/06/21 to 30/06/22 | 30/06/20 to 30/06/21 | 30/06/19 to 30/06/20 | 30/06/18 to 30/06/19 | 30/06/17 to 30/06/18 | |
| MGTS Clarion Prudence X Acc | -8.97% | 12.32% | -1.60% | 0.69% | 2.35% |
| CIM DT04 Prudence Portfolio | -9.06% | 12.26% | -1.27% | 1.43% | 3.56% |
| ARC Sterling Cautious PCI | -5.21% | 7.25% | 1.66% | 2.37% | 1.41% |
| IA Mixed Investment 20-60% Shares | -7.09% | 12.74% | -0.63% | 2.89% | 2.44% |
The chart below shows the historical performance of the Navigator Portfolio against a relevant benchmark since the start of the available data.
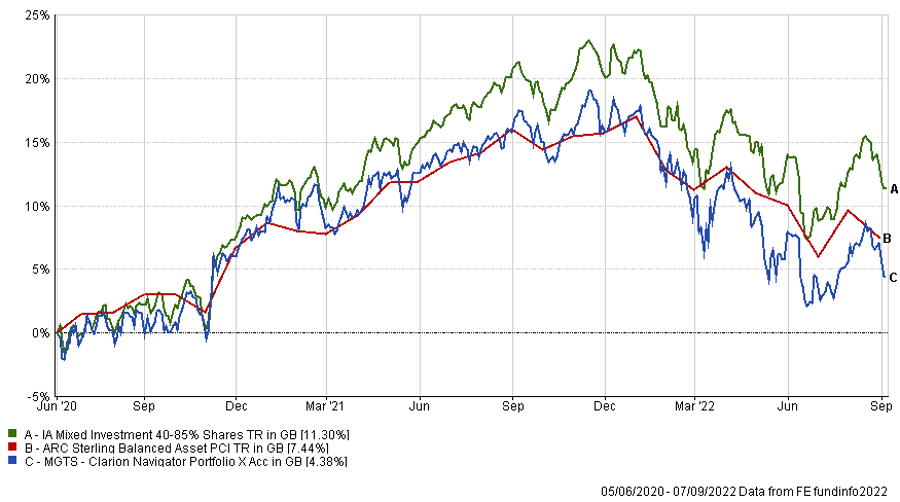
The table below shows the annualised performance to the last quarter end:
ARC Sterling Balanced Asset PCI-6.63%11.84%
| 30/06/21
to 30/06/22 |
30/06/20
to 30/06/21 |
|
| MGTS Clarion Navigator X Acc | -9.53% | 15.12% |
| CIM DT05 Navigator Portfolio | -10.01% | 16.14% |
| IA Mixed Investment 40-85% Shares | -7.16% | 17.29% |
The chart below shows the historical performance of the Meridian Portfolio against a relevant benchmark since the start of the available data.
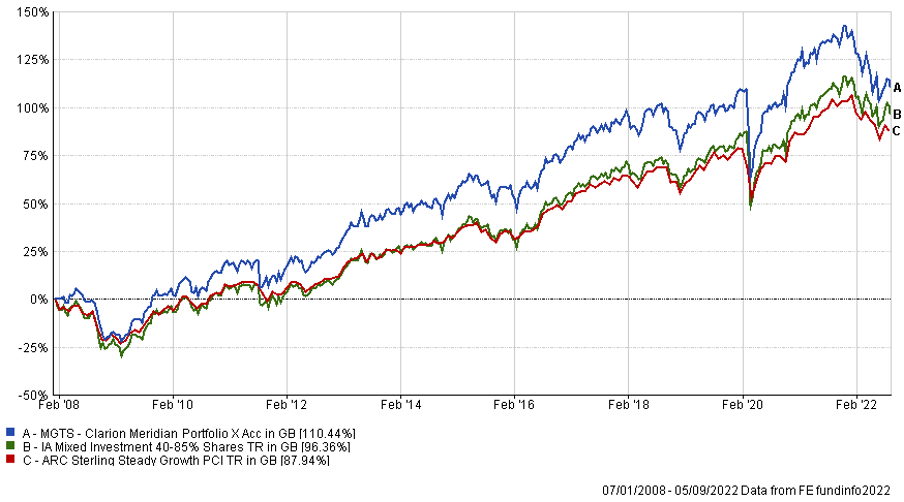
The table below shows the annualised performance to the last quarter end:
| 30/06/21 to 30/06/22 | 30/06/20 to 30/06/21 | 30/06/19 to 30/06/20 | 30/06/18 to 30/06/19 | 30/06/17 to 30/06/18 | |
| MGTS Clarion Meridian X Acc | -11.58% | 19.62% | -0.98% | 0.73% | 5.00% |
| CIM DT06 Meridian Portfolio | -12.00% | 19.73% | -0.51% | 3.26% | 5.36% |
| ARC Steady Growth PCI | -7.67%% | 15.87% | -0.51% | 3.54% | 4.92% |
| IA Mixed Investment 40-85% Shares | -7.16% | 17.29% | -0.11% | 3.62% | 4.85% |
The chart below shows the historical performance of the Explorer Portfolio against a relevant benchmark since the start of the available data.
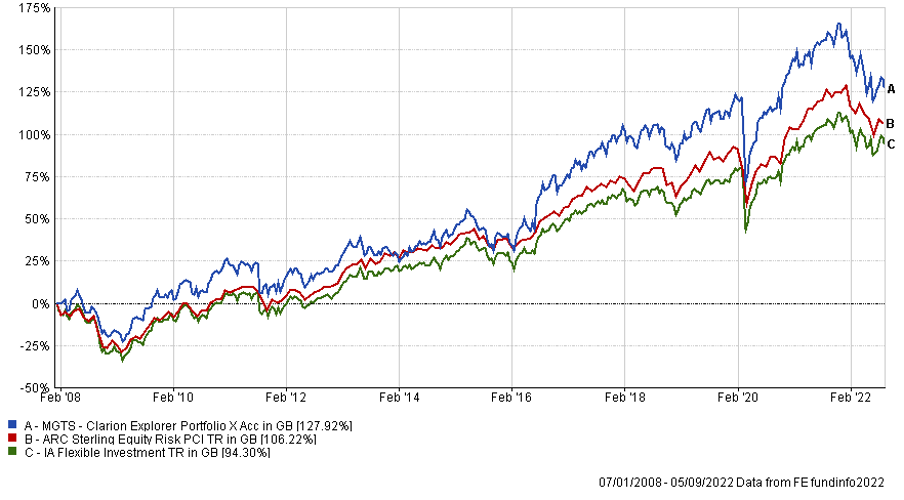
The table below shows the annualised performance to the last quarter end:
| 30/06/21 to 30/06/22 | 30/06/20 to 30/06/21 | 30/06/19 to 30/06/20 | 30/06/18 to 30/06/19 | 30/06/17 to 30/06/18 | |
| MGTS Clarion Explorer X Acc | -11.98% | 22.72% | -1.22% | 5.33% | 6.96% |
| CIM DT07 Explorer Portfolio | -12.73% | 22.46% | -1.09% | 5.69% | 8.60 |
| ARC Equity Risk PCI | -8.92% | 20.57% | -1.13% | 4.02% | 6.36% |
| IA Flexible Investment | -7.09% | 19.48% | 0.31% | 2.95% | 5.04% |
The chart below shows the historical performance of the Voyager Portfolio against a relevant benchmark since the start of the available data.
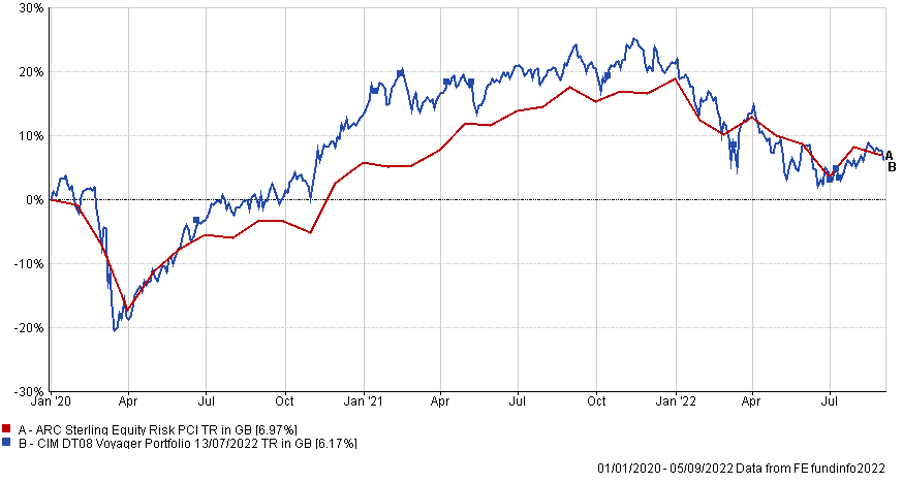
The table below shows the annualised performance to the last quarter end:
| 30/06/21
to 30/06/22 |
30/06/20
to 30/06/21 |
|||||
| CIM DT08 Voyager Portfolio | -14.46% | 24.81% | ||||
| ARC Equity Risk PCI | -8.92% | 20.57% |
The chart below shows the historical performance of the Adventurer Portfolio against a relevant benchmark since the start of the available data.
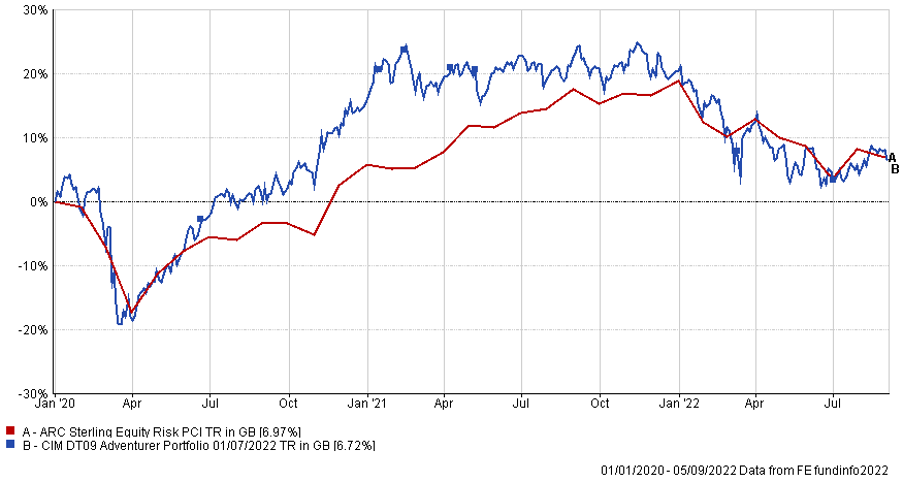
The table below shows the annualised performance to the last quarter end:
| 30/06/21
to 30/06/22 |
30/06/20
to 30/06/21 |
||||
| CIM DT09 Adventurer Portfolio | -15.60% | 25.54% | |||
| ARC Equity Risk PCI | -8.92% | 20.57% |
The chart below shows the historical performance of the Pioneer Portfolio against a relevant benchmark since the start of the available data.
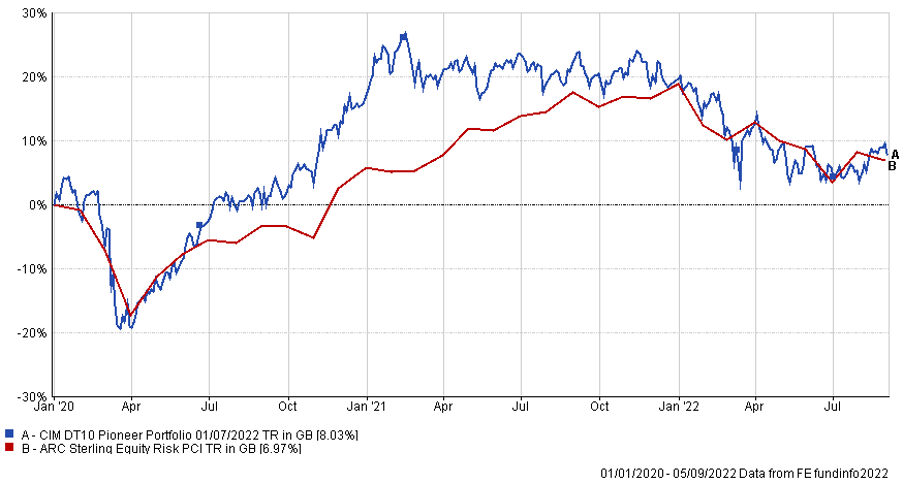
The table below shows the annualised performance to the last quarter end:
| 30/06/21
to 30/06/22 |
30/06/20
to 30/06/21 |
||||
| CIM DT10 Pioneer Portfolio | -15.18% | 26.74% | |||
| ARC Equity Risk PCI | -8.92% | 20.57% |
The content of this article does not constitute financial advice and you may wish to seek professional advice based on your individual circumstances before making any financial decisions.
Any investment performance figures referred to relate to past performance which is not a reliable indicator of future results and should not be the sole factor of consideration when selecting a product or strategy. The value of investments, and the income arising from them, can go down as well as up and is not guaranteed, which means that you may not get back what you invested. Unless indicated otherwise, performance figures are stated in British Pounds. Where performance figures are stated in other currencies, changes in exchange rates may also cause an investment to fluctuate in value.
If you’d like more information about this article, or any other aspect of our true lifelong financial planning, we’d be happy to hear from you. Please call +44 (0)1625 466 360 or email [email protected].
Click here to sign-up to The Clarion for regular updates.