Tags: Adventurer Portfolio, Defender Portfolio, Discretionary Investment Management, Explorer Portfolio, funds, investment, Meridian Portfolio, MGTS Clarion Explorer, MGTS Clarion Meridian, MGTS Clarion Prudence, MTGS Clarion Navigator, Navigator Portfolio, Pioneer Portfolio, Prudence Portfolio, Voyager Portfolio
Category:
Investment management
The Clarion Investment Committee met on the 17th of August 2023. The following notes summarise the main points of consideration in the Investment Committee discussions but have been updated to include commentary on recent events and the wider implications for financial markets.
Please click here to access the August Economic and Stock Market Commentary written by Clarion Group Chairman, Keith Thompson.
Something is going on in China. Of that we can be sure. What exactly is happening, maddeningly, is harder to discern, but any major and unscheduled change in personnel matters. Last month, the world’s second largest economy made two of them.
The most eye-catching is that Pan Gongsheng has been appointed as governor of China’s central bank, taking over from Yi Gang who reached the official retirement age (65). Pan is an experienced economist and is seen as a competent, skilled, and outspoken technocrat who can help steer China through its economic problems. Pan also has experience in this type of role, being a deputy governor of the bank since 2012. U.S. Treasury Secretary Janet Yellen referred to Pan as the “acting governor” during her recent Beijing visit, so it was clear he was being lined up for the top job.
Earlier in July, Pan was also named the Communist Party’s secretary for the People’s Bank of China (PBOC), so this represents the first time in around five years that one person holds the top two roles at the PBOC. Unlike central banks in the West, China’s central bank takes it’s orders from the government (namely the State Council led by Premier Li Qiang) and needs approval before making big decisions on interest rates or currency interventions.
Pan’s dual role could signify that big, co-ordinated moves are being planned to lift China’s economy. Investors are hoping for more financial boosts, especially after a recent interest rate cut but time will tell whether Pan’s appointment represents a change from the cautious approach taken under Yi’s leadership.
China exports fell sharply in July, dropping 14.5% compared to the previous year; global inflation and reduced demand for Chinese goods are largely to blame. However, the domestic market is also somewhat sluggish, disappointing investors who expected levels of demand to surge following the re-opening of the post-Covid economy. These factors combined mean that it is going to be difficult for China to reach their 5% growth target for 2023.
But there is a silver lining; China’s top brass have unveiled plans to reinforce its waning economy, and this was met with a buoyant response from the markets. The Yuan and various Chinese-listed stocks rallied, with the Hang Seng Index registering a 4% surge, followed by the CSI 300 and the Shanghai Composite, which rose by 3% and 2%, respectively. These investment endeavours predominantly aim at stimulating domestic demand. Such decisive economic manoeuvres can be attributed to the sustained turmoil in the property sector since the 2021 Evergrande debacle and the startling 21% unemployment rate reported in 2023’s second quarter.
Back in the UK, the Bank of England raised interest rates to a 15-year high of 5.25% and warned that borrowing costs are likely to remain elevated. Although inflation is slowing down, (declining more than expected to 6.8% in July) the economy is not out of the woods yet with the Monetary Policy Committee cautioning “it was too early to conclude that the economy is at or very close to a significant turning point”.
The bank’s updated forecasts suggest that even if interest rates rise further, in line with recent market expectations, it will still take until mid-2025 for inflation to fall to the Bank of England’s 2% target. It also said it expects GDP to remain steady at a quarterly pace of 0.2% in the near term, but to weaken as the effects of higher interest rates add up, though avoiding a recession.
UK house prices have recorded the largest annual drop in 14 years, as rising mortgage costs pile pressure on the property market, according to data from the Nationwide Building Society.
Prices for July fell 0.2% on the previous month and 3.8% compared with the same month last year, the largest fall since 2009, the Nationwide House price index showed. The average cost of a home in the UK is now £260,828. House prices have come under increasing pressure as lenders have increased mortgage costs in response to the Bank of England’s continued interest rate rises.
Financial markets see the UK facing a higher peak in rates than elsewhere because inflation risks appear to be greater. UK headline inflation has fallen less than in the US and the euro area since the start of the year and core inflation, which has moderated in the US and the euro, has reached a 30-year high. Markets are uneasy with US wage growth of 4.4% but more worried about wage growth of 6.6% in the UK.
However, it is important not to take market predictions about interest rates as gospel. These forecasts are notoriously volatile, shifting with new data and central bank rhetoric. If UK inflation and activity figures weaken, then rate expectations will also fall. This is what happened in the US back in March, with two-year bond yields falling by over 125bps (1.25%) in the space of less than a fortnight.
In the United States, the Federal Reserve, under the leadership of Chairman Jerome Powell, is hinting at more rate hikes (following an increase from 5.25% to 5.5% during July) to keep inflation in check. Nevertheless, he continues to proceed with caution, seeking to circumvent a profound recession and economic slump. Most policymakers endorse this approach, advocating for higher rates, which makes a rate reduction unlikely in this fiscal year.
Meanwhile, some developing economies are loosening their financial belts to stimulate growth. Brazil’s central bank, the Banco Central do Brazil, reduced their lending rate from 13.75% to 13.25% and signalled the expectation of further reductions in coming months. The rate of inflation in Chile, Mexico, and Columbia is also slowing (significantly in the case of the latter two).
The divergence in monetary policy between developed and developing countries could create a unique opportunity for businesses and consumers in these countries – as long as inflation doesn’t re-emerge following rate reductions.
The investment committee have persistently evaluated the duration of the underlying portfolios and the duration of the underlying bond funds has been gradually lengthened in recent months. The committee decided to replace a short duration bond fund with a strategy that targets the relatively attractive yields of government gilts with 1 – 10 years to maturity. The committee anticipates that inflation will stabilise at approximately 3.5%. With long-term gilts offering yields of up to 4.4%, the prospect of securing returns above inflation was deemed favourable.
Market valuations remain notably skewed, especially with U.S. tech stocks trading at historic peaks. Specifically, U.S. Tech is trading roughly two standard deviations above its average Price-to-Earnings (P/E) ratio, underscoring the committee’s rationale for maintaining a U.S. underweight stance. Conversely, the UK market is trading slightly below one standard deviation from its average P/E ratio. The managers believe this valuation anomaly is transitory and may not persist in the medium term, hence their continued overweight stance on the UK.
The committee project that over the medium term (approximately 3-5 years), the Asia Pacific and Emerging Markets regions are poised to outpace certain developed market economies. The stimulus provides an initial boost to Asia Pacific equities, with China’s role as a primary exporter casting a broader influence over the entire region. The committee anticipate that this surge will catalyse further growth, and the region will likely sustain this robust performance until it reverts closer to its historical average pricing multiples.
The key themes are as follows:
In the Committee’s view central banks are likely to shift from the previous inflation target of 2% to a higher figure or a floating range, which will most likely be around 3-4%. The amount of economic destruction required to bring inflation back to a 2% target would be too great to be justifiable. Coupled with multiple developed economies (US and Europe) trying to ease the reliance on supply chains from China, inflation is likely to be stickier, although much lower than current levels, than initially thought.
Continuing to hold a globally diversified portfolio of high-quality assets is important to provide resilience and grow the value of savings over the long term and remains the appropriate method for allocation of investor capital. Cash is unattractive as inflationary pressures, although moderating, look to be structurally long term.
Keith W Thompson
Clarion Group Chairman
August 2023
Creating better lives now and in the future for our clients, their families and those who are important to them.
The chart below shows the historical performance of the Defender Portfolio against a relevant benchmark since the start of the available data.
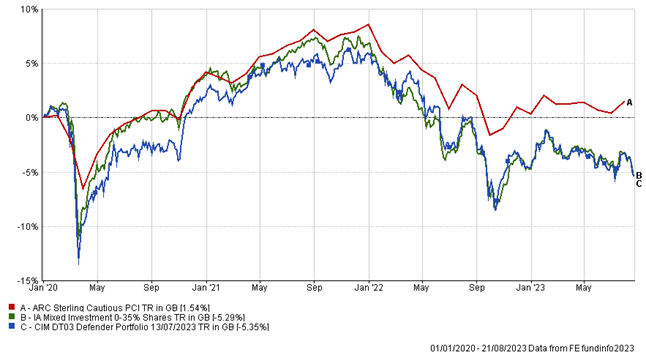
The table below shows the annualised performance to the last quarter end:
| 30/06/22 to 30/06/23 | 30/06/21 to 30/06/22 | 30/06/20 to 30/06/21 | 30/06/19 to 30/06/20 | 30/06/18 to 30/06/19 | |
| CIM DT03 Defender Portfolio | -1.71% | -6.88% | 7.80% | ||
| ARC Sterling Cautious PCI | -0.33% | -5.46% | 7.25% | ||
| IA Mixed Investment 0-35% Shares | -0.85% | -8.57% | 6.86% | ||
The chart below shows the historical performance of the Prudence Portfolio against a relevant benchmark since the start of the available data.
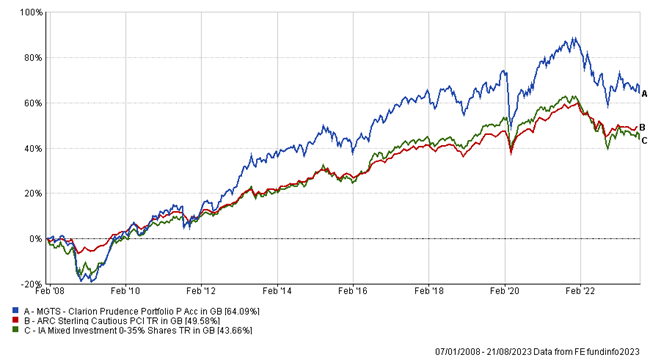
The table below shows the annualised performance to the last quarter end:
| 30/06/22 to 30/06/23 | 30/06/21 to 30/06/22 | 30/06/20 to 30/06/21 | 30/06/19 to 30/06/20 | 30/06/18 to 30/06/19 | |
| MGTS Clarion Prudence P Acc | -0.79% | -8.89% | 12.39% | -1.58% | 0.69% |
| CIM DT04 Prudence Portfolio | -0.14% | -9.06% | 12.26% | -1.27% | 1.43% |
| ARC Sterling Cautious PCI | -0.33% | -5.46% | 7.25% | 1.66% | 2.37% |
| IA Mixed Investment 20-60% Shares | 1.18% | -7.09% | 12.74% | -0.63% | 2.89% |
The chart below shows the historical performance of the Navigator Portfolio against a relevant benchmark since the start of the available data.
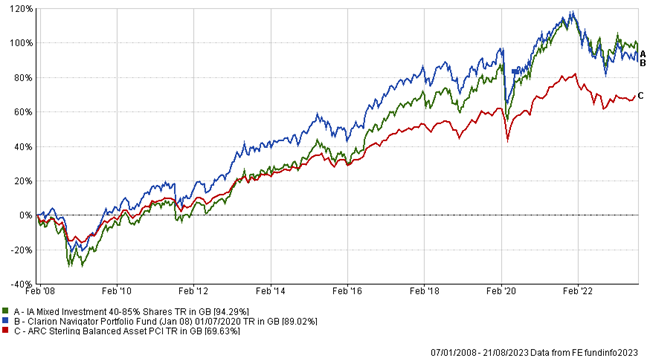
The table below shows the annualised performance to the last quarter end:
| 30/06/22 to 30/06/23 | 30/06/21 to 30/06/22 | 30/06/20 to 30/06/21 | 30/06/19 to 30/06/20 | 30/06/18 to 30/06/19 | |
| MGTS Clarion Navigator P Acc | 0.45% | -9.44% | 15.23% | ||
| CIM DT05 Navigator Portfolio | 0.45% | -9.44% | 15.23% | -2.21% | 1.21% |
| ARC Sterling Balanced Asset PCI | 1.49% | -6.54% | 11.84% | 0.50% | 2.74% |
| IA Mixed Investment 40-85% Shares | 3.25% | -7.16% | 17.29% | -0.11% | 3.62% |
The chart below shows the historical performance of the Meridian Portfolio against a relevant benchmark since the start of the available data.
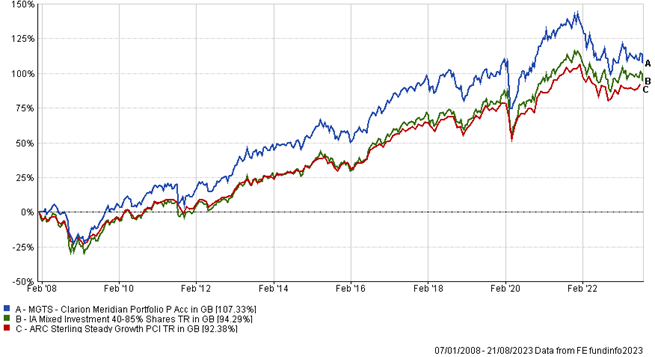
The table below shows the annualised performance to the last quarter end:
| 30/06/22 to 30/06/23 | 30/06/21 to 30/06/22 | 30/06/20 to 30/06/21 | 30/06/19 to 30/06/20 | 30/06/18 to 30/06/19 | |
| MGTS Clarion Meridian P Acc | 1.13% | -11.49% | 19.74% | -0.98% | 0.73% |
| CIM DT06 Meridian Portfolio | 2.98% | -12.00% | 19.73% | -0.51% | 3.26% |
| ARC Steady Growth PCI | 3.01% | -7.54% | 15.87% | -0.51% | 3.54% |
| IA Mixed Investment 40-85% Shares | 3.25% | -7.16% | 17.29% | -0.11% | 3.62% |
The chart below shows the historical performance of the Explorer Portfolio against a relevant benchmark since the start of the available data.
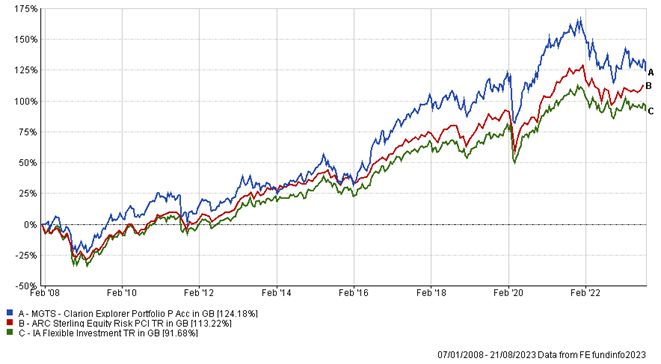
The table below shows the annualised performance to the last quarter end:
| 30/06/22 to 30/06/23 | 30/06/21 to 30/06/22 | 30/06/20 to 30/06/21 | 30/06/19 to 30/06/20 | 30/06/18 to 30/06/19 | |
| MGTS Clarion Explorer P Acc | 1.55% | -11.89% | 22.85% | -1.20% | 5.33% |
| CIM DT07 Explorer Portfolio | 3.36% | -12.73% | 22.46% | -1.09% | 5.69% |
| ARC Equity Risk PCI | 4.43% | -9.09% | 20.57% | -1.13% | 4.02% |
| IA Flexible Investment | 3.29% | -7.09% | 19.48% | 0.31% | 2.95% |
The chart below shows the historical performance of the Voyager Portfolio against a relevant benchmark since the start of the available data.
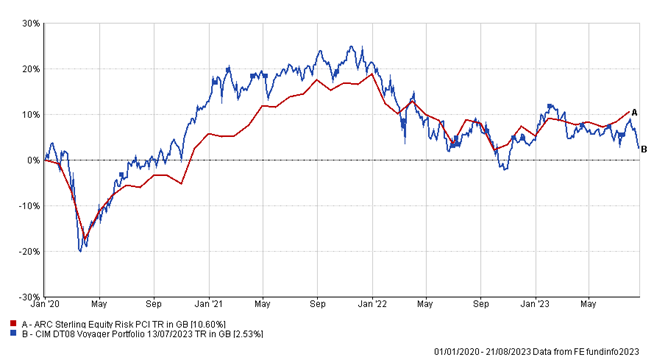
The table below shows the annualised performance to the last quarter end:
| 30/06/22 to 30/06/23 | 30/06/21 to 30/06/22 | 30/06/20 to 30/06/21 | 30/06/19 to 30/06/20 | 30/06/18 to 30/06/19 | |
| CIM DT08 Voyager Portfolio | 2.26% | -14.46% | 24.81% | ||
| ARC Equity Risk PCI | 4.43% | -9.09% | 20.57% |
The chart below shows the historical performance of the Adventurer Portfolio against a relevant benchmark since the start of the available data.
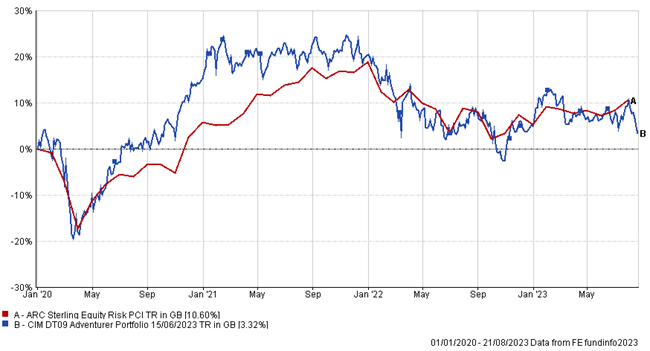
The table below shows the annualised performance to the last quarter end:
| 30/06/22 to 30/06/23 | 30/06/21 to 30/06/22 | 30/06/20 to 30/06/21 | 30/06/19 to 30/06/20 | 30/06/18 to 30/06/19 | |
| CIM DT09 Adventurer Portfolio | 3.14% | -15.60% | 25.54% | ||
| ARC Equity Risk PCI | 4.43% | -9.09% | 20.57% |
The chart below shows the historical performance of the Pioneer Portfolio against a relevant benchmark since the start of the available data.
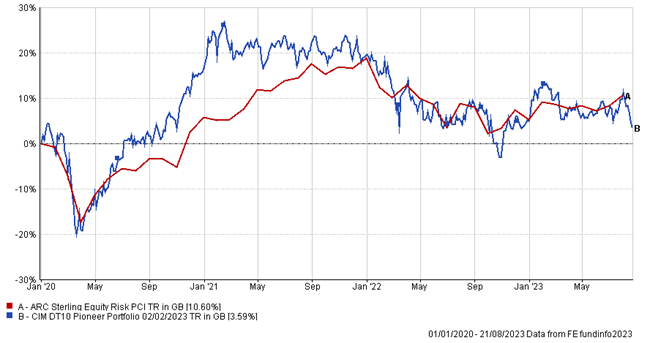
The table below shows the annualised performance to the last quarter end:
| 30/06/22 to 30/06/23 | 30/06/21 to 30/06/22 | 30/06/20 to 30/06/21 | 30/06/19 to 30/06/20 | 30/06/18 to 30/06/19 | |
| CIM DT09 Adventurer Portfolio | 2.34% | -15.18% | 26.74% | ||
| ARC Equity Risk PCI | 4.43% | -9.09% | 20.57% |
Any investment performance figures referred to relate to past performance which is not a reliable indicator of future results and should not be the sole factor of consideration when selecting a product or strategy. The value of investments, and the income arising from them, can go down as well as up and is not guaranteed, which means that you may not get back what you invested. Unless indicated otherwise, performance figures are stated in British Pounds. Where performance figures are stated in other currencies, changes in exchange rates may also cause an investment to fluctuate in value.
The content of this article does not constitute financial advice and you may wish to seek professional advice based on your individual circumstances before making any financial decisions.
If you’d like more information about this article, or any other aspect of our true lifelong financial planning, we’d be happy to hear from you. Please call +44 (0)1625 466 360 or email [email protected].
Click here to sign-up to The Clarion for regular updates.