True lifelong financial planning for the serious business of life.
True lifelong financial planning
for the serious business of life.
True lifelong financial planning for the serious business of life.
True lifelong financial planning
for the serious business of life.
Tags: Adventurer Portfolio, Defender Portfolio, Discretionary Investment Management, Explorer Portfolio, funds, investment, Meridian Portfolio, MGTS Clarion Explorer, MGTS Clarion Meridian, MGTS Clarion Prudence, MTGS Clarion Navigator, Navigator Portfolio, Pioneer Portfolio, Prudence Portfolio, Voyager Portfolio
Category:
Investment management
This article provides a brief overview of the topics discussed in the recent investment committee meeting and the decisions made following those discussions.
The following notes summarise the main points discussed by the Investment Committee.
The Omicron variant continues to dominate market sentiment, resulting in volatile equity and bond markets. South Africa, the worst affected country by Omicron since its discovery, has seen some positive developments in its data. After three waves of Covid-19 in the country, which resulted in rising death statistics from three weeks onwards, this latest wave has now lasted for six weeks with no notable increase in deaths. Even with one of the world’s lowest vaccination totals per capita, the wave caused by Omicron in South Africa is already showing signs of decline.
Hopefully, this bodes well for the UK which, although having a substantially older and more vulnerable population, has been remarkably successful in its vaccination booster rollout, with c.50% of the adult population already jabbed for a third time, the most vulnerable having already been prioritised. An Oxford study confirmed the importance of an MRNA booster jab against the new variant for reducing symptomatic infection.
Early estimates of vaccine effectiveness (VE) against symptomatic infection find a significantly lower VE against Omicron infection compared to Delta infection. Nevertheless, a moderate to high vaccine effectiveness of 70 to 75% is seen in the early period after a booster dose.
The proactiveness of the UK strategy will hopefully avoid another lockdown over the winter period.
The Bank of England again surprised markets, this time choosing to raise interest rates having signalled doing so early in the new year was more plausible. The small rise, from 0.1% to 0.25%, will not have much of an impact but is an important signal that the Bank is prepared to act if inflation does remain stickier than expected. It is also the first of the major central banks to raise rates since the onset of the pandemic, with the Federal Reserve and European Central Bank still sitting on their hands. Sterling jumped on the announcement, as did the FTSE 350’s many financial stocks.
The Federal Reserve did announce a speedier conclusion to its proposed tapering from the previous FOMC meeting, proposing to conclude its asset purchasing programme by March 2022 by further reductions of $30bn each month from January. The “dot plot”, which shows anonymised expectations for interest rates from committee members, shows a likely three interest rate rises for the US in 2022 with the majority of members expecting rates to be above 0.75% by the end of the year.
China intervened in its markets by cutting the required ratio reserve in its banking sector by 50 basis points, freeing up an additional $188bn worth of liquidity. This is an alternative to quantitative easing and cutting interest rates which ought to stimulate bank lending. The Chinese property development sector remains in a state of deep malaise, with bonds defaulting across varying companies. Evergrande, the largest company in the sector at risk of implosion, now has a risk committee overseeing events with the majority of its members represented by political figures in the Guangdong province. This mechanism has been used for other indebted companies to wind them down in a controlled manner, but never with such a large company so integral to the economy. Whether the $300bn debt, along with additional millions across a number of smaller property developers, can be unwound without collateral damage remains to be seen.
In the US, the labour market added far fewer jobs than expected, with the anticipated non-farm payroll increase of 550,000 only realising 210,000 extra workers in December. Workers continued to resign from their jobs at a historically high level, as the phenomenon dubbed “the great resignation” continued. The latest data from October showed 4.2m Americans voluntarily left their positions, with many moving to different positions in search of higher wages. The ratio of vacancies per unemployment is at its highest since records began two decades ago, with 1.5 vacancies per unemployed person.
The US is by no means the only country seeing tight labour market conditions, with the UK also seeing record vacancies according to ONS data for October. This could lead to inflationary pressure extending beyond expected horizons, as more temporary factors such as supply and demand mismatches resolve. US Secretary of Treasury, Janet Yellen, admitted this possibility in a discussion with Martin Wolf at the fourth edition of the Financial Times Global Boardroom. Although downplaying the possibility of a wage-price spiral, Yellen highlighted that some labour chain shortages could take a couple of years to resolve.
Stronger economic growth, lower equity returns, and higher volatility are expected over the next decade. Appropriate diversification within the portfolios is of key importance.
Bond markets are priced for inflation and central bank intervention being temporary factors before reverting to a lower for longer environment. Many investors have increased duration in their fixed income exposure in order to improve yield but, as a result, have overexposed themselves in risk terms. With central banks beginning to raise rates, longer-dated bonds will be particularly affected due to the compounding nature of bond pricing over time. The possibility of capital loss is acute, and the Clarion Investment Committee continue to allocate to short-dated and tactical bonds accordingly, as these should outperform on a relative basis in a rising rate environment.
US equities, particularly at the top of the major indices, are priced to continue rampant growth years into the future. It is possible that major companies such as Microsoft could achieve this, but it is equally plausible that much of the demand seen in the pandemic will have been pulled forward and that earnings targets could be missed as a result. The risk of market correction is greater than continued outperformance. The Investment Committee continue to allocate an underweight position to the US across the Portfolio Funds and model portfolios as a result.
The UK is primed for a long overdue reversal in fortunes, with the recent interest rate rise likely to aid the many laggard financial stocks in the major index. The booster rollout programme could also see the UK emerge faster from the spread of Omicron in comparison to other countries, especially if a lockdown can be avoided, or if required, is exceptionally short in duration. Many of the services and leisure companies would recover strongly in this instance and could see UK equities outperform as sentiment rotates back into value and cyclical stocks. The opportunity is one that the Investment Committee are keen on, and the UK is held as an overweight equity position across the Portfolio Funds and model portfolios.
For a fuller version of Clarion’s Economic and Stock Market Commentary, written by Clarion Group Chairman Keith Thompson, please click here
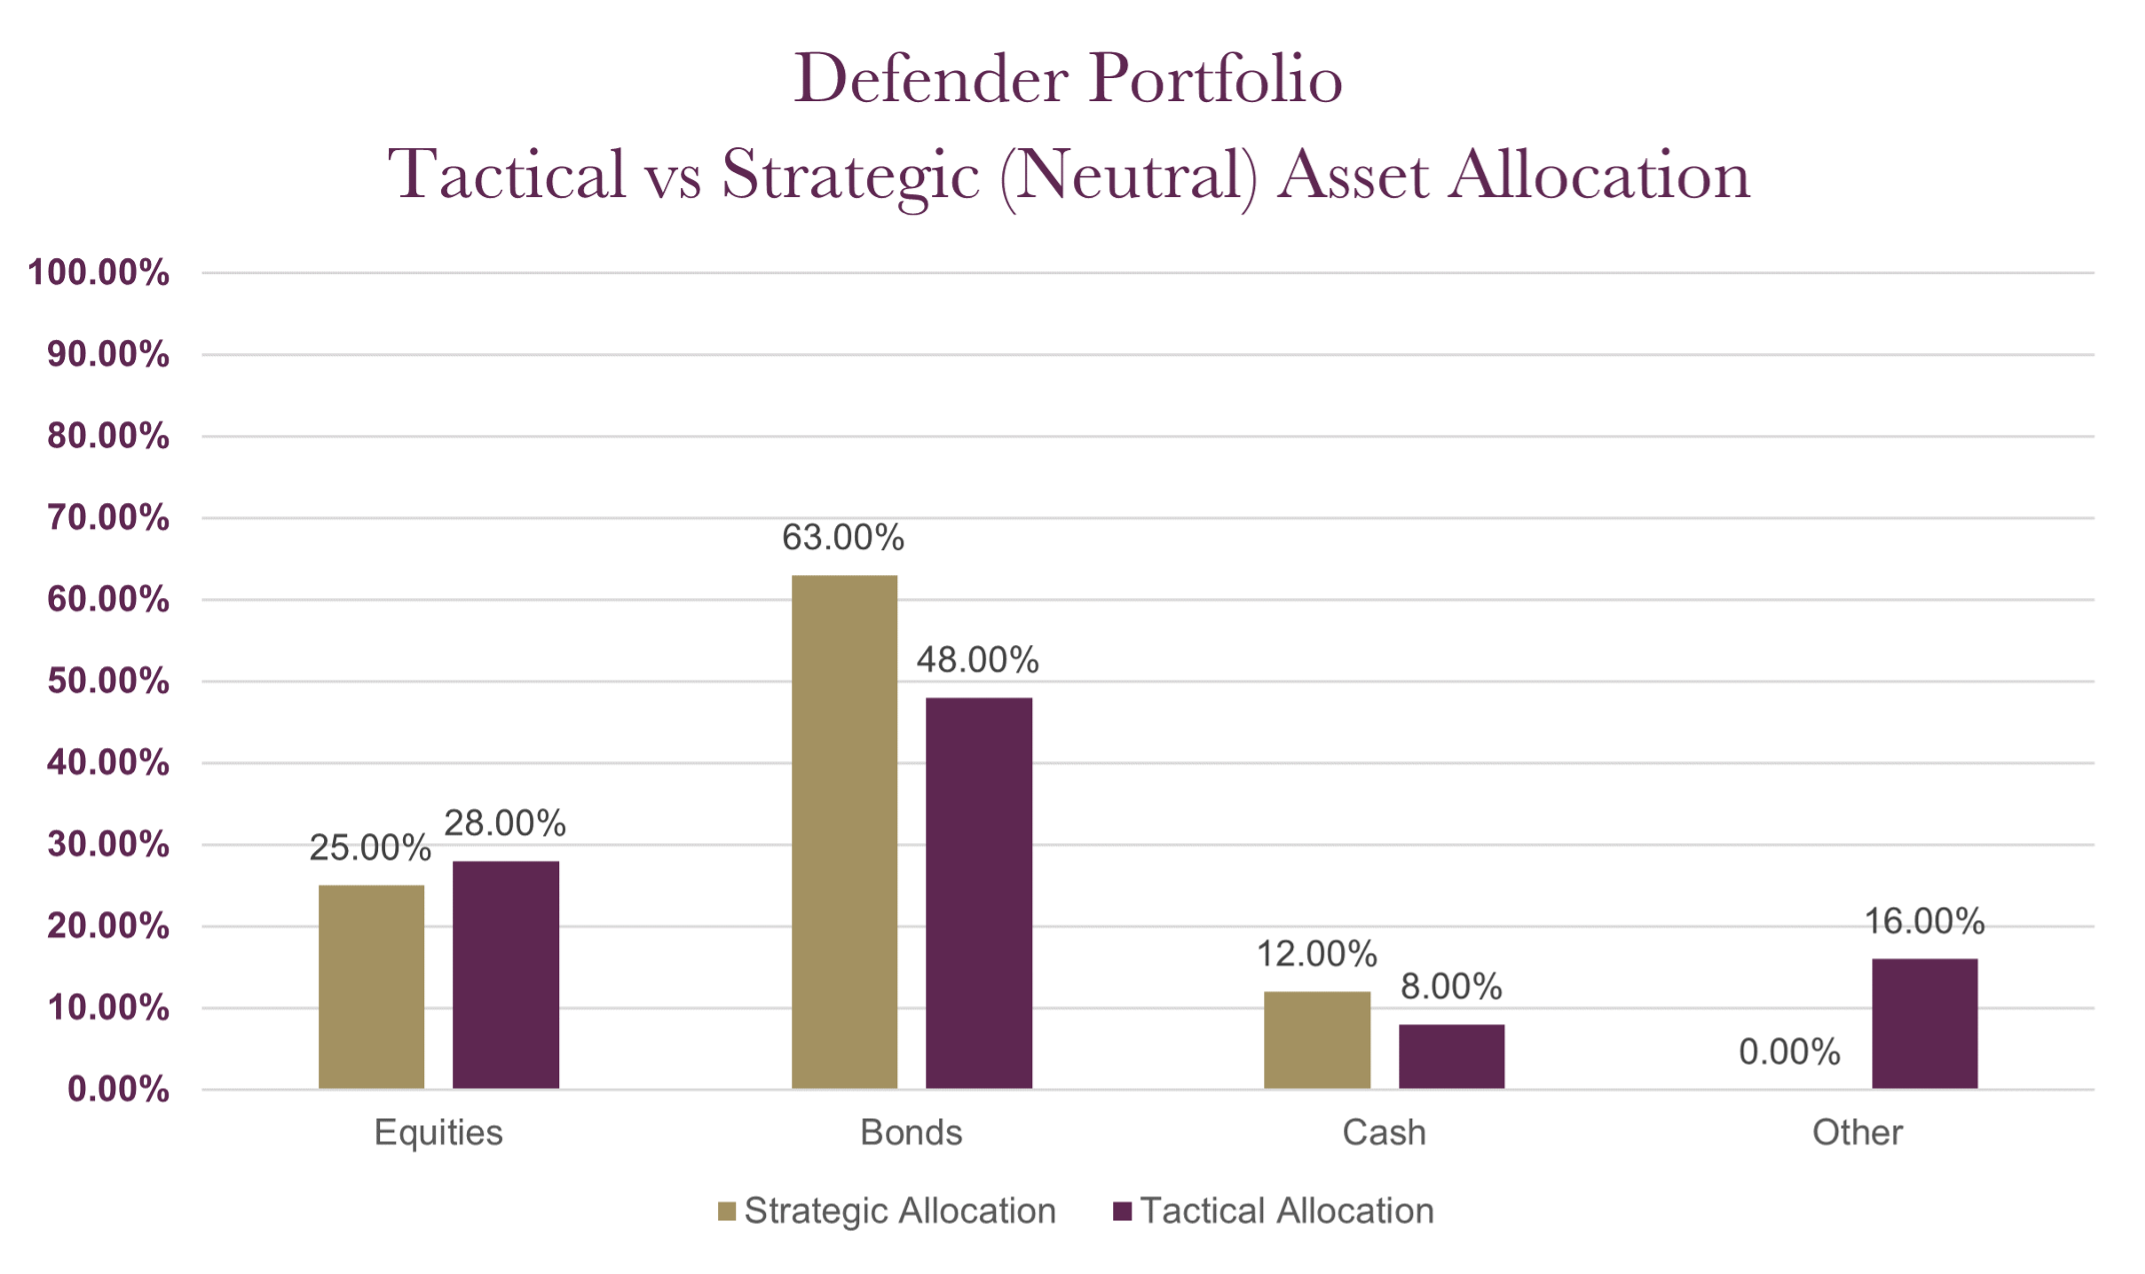
The charts below show the tactical asset allocation of the Defender Portfolio against the neutral/strategic asset allocation as well as the historical performance of the portfolio against a relevant benchmark since the start of the available data.
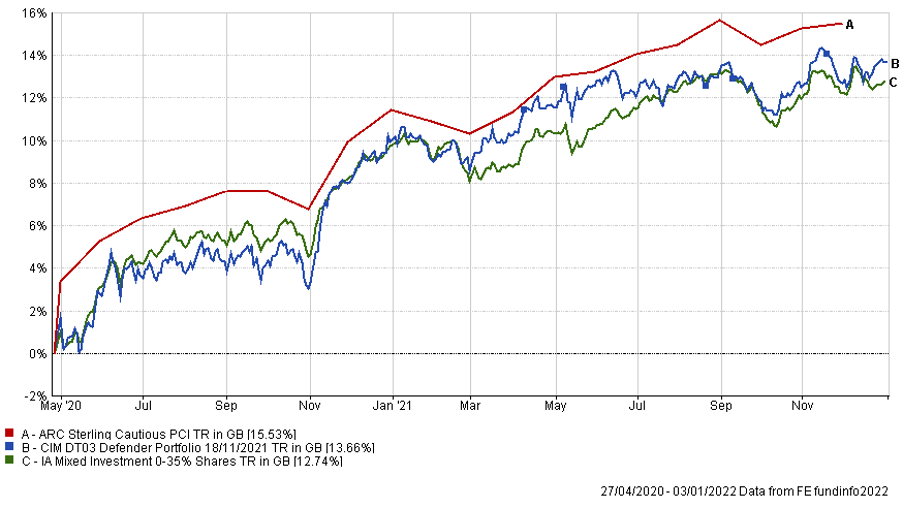
The table below shows the annualised performance to the last quarter end:
| 30/09/20 to 30/09/21 | |
| CIM DT03 Defender Portfolio | 5.69% |
| ARC Sterling Cautious PCI | 7.42% |
| IA Mixed Investment 0-35% Shares | 6.02% |
Changes to the Defender model
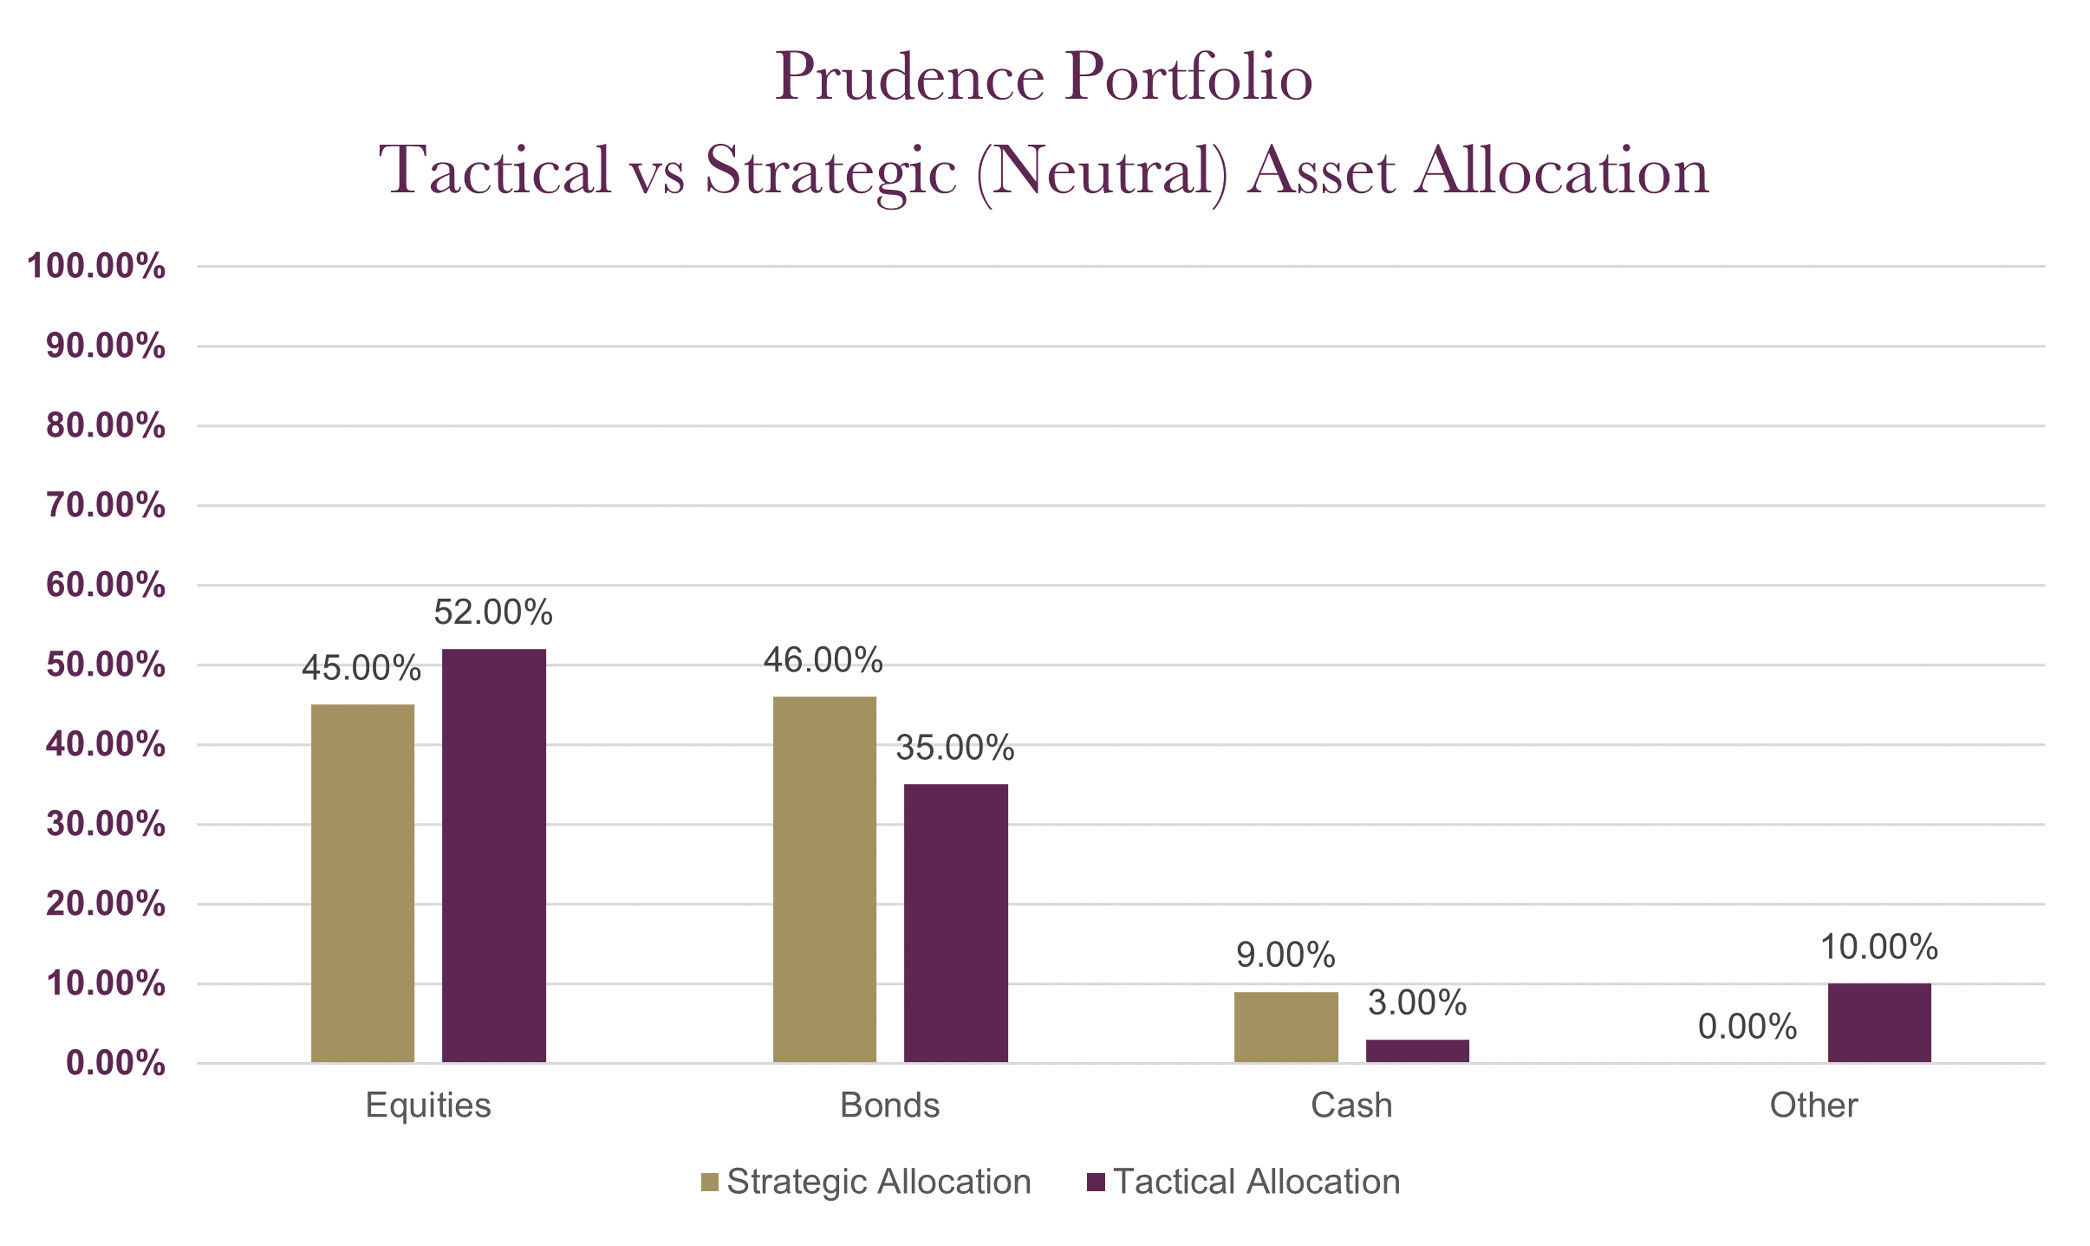
The charts below show the tactical asset allocation of the Prudence Portfolio against the neutral/strategic asset allocation as well as the historical performance of the portfolio against a relevant benchmark(s) since the start of the available data.
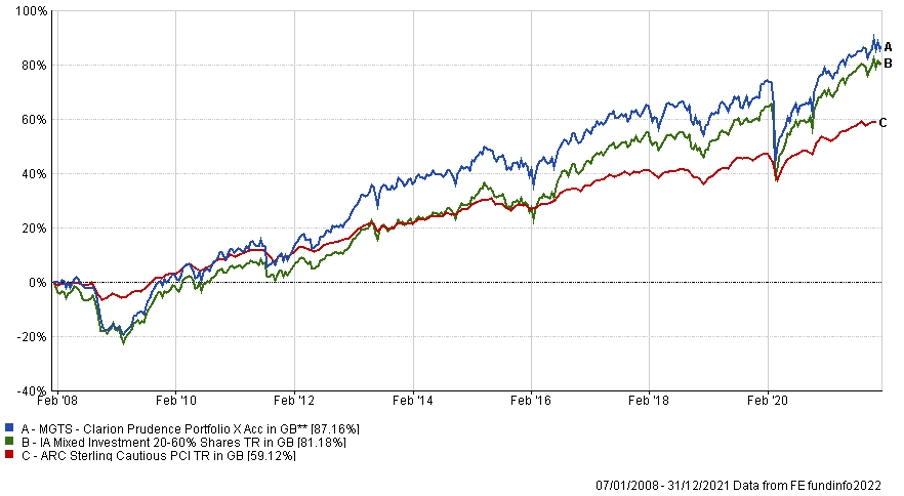
The table below shows the annualised performance to the last quarter end:
| 30/09/20 to 30/09/21 | 30/09/19 to 30/09/20 | 30/09/18 to 30/09/19 | 30/09/17 to 30/09/18 | 30/09/16 to 30/09/17 | |
| MGTS Clarion Prudence X Acc | 11.63% | -2.00% | 1.83% | 2.90% | 4.77% |
| CIM DT04 Prudence Portfolio | 11.66% | -1.23% | 2.54% | 2.93% | |
| ARC Sterling Cautious PCI | 5.69% | 1.52% | 3.40% | 1.29% | 3.86% |
| IA Mixed Investment 20-60% Shares | 12.21% | -1.19% | 4.01% | 2.60% | 6.15% |
Changes to the Prudence fund & model
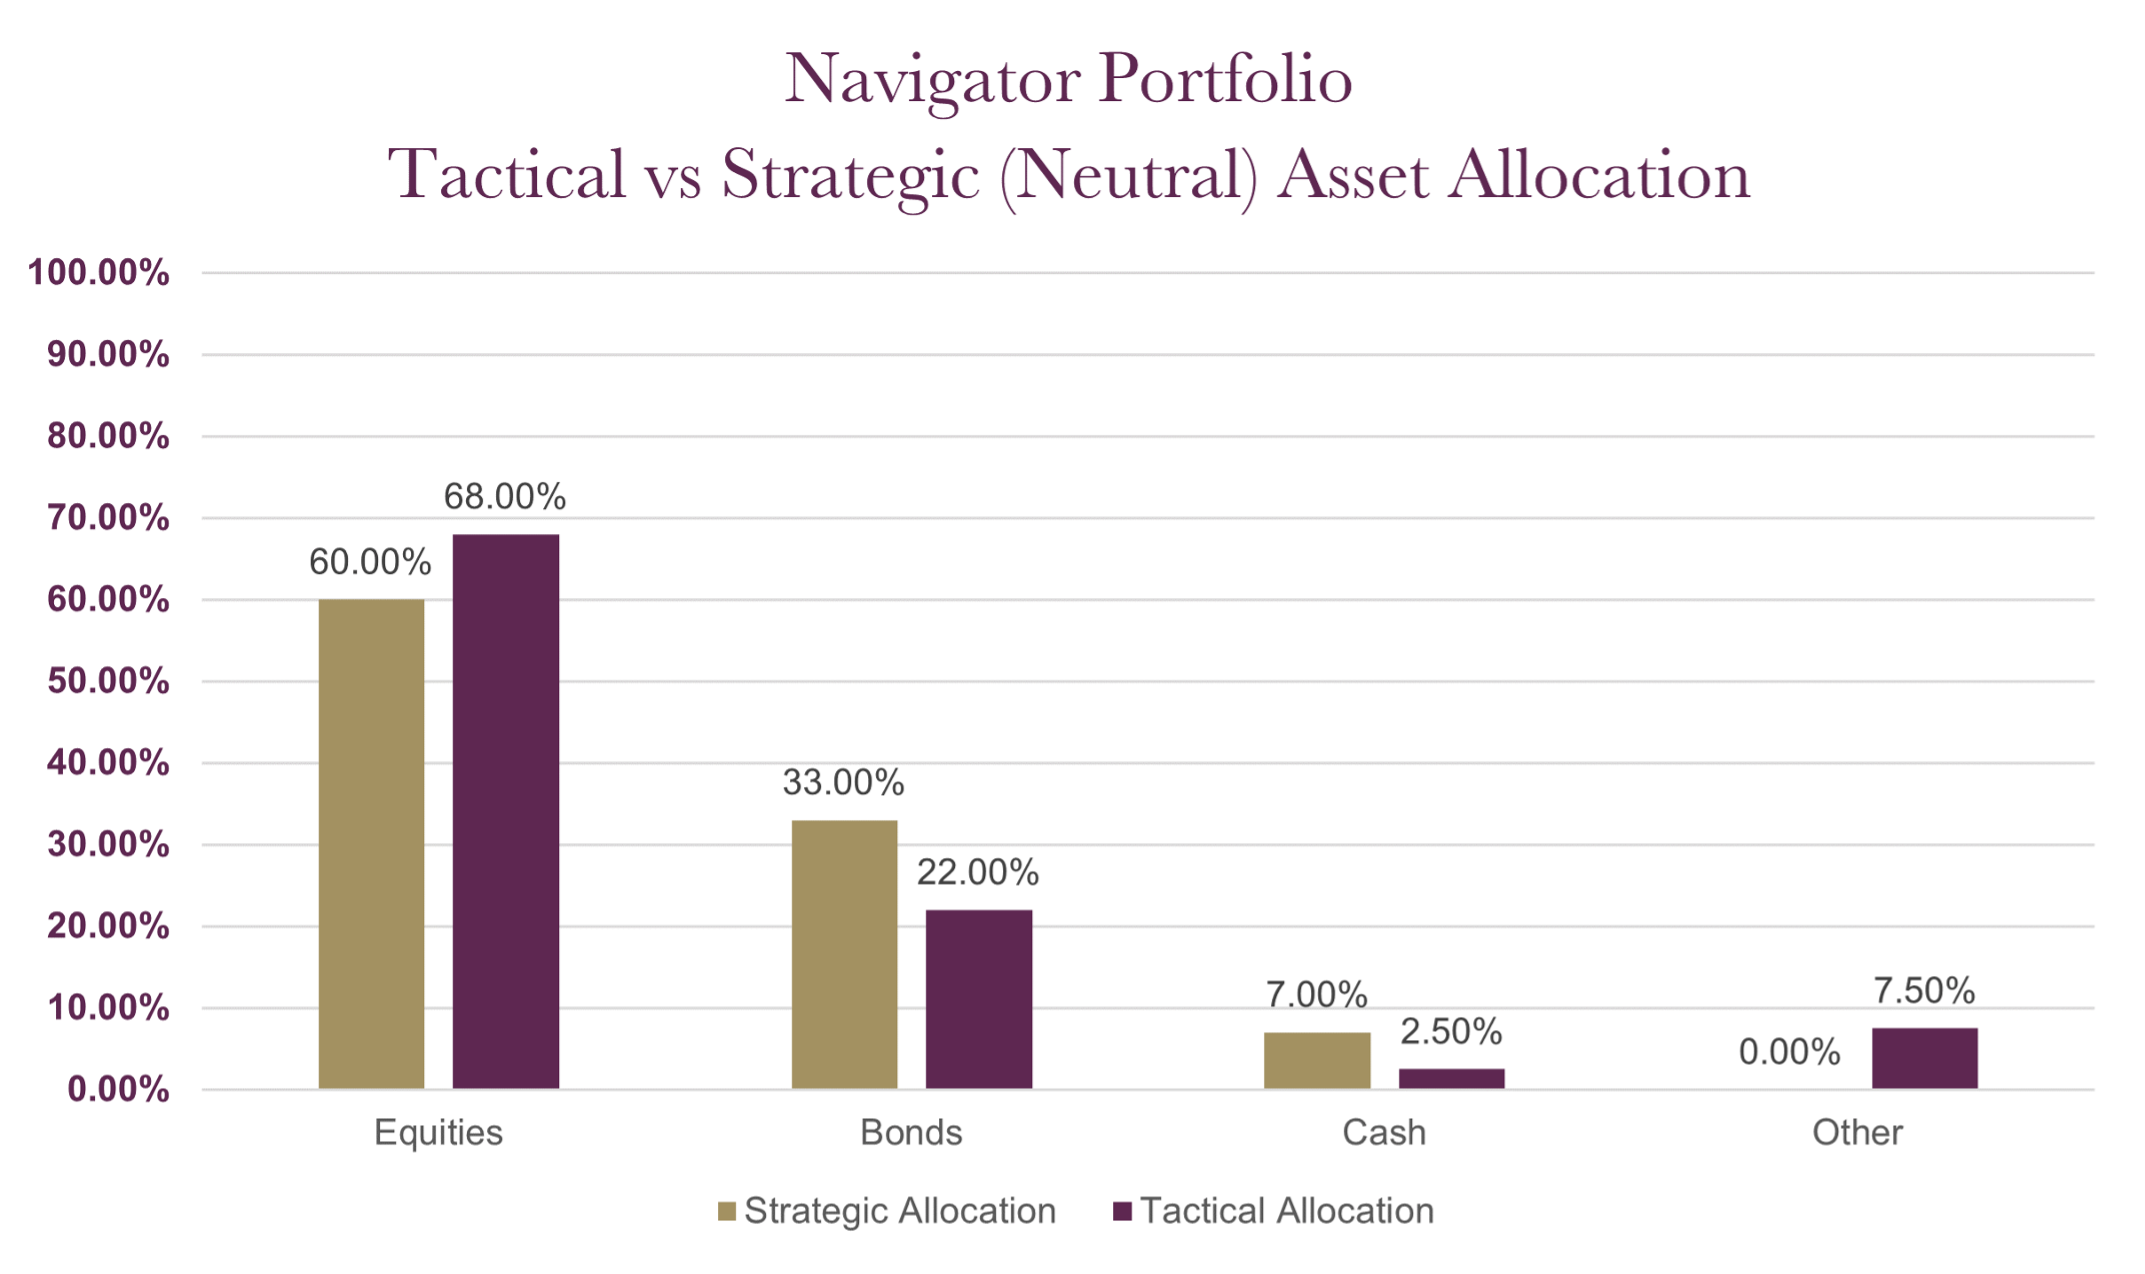
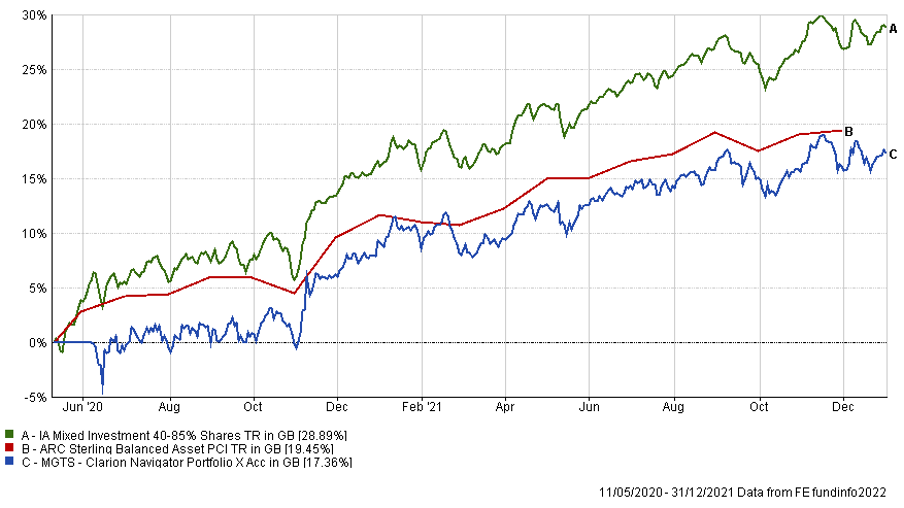
The charts below show the tactical asset allocation of the Navigator Portfolio against the neutral/strategic asset allocation as well as the historical performance of the portfolio against a relevant benchmark(s) since the start of the available data.
The table below shows the annualised performance to the last quarter end:
| 30/09/20 to 30/09/21 | |
| MGTS Clarion Navigator X Acc | 14.17% |
| CIM DT05 Navigator Portfolio | 14.32% |
| IA Mixed Investment 40-85% Shares | 16.63% |
Changes to the Navigator fund & model
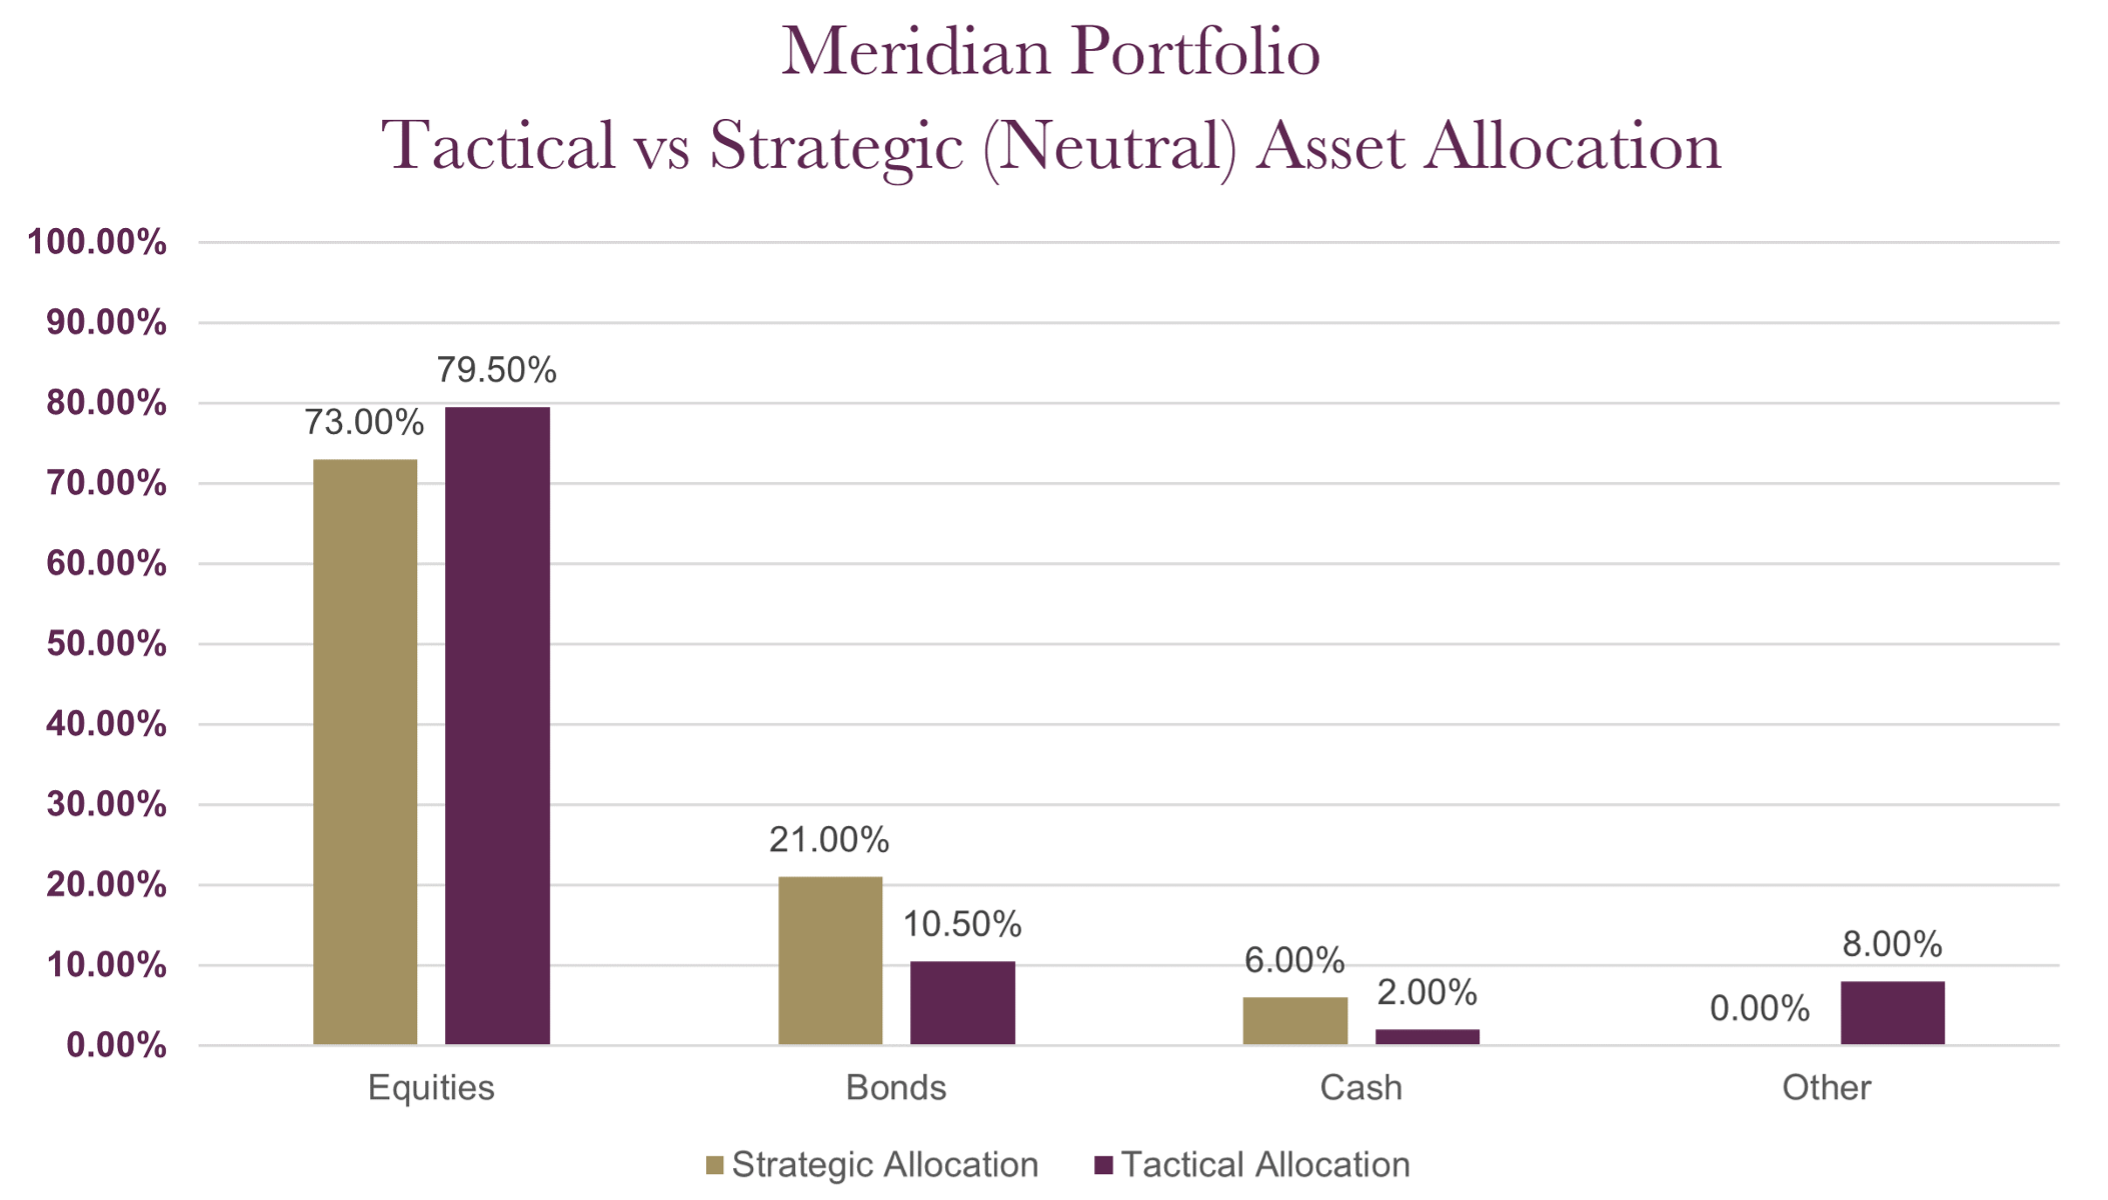
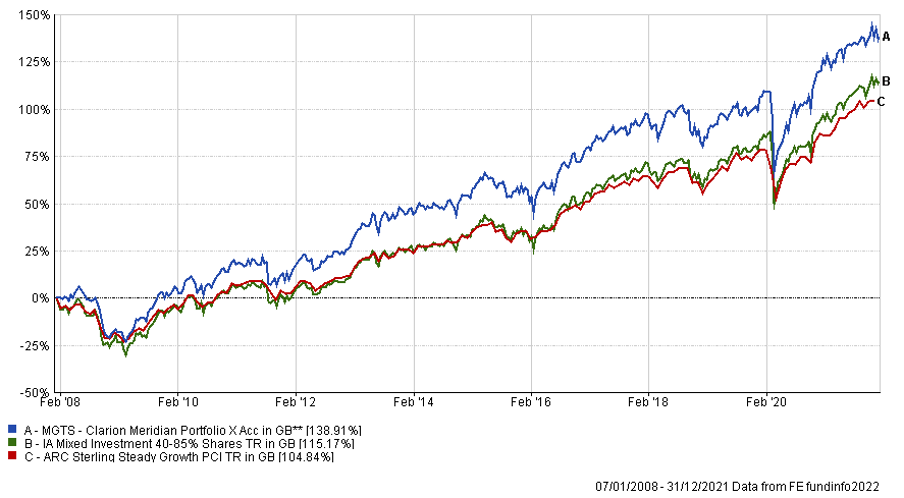
The charts below show the tactical asset allocation of the Meridian Portfolio against the neutral/strategic asset allocation as well as the historical performance of the portfolio against a relevant benchmark(s) since the start of the available data.
The table below shows the annualised performance to the last quarter end:
| 30/09/20 to 30/09/21 | 30/09/19 to 30/09/20 | 30/09/18 to 30/09/19 | 30/09/17 to 30/09/18 | 30/09/16 to 30/09/17 | |
| MGTS Clarion Meridian X Acc | 16.76% | 0.00% | 0.99% | 6.39% | 8.49% |
| CIM DT06 Meridian Portfolio | 17.08% | 0.93% | 3.36% | 5.31% | |
| ARC Steady Growth PCI | 14.43% | -0.16% | 3.82% | 5.15% | 8.67% |
| IA Mixed Investment 40-85% Shares | 16.63% | -0.19% | 4.20% | 5.35% | 9.09% |
Changes to the Meridian fund & model
The charts below show the tactical asset allocation of the Explorer Portfolio against the neutral/strategic asset allocation as well as the historical performance of the portfolio against a relevant benchmark(s) since the start of the available data.
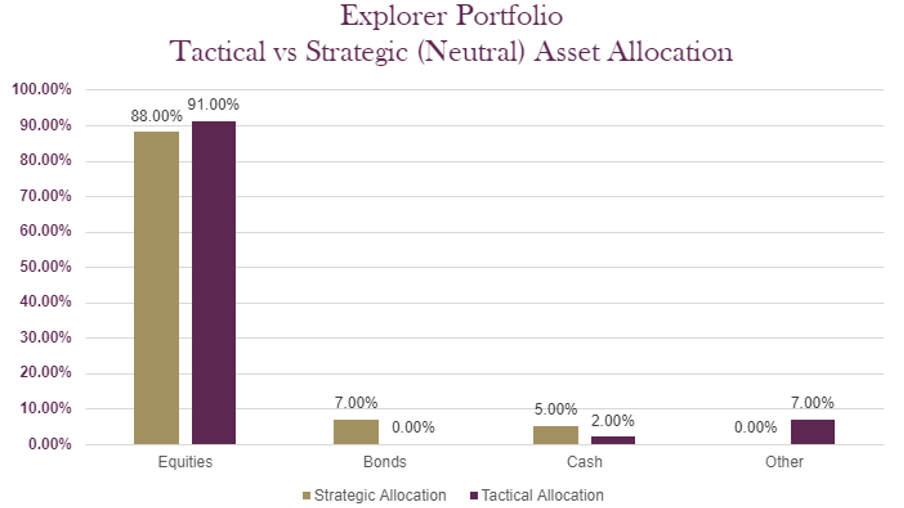
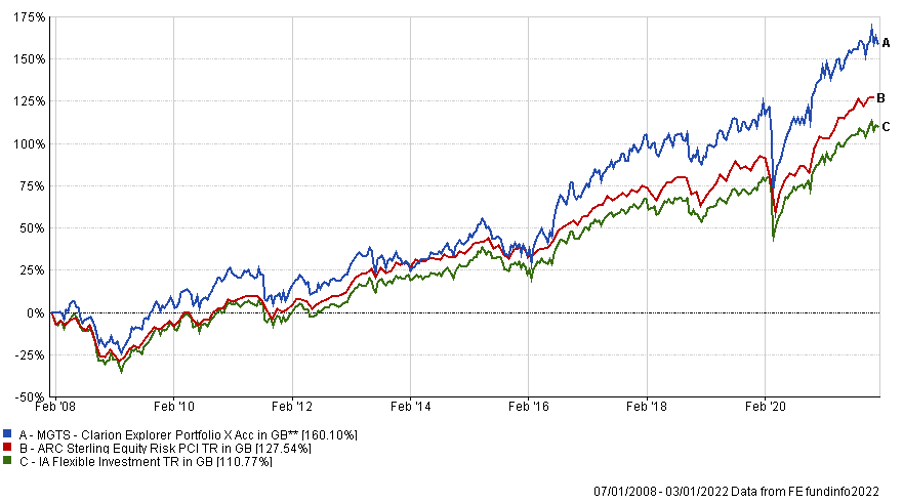
The table below shows the annualised performance to the last quarter end:
| 30/09/20 to 30/09/21 | 30/09/19 to 30/09/20 | 30/09/18 to 30/09/19 | 30/09/17 to 30/09/18 | 30/09/16 to 30/09/17 | |
| MGTS Clarion Explorer X Acc | 18.75% | 0.86% | 4.48% | 8.58% | 10.86% |
| CIM DT07 Explorer Portfolio | 19.03% | 1.21% | 3.97% | 9.27% | |
| ARC Equity Risk PCI | 19.10% | -0.25% | 3.84% | 6.53% | 10.69% |
| IA Flexible Investment | 18.30% | 0.88% | 3.24% | 5.37% | 10.53% |
Changes to the Explorer fund & model
The charts below show the tactical asset allocation of the Voyager Portfolio against the neutral/strategic asset allocation as well as the historical performance of the portfolio against a relevant benchmark(s) since the start of the available data.
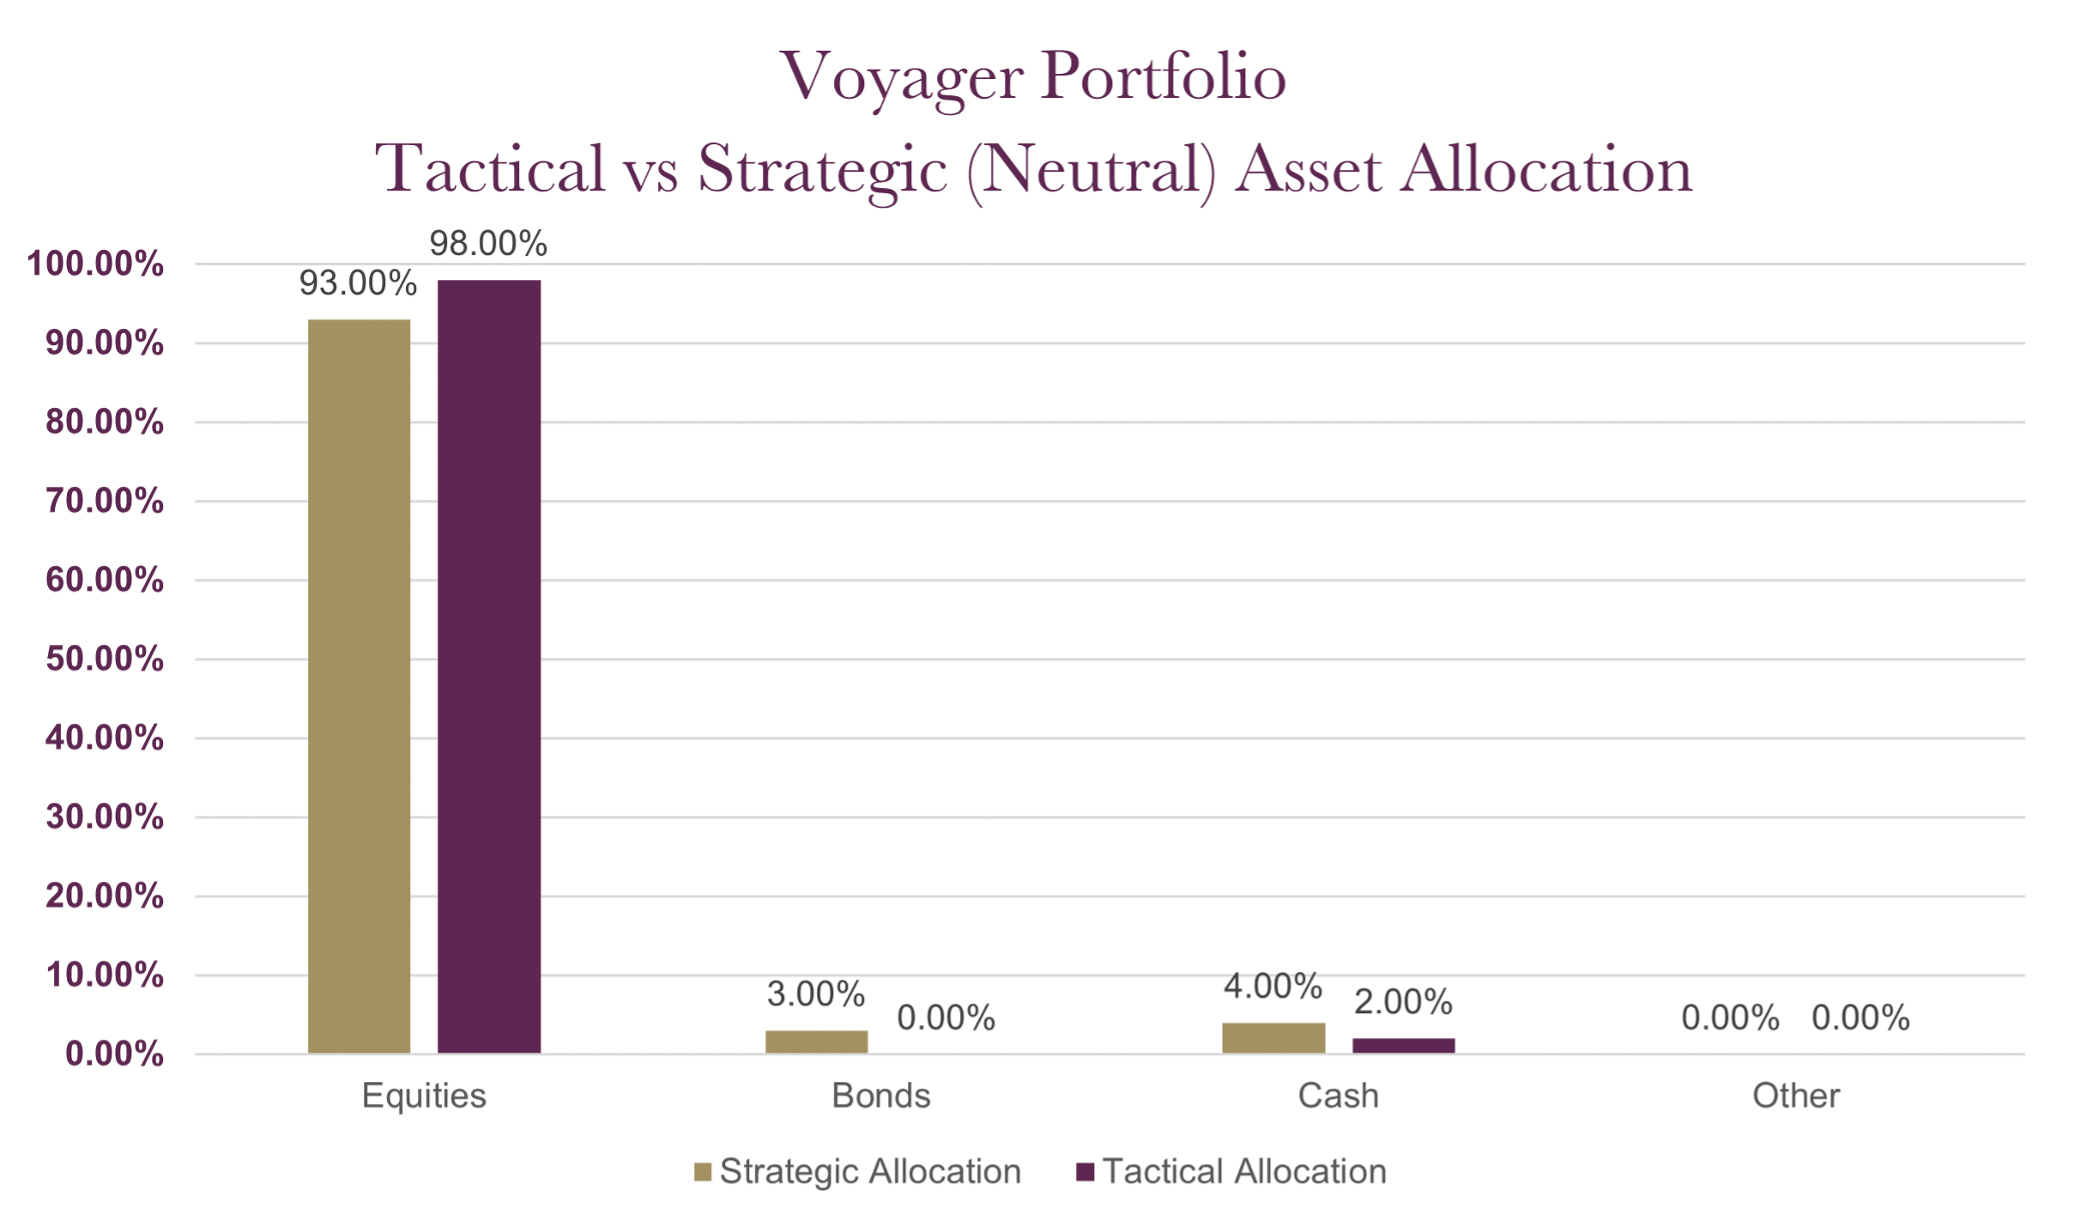
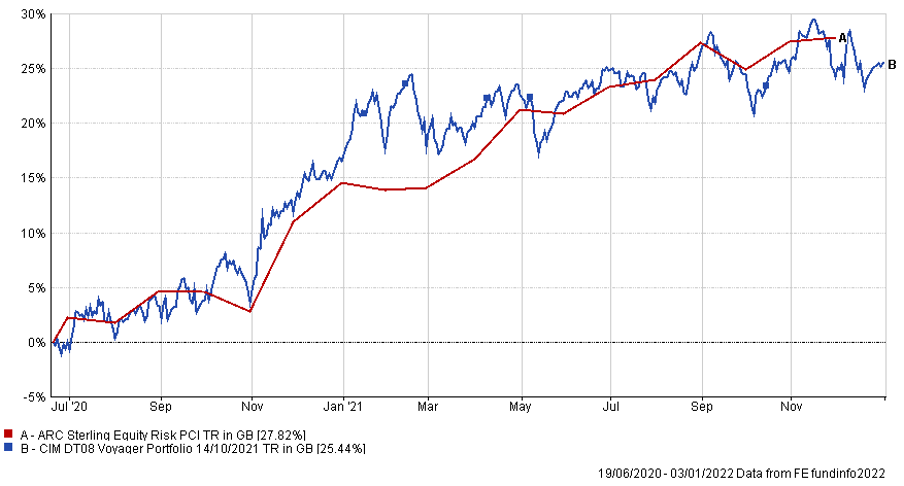
The table below shows the annualised performance to the last quarter end:
| 30/09/20 to 30/09/21 | 30/09/19 to 30/09/20 | 30/09/18 to 30/09/19 | 30/09/17 to 30/09/18 | 30/09/16 to 30/09/17 | |
| CIM DT08 Voyager Portfolio | 19.86% | ||||
| ARC Equity Risk PCI | 19.10% | -0.25% | 3.84% | 6.53% | 10.69% |
Changes to the Voyager fund & model
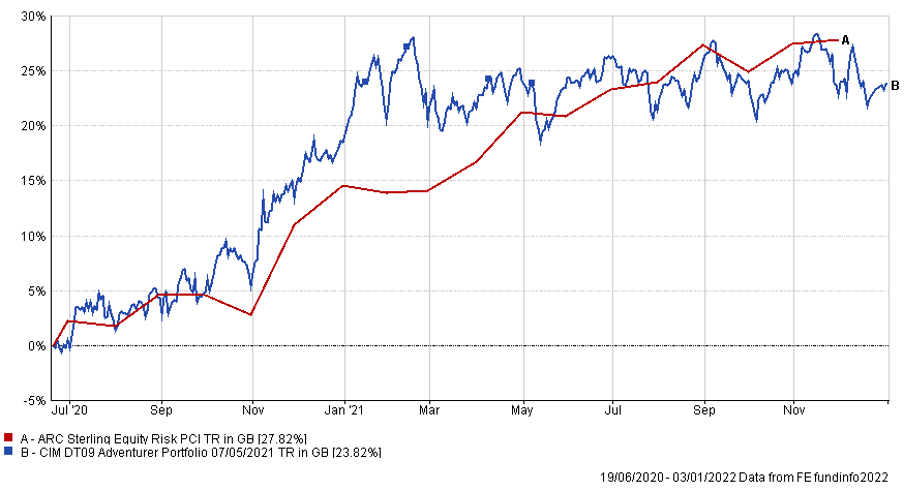
The charts below show the tactical asset allocation of the Adventurer Portfolio against the neutral/strategic asset allocation as well as the historical performance of the portfolio against a relevant benchmark(s) since the start of the available data.
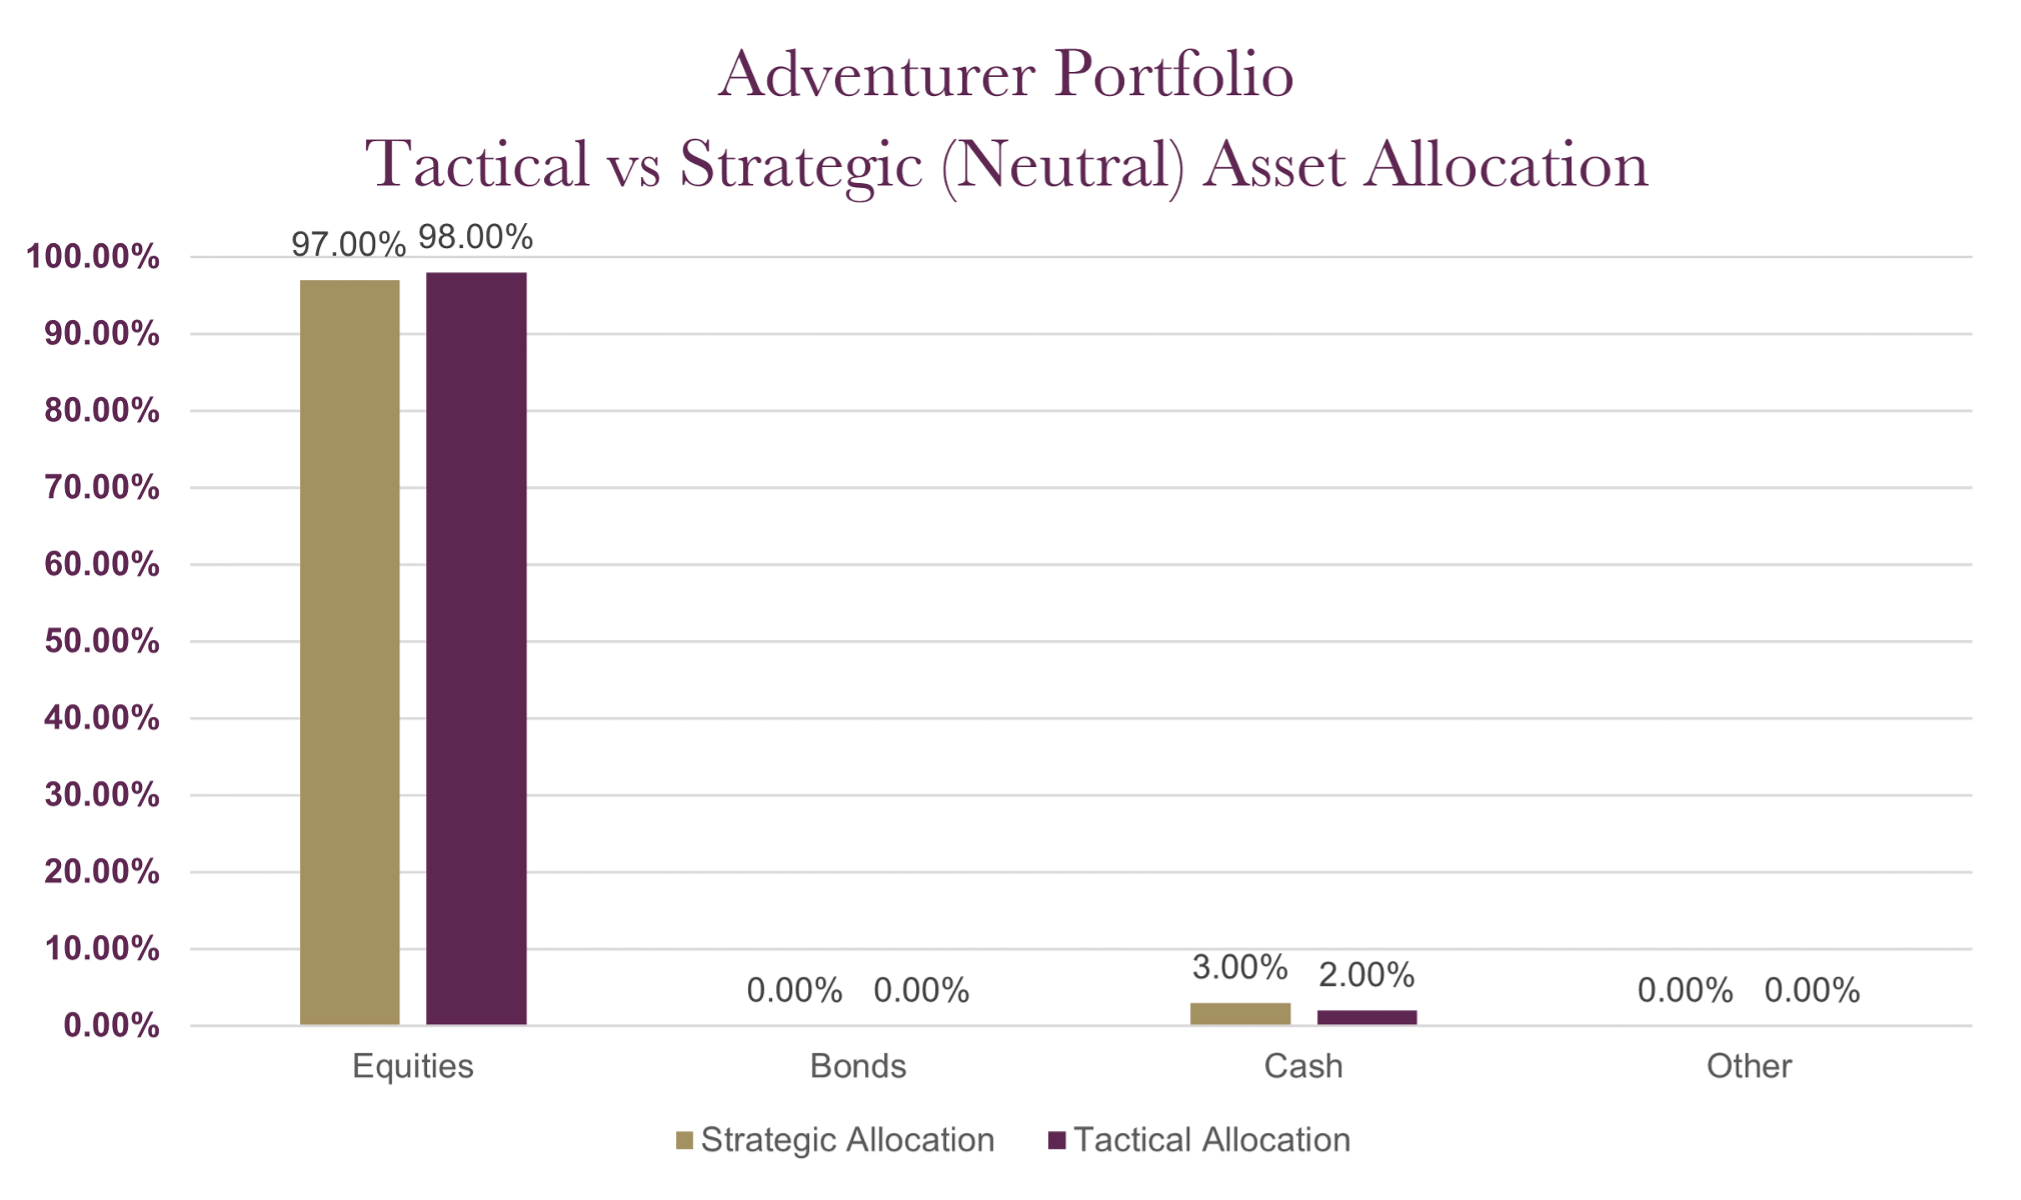
The table below shows the annualised performance to the last quarter end:
| 30/09/20 to 30/09/21 | 30/09/19 to 30/09/20 | 30/09/18 to 30/09/19 | 30/09/17 to 30/09/18 | 30/09/16 to 30/09/17 | |
| CIM DT09 Adventurer Portfolio | 18.33% | ||||
| ARC Equity Risk PCI | 19.10% | -0.25% | 3.84% | 6.53% | 10.69% |
Changes to the Adventurer model
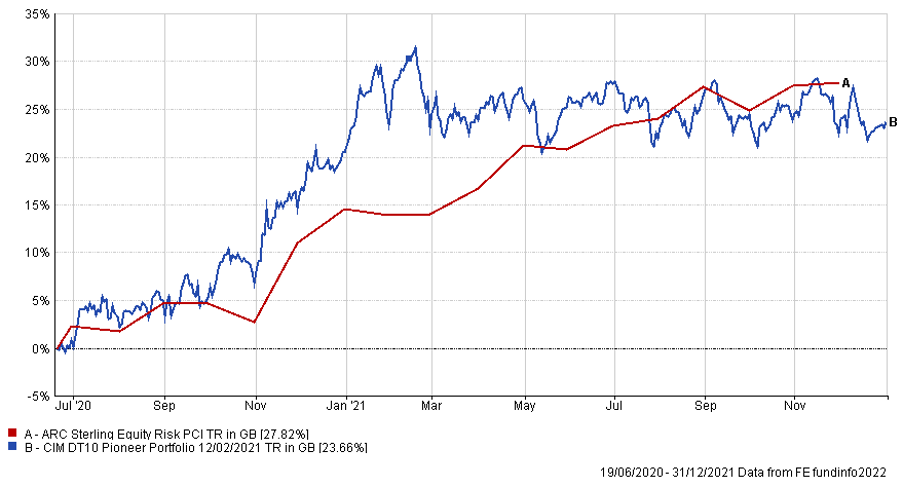
The charts below show the tactical asset allocation of the Pioneer Portfolio against the neutral/strategic asset allocation as well as the historical performance of the portfolio against a relevant benchmark(s) since the start of the available data.
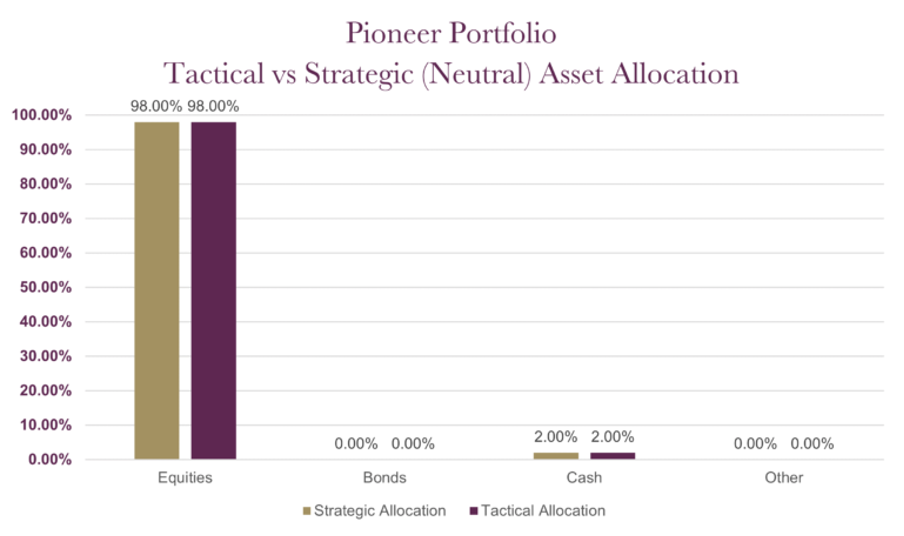
The table below shows the annualised performance to the last quarter end:
| 30/09/20 to 30/09/21 | 30/09/19 to 30/09/20 | 30/09/18 to 30/09/19 | 30/09/17 to 30/09/18 | 30/09/16 to 30/09/17 | |
| CIM DT10 Pioneer Portfolio | 18.18% | ||||
| ARC Equity Risk PCI | 19.10% | -0.25% | 3.84% | 6.53% | 10.69% |
Changes to the Pioneer model
Any investment performance figures referred to relate to past performance which is not a reliable indicator of future results and should not be the sole factor of consideration when selecting a product or strategy. The value of investments, and the income arising from them, can go down as well as up and is not guaranteed, which means that you may not get back what you invested. Unless indicated otherwise, performance figures are stated in British Pounds. Where performance figures are stated in other currencies, changes in exchange rates may also cause an investment to fluctuate in value.
If you’d like more information about this article, or any other aspect of our true lifelong financial planning, we’d be happy to hear from you. Please call +44 (0)1625 466 360 or email [email protected].
Click here to sign-up to The Clarion for regular updates.