True lifelong financial planning for the serious business of life.
True lifelong financial planning
for the serious business of life.
True lifelong financial planning for the serious business of life.
True lifelong financial planning
for the serious business of life.
Tags: Adventurer Portfolio, Defender Portfolio, Discretionary Investment Management, Explorer Portfolio, funds, investment, Meridian Portfolio, MGTS Clarion Explorer, MGTS Clarion Meridian, MGTS Clarion Prudence, MTGS Clarion Navigator, Navigator Portfolio, Pioneer Portfolio, Prudence Portfolio, Voyager Portfolio
Category:
Investment management
This article provides a brief overview of the topics discussed in the recent investment committee meeting and the decisions made following those discussions. Please note our meeting took place prior to the events in Ukraine last week and the commentary reflects that.
The following notes summarise the main points discussed by the Investment Committee.
The Federal Reserve governors decided to hold off on interest rate rises until the next meeting in March, but it was telegraphed clearly that rates would rise:
“In light of the remarkable progress we have seen in the labour market and inflation that is well above our 2 percent longer-run goal, the economy no longer needs sustained high levels of monetary policy support. I would say that the Committee is of a mind to raise the federal funds rate at the March meeting, assuming that conditions are appropriate for doing so.”
Asset purchases are also due to end in early March, which will mean the Federal Reserve balance sheet will remain at current levels, with the proceeds from maturing treasuries being reinvested. Once interest rates have risen, the initial method of reducing the balance sheet will be to allow runoff and let bonds mature without reinvesting the proceeds. This would, in effect, pull $1.4tn from the treasury market by the end of 2023 at current estimates.
Oxford Economics calculates that, when the Fed stops these purchases and lets existing assets mature, this will result in an “effective reduction in Fed purchases of $90bn bonds each month — or $400bn [reduction] in the second half of this year and $1tn in 2023”. But that would still not trim the balance sheet to anything like its pre-pandemic level.
Once this process begins, one of the biggest single owners of treasuries in issuance (totalling just under 21% at the last published data in September) will step out of the market, resulting in a potential catastrophe for holders of long-dated bonds.
The current position of bonds against inflation is now well outside normal levels. Bond markets are either pricing in that inflation will drop or that yields will jump as inflation proves to be stickier than predicted and central bank support is withdrawn.
The last few weeks have seen a volatile period of rotation out of growth into value in US equities. Growth stocks have outperformed over the last decade, in part due to accommodative financial conditions which have seen reduced discount factors disproportionally affecting present value of long-term growth projections. With the financial conditions now shifting, investors are reassessing whether growth stocks can live up to the expectations put upon them.
In the UK, Plan B restrictions put in place before Christmas were lifted, with work from home guidance and mask-wearing requirements removed. The UK has followed the expected pattern set by South Africa’s earlier data, with a sharp falloff in cases. Hospitalisations and deaths have also remained low in comparison to earlier waves, with rolling seven-day averages for both on the decrease and the NHS not having been overwhelmed. The prospect of Covid-19 being downgraded to an endemic status in the UK appears plausible, which could see the UK running a more open economy than other developed nations, resulting in a faster economic recovery.
Tensions between Russia and the West remain high, with c.160,000 Russian troops now estimated to be stationed on the border of Ukraine. The US announced 8,500 troops were on standby for deployment if required by the NATO alliance. UK intelligence highlighted the concern of a rapid strike on the capital Kyiv, and both UK and US diplomats have begun pulling out embassy staff. The potential impact of any escalation is hard to gauge. Europe’s dependence on Russian oil and gas exports has been laid bare in the energy crisis of last year, and the possibility of supplies becoming even tighter as a result of the current circumstances cannot be ruled out.
Bonds markets are seeing increasing signs of pressure. Spreads have begun to widen as central banks, led by the Federal Reserve and the Bank of England, are predicted to raise rates and have already begun to taper asset purchases. The expectation is that yield curves will normalise as the central banks step back from supporting the markets, with the short end flattening and the longer end steepening, which should see longer duration bonds sell off and short duration bonds outperform. The Investment Committee maintain a bias to short-dated and tactical bonds with this expectation in mind.
Recent US equity performance has shown the risks of index investing and momentum trading, and the dangers of region bias in asset allocation. US large-cap equities, above all others, have benefitted from loose financial conditions and are likely to be the major casualty as these conditions are reversed. The underweight position across the portfolio fund range and model portfolio is based on the Investment Committee’s conviction that US equities ought to underperform relative to other equity markets.
The UK, despite its recent outperformance against other equity markets, remains underweight across many active portfolios, with the recent Bank of America Fund Manager survey data for February showing that the UK is still the least favoured developed equity market, despite increasing average allocations. The FTSE indices are heavily value tilted and should benefit from changing market conditions. The Investment Committee maintain an overweight position to UK equities across the portfolio fund range and model portfolios on this basis.
Asia Pacific equities are also trading at reasonable valuations, and monetary policy in the region is more accommodative, with the People’s Bank of China moving in the opposite direction to western central banks in applying fiscal stimulus, and the Bank of Japan continuing in its yield curve control. Following the selloffs in the region last year as a result of Chinese state intervention in the technology sector, there are attractive opportunities. The Investment Committee maintain an overweight position to Asia Pacific equities accordingly.
For a fuller version of Clarion’s Economic and Stock Market Commentary, written by Clarion Group Chairman Keith Thompson, please click here.
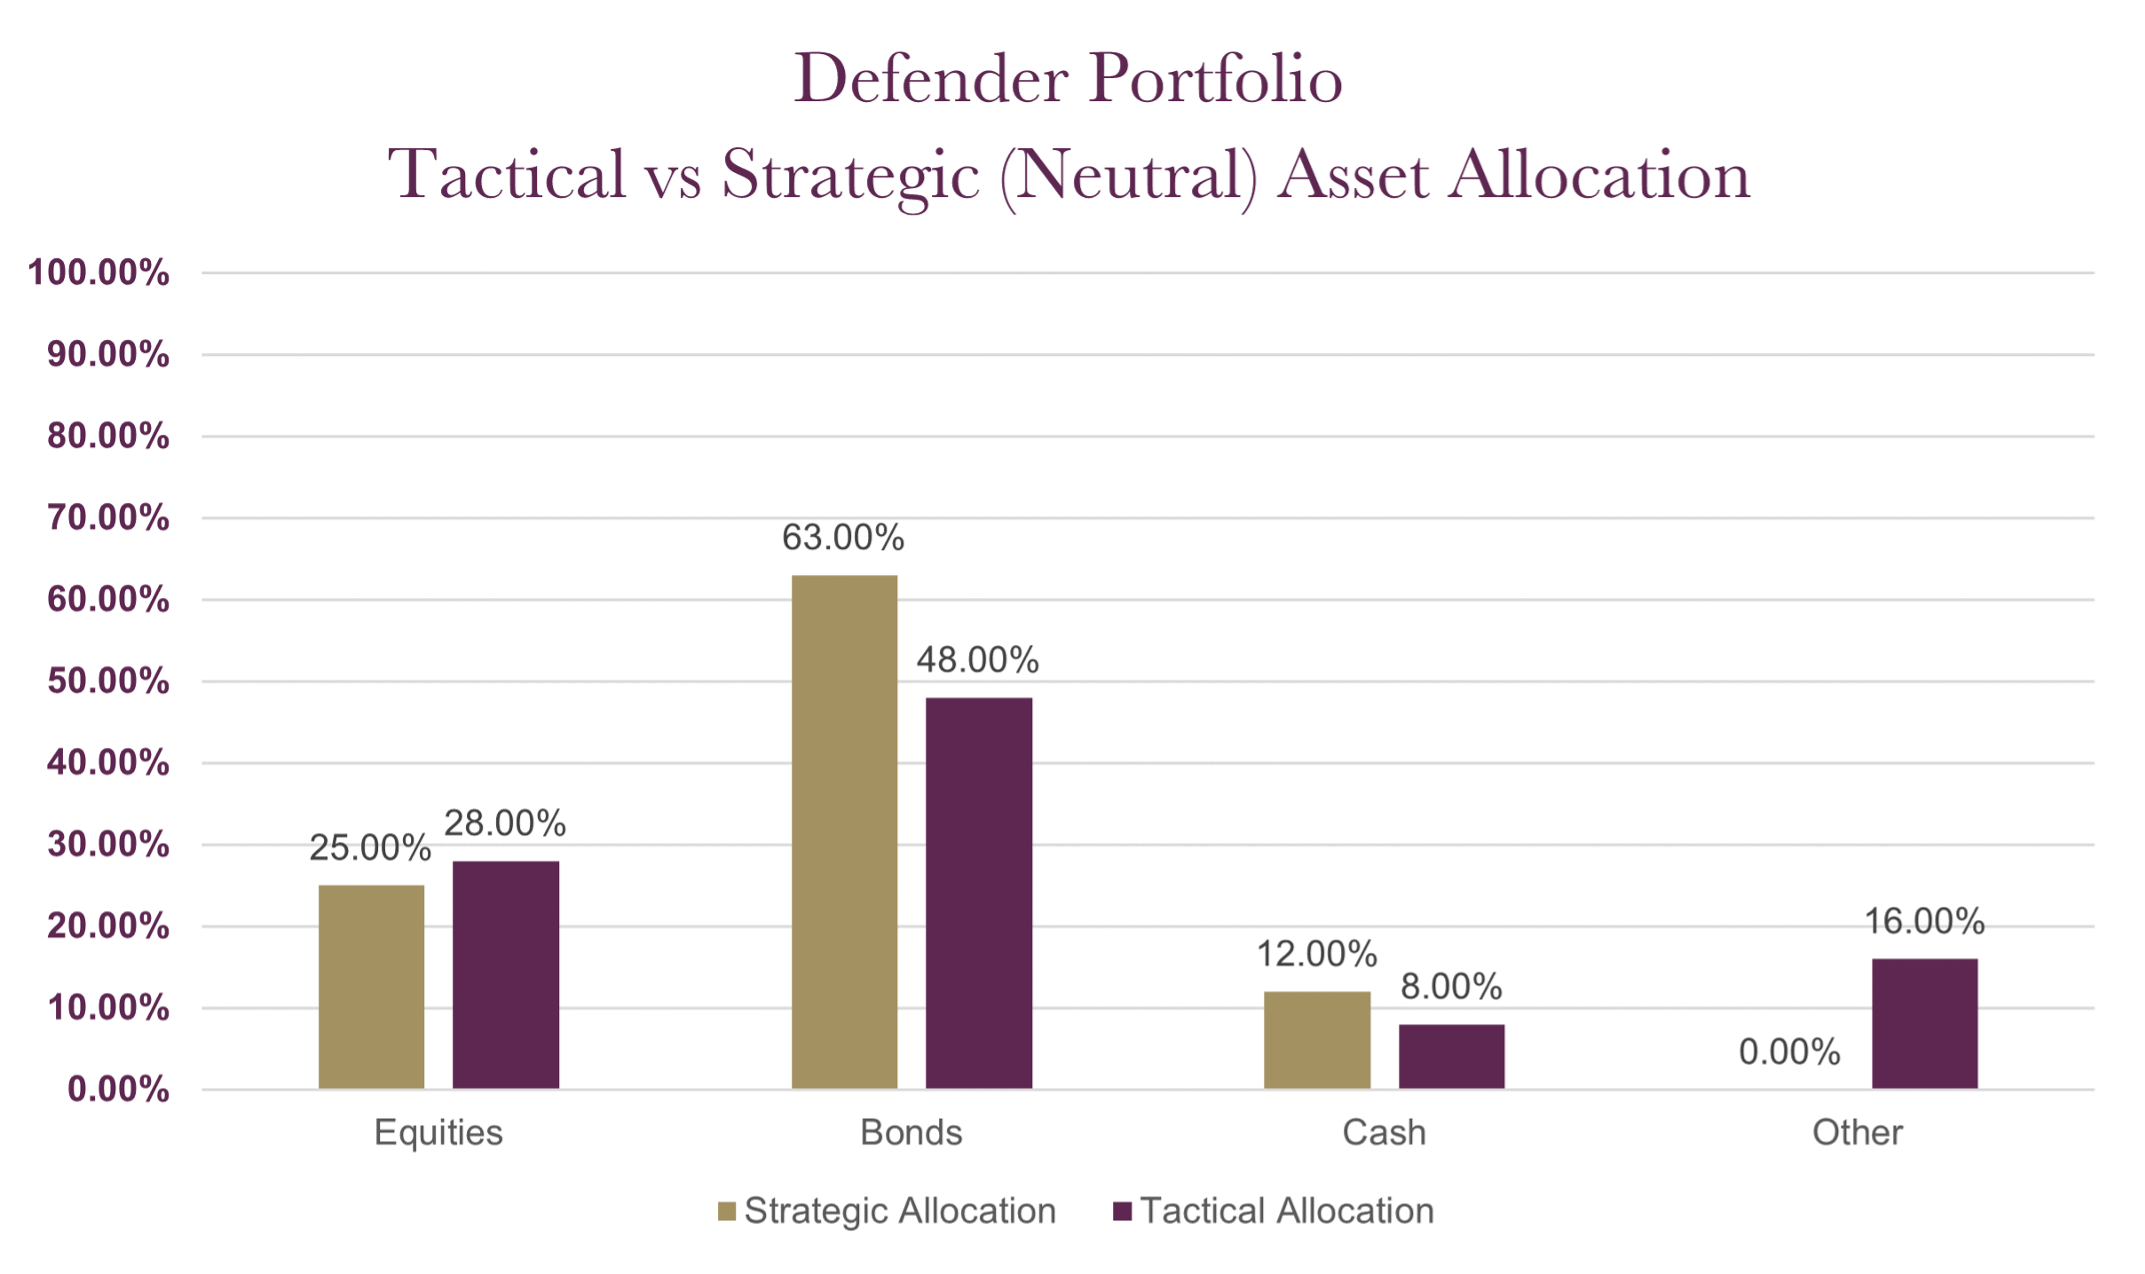
The charts below show the tactical asset allocation of the Defender Portfolio against the neutral/strategic asset allocation as well as the historical performance of the portfolio against a relevant benchmark since the start of the available data.
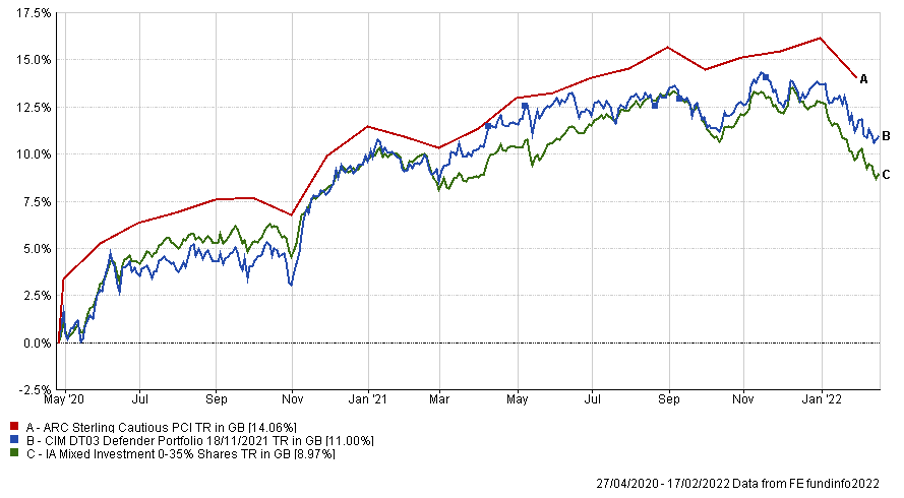
Performance data is only available from the creation date. The creation date is when the fund or portfolio started trading on behalf of investors
The table below shows the annualised performance to the last quarter end:
| 31/12/20 to 31/12/21 | |
| CIM DT03 Defender Portfolio | 3.26% |
| ARC Sterling Cautious PCI | 4.09% |
| IA Mixed Investment 0-35% Shares | 2.52% |
Changes to the Defender model
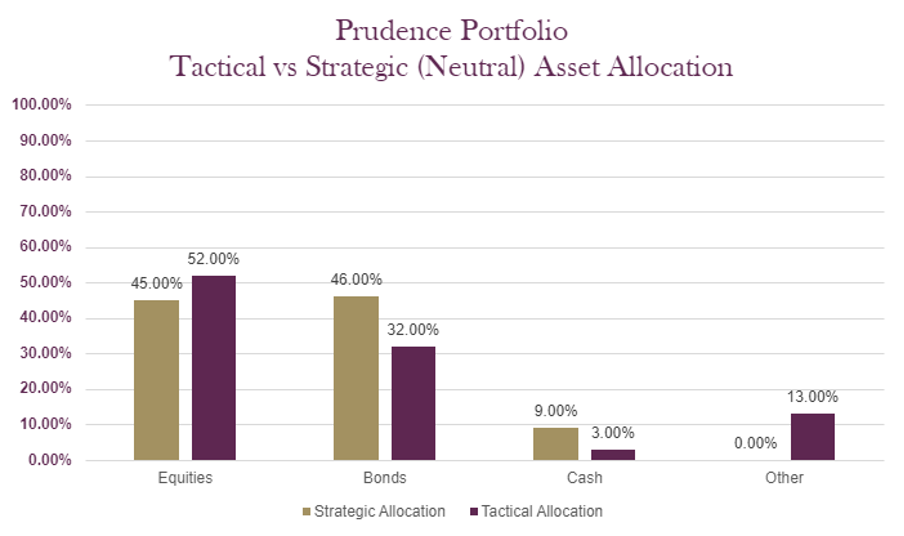
The charts below show the tactical asset allocation of the Prudence Portfolio against the neutral/strategic asset allocation as well as the historical performance of the portfolio against a relevant benchmark(s) since the start of the available data.
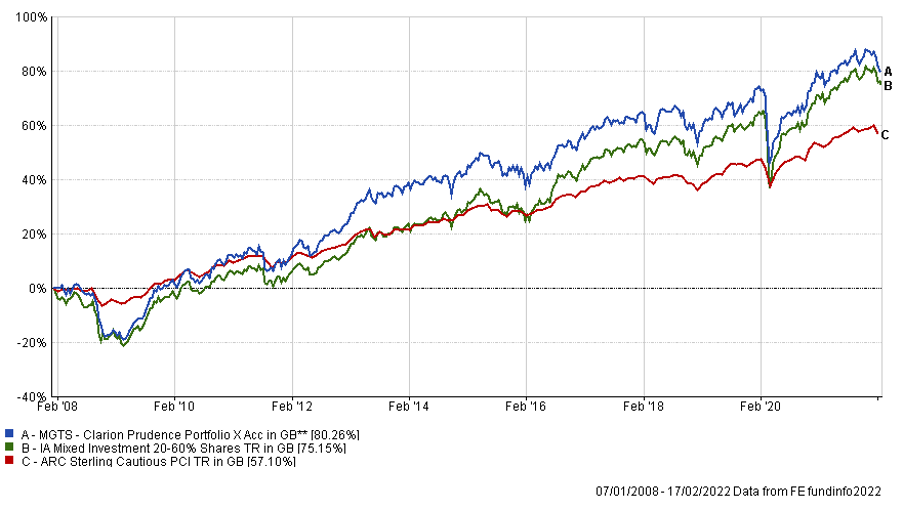
The table below shows the annualised performance to the last quarter end:
| 31/12/20 to 31/12/21 | 31/12/19 to 31/12/20 | 31/12/18 to 31/12/19 | 31/12/17 to 31/12/18 | 31/12/16 to 31/12/17 | |
| MGTS Clarion Prudence X Acc | 5.52% | 2.08% | 12.50% | -5.90% | 5.59% |
| CIM DT04 Prudence Portfolio | 6.08% | 2.90% | 11.52% | -5.74% | |
| ARC Sterling Cautious PCI | 4.09% | 4.20% | 8.05% | -3.63% | 4.48% |
| IA Mixed Investment 20-60% Shares | 6.58% | 2.85% | 11.25% | -5.68% | 6.48% |
Changes to the Prudence fund & model
The charts below show the tactical asset allocation of the Navigator Portfolio against the neutral/strategic asset allocation as well as the historical performance of the portfolio against a relevant benchmark(s) since the start of the available data.
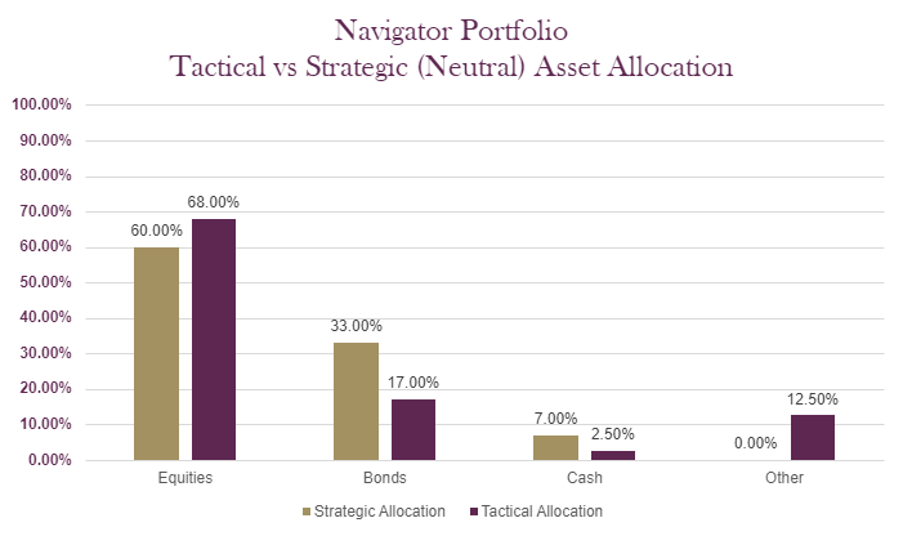
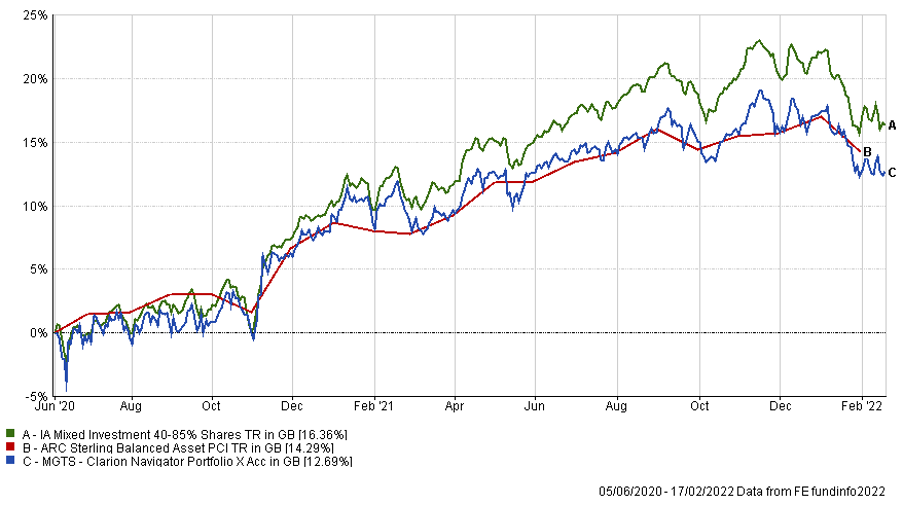
Performance data is only available from the creation date. The creation date is when the fund or portfolio started trading on behalf of investors.
The table below shows the annualised performance to the last quarter end:
| 31/12/20 to 31/12/21 | |
| MGTS Clarion Navigator X Acc | 7.49% |
| CIM DT05 Navigator Portfolio | 7.97% |
| IA Mixed Investment 40-85% Shares | 10.67% |
ARC Sterling Balanced Asset PCI 7.90%
Changes to the Navigator fund & model
The charts below show the tactical asset allocation of the Meridian Portfolio against the neutral/strategic asset allocation as well as the historical performance of the portfolio against a relevant benchmark(s) since the start of the available data.
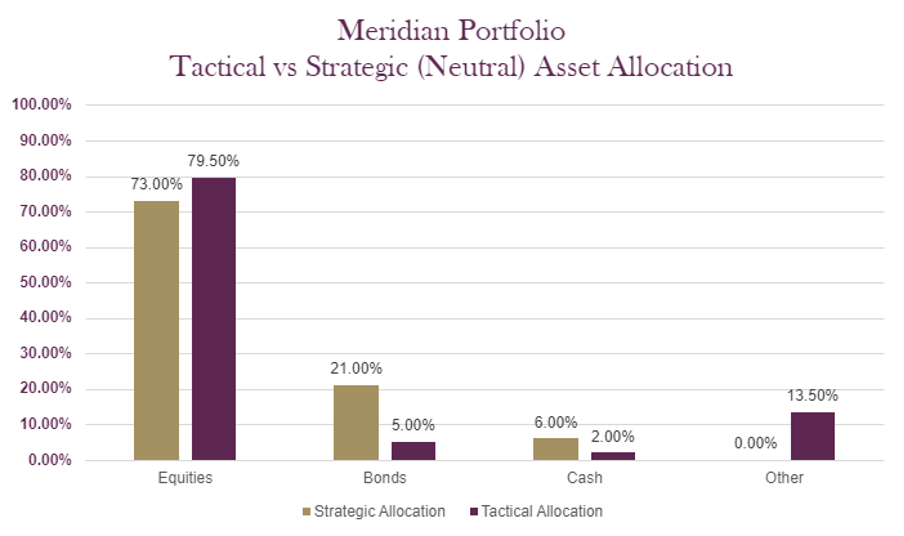
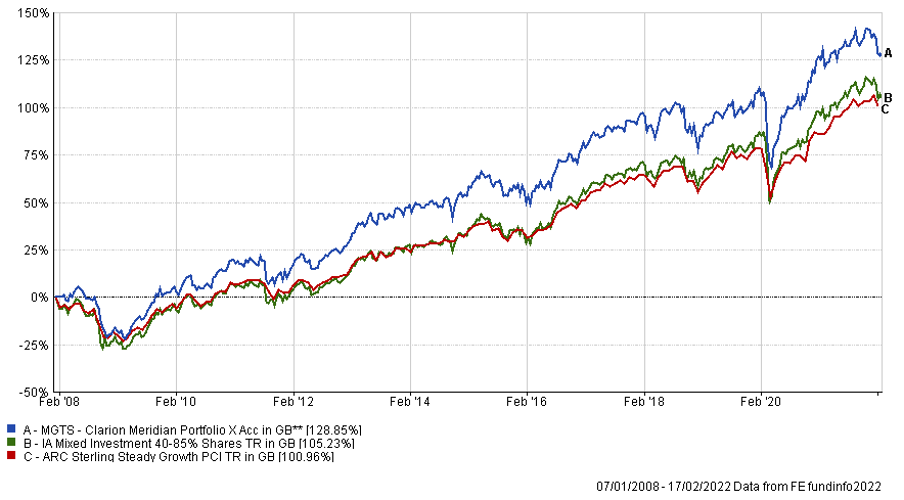
The table below shows the annualised performance to the last quarter end:
| 31/12/20 to 31/12/21 | 31/12/19 to 31/12/20 | 31/12/18 to 31/12/19 | 31/12/17 to 31/12/18 | 31/12/16 to 31/12/17 | |
| MGTS Clarion Meridian X Acc | 8.14% | 6.09% | 15.51% | -7.84% | 9.82% |
| CIM DT06 Meridian Portfolio | 8.88% | 7.34% | 15.51% | -7.05% | |
| ARC Steady Growth PCI | 10.76% | 4.56% | 15.00% | -5.64% | 9.40% |
| IA Mixed Investment 40-85% Shares | 10.67% | 5.00% | 15.29% | -6.46% | 9.58% |
Changes to the Meridian fund & model
The charts below show the tactical asset allocation of the Explorer Portfolio against the neutral/strategic asset allocation as well as the historical performance of the portfolio against a relevant benchmark(s) since the start of the available data.
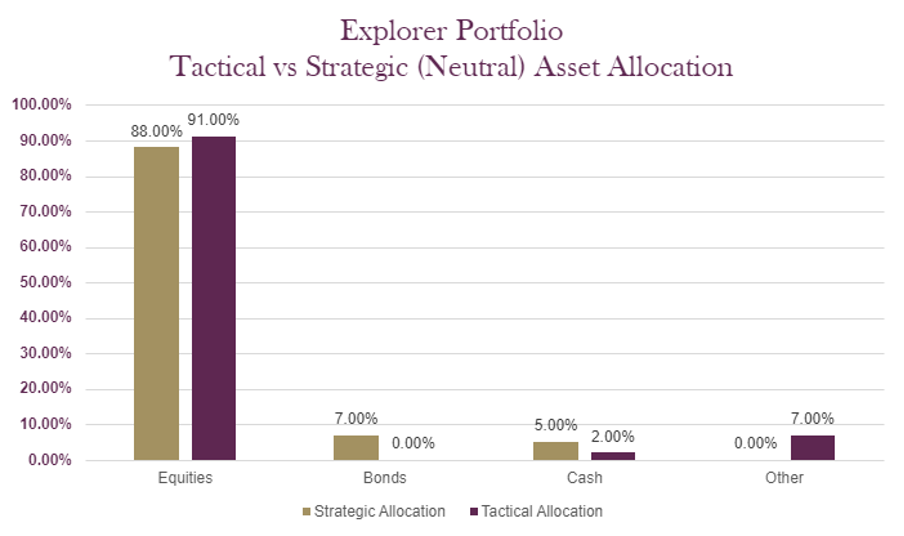
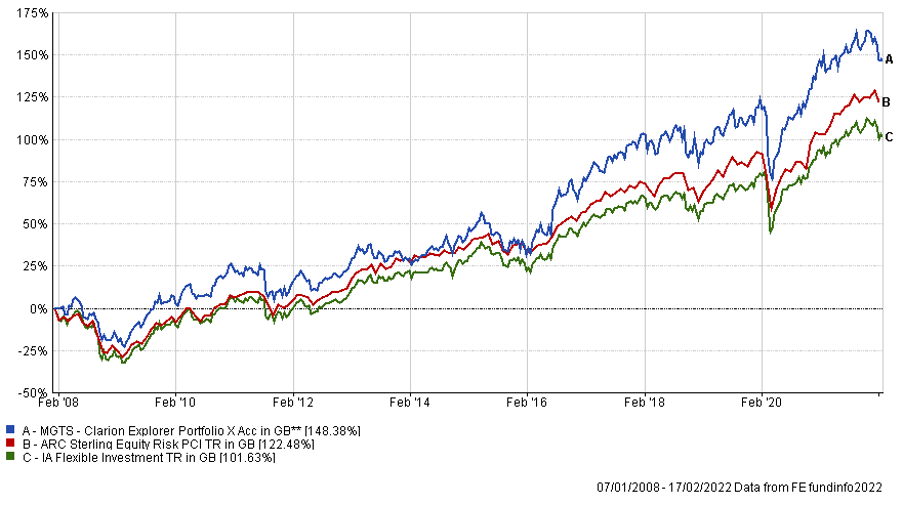
The table below shows the annualised performance to the last quarter end:
| 31/12/20 to 31/12/21 | 31/12/19 to 31/12/20 | 31/12/18 to 31/12/19 | 31/12/17 to 31/12/18 | 31/12/16 to 31/12/17 | |
| MGTS Clarion Explorer X Acc | 8.80% | 9.05% | 16.94% | -6.41% | 16.48% |
| CIM DT07 Explorer Portfolio | 9.69% | 9.74% | 16.16% | -5.66% | |
| ARC Equity Risk PCI | 13.32% | 5.82% | 18.04% | -6.50% | 11.39% |
| IA Flexible Investment | 11.06% | 6.45% | 15.26% | -6.91% | 11.02% |
Changes to the Explorer fund & model
The charts below show the tactical asset allocation of the Voyager Portfolio against the neutral/strategic asset allocation as well as the historical performance of the portfolio against a relevant benchmark(s) since the start of the available data.
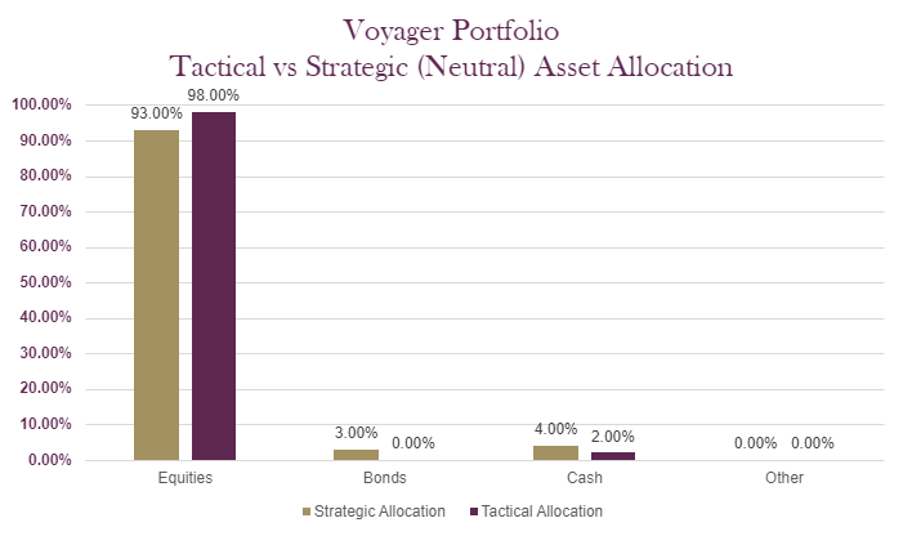
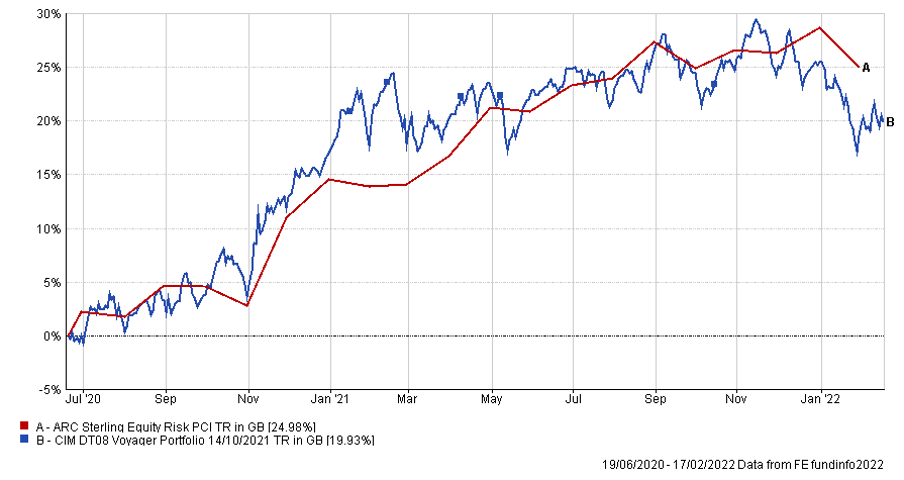
Performance data is only available from the creation date. The creation date is when the fund or portfolio started trading on behalf of investors
The table below shows the annualised performance to the last quarter end:
| 31/12/20 to 31/12/21 | |||||
| CIM DT08 Voyager Portfolio | 7.64% | ||||
| ARC Equity Risk PCI | 13.32% |
Changes to the Voyager fund & model
The charts below show the tactical asset allocation of the Adventurer Portfolio against the neutral/strategic asset allocation as well as the historical performance of the portfolio against a relevant benchmark(s) since the start of the available data.

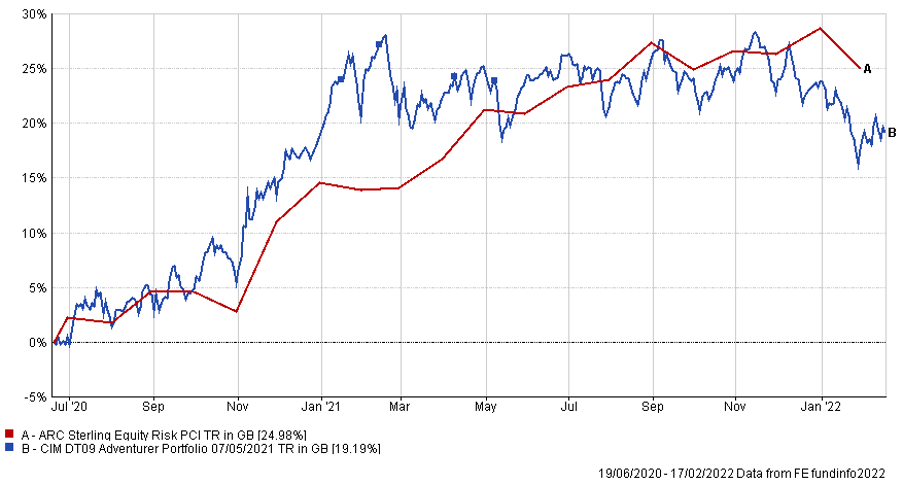
Performance data is only available from the creation date. The creation date is when the fund or portfolio started trading on behalf of investors
The table below shows the annualised performance to the last quarter end:
| 31/12/20 to 31/12/21 | |||||
| CIM DT09 Adventurer Portfolio | 4.41% | ||||
| ARC Equity Risk PCI | 13.32% |
Changes to the Adventurer model
The charts below show the tactical asset allocation of the Pioneer Portfolio against the neutral/strategic asset allocation as well as the historical performance of the portfolio against a relevant benchmark(s) since the start of the available data.
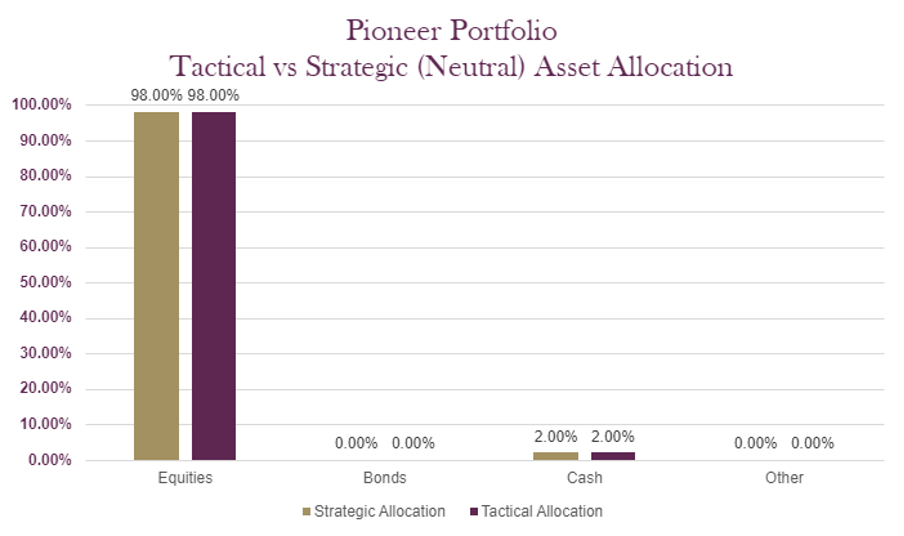
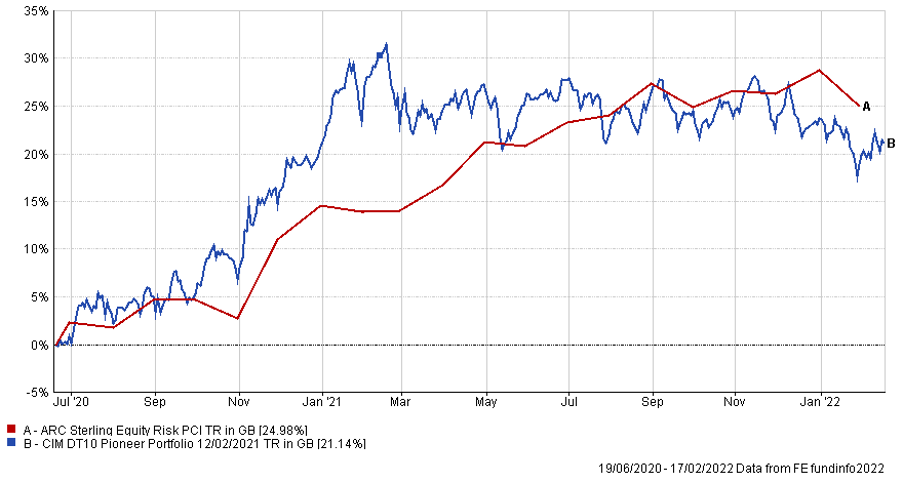
Performance data is only available from the creation date. The creation date is when the fund or portfolio started trading on behalf of investors
The table below shows the annualised performance to the last quarter end:
| 31/12/20 to 31/12/21 | |||||
| CIM DT10 Pioneer Portfolio | 2.66% | ||||
| ARC Equity Risk PCI | 13.32% |
Changes to the Pioneer model
The content of this article does not constitute financial advice and you may wish to seek professional advice based on your individual circumstances before making any financial decisions.
Any investment performance figures referred to relate to past performance which is not a reliable indicator of future results and should not be the sole factor of consideration when selecting a product or strategy. The value of investments, and the income arising from them, can go down as well as up and is not guaranteed, which means that you may not get back what you invested. Unless indicated otherwise, performance figures are stated in British Pounds. Where performance figures are stated in other currencies, changes in exchange rates may also cause an investment to fluctuate in value.
If you’d like more information about this article, or any other aspect of our true lifelong financial planning, we’d be happy to hear from you. Please call +44 (0)1625 466 360 or email [email protected].
Click here to sign-up to The Clarion for regular updates.