True lifelong financial planning for the serious business of life.
True lifelong financial planning
for the serious business of life.
True lifelong financial planning for the serious business of life.
True lifelong financial planning
for the serious business of life.
Tags: Adventurer Portfolio, Defender Portfolio, Discretionary Investment Management, Explorer Portfolio, funds, investment, Meridian Portfolio, MGTS Clarion Explorer, MGTS Clarion Meridian, MGTS Clarion Prudence, MTGS Clarion Navigator, Navigator Portfolio, Pioneer Portfolio, Prudence Portfolio, Voyager Portfolio
Category:
Investment management
This article provides a brief overview of the topics discussed in the recent investment committee meeting and the decisions made following those discussions.
The following notes summarise the main points discussed by the Investment Committee.
US equity markets suffered continued selloffs throughout the last few weeks with the futures market predicting further losses. This was led by Netflix, which plummeted 22% following its latest earnings release. Although the company beat analyst expectations for user numbers, and earnings being in line, the admission that future growth could be impacted by competitors weighed heavily on investor sentiment. Netflix was very much a pandemic winner as other leisure opportunities were detonated by lockdowns, and it is not surprising that such growth could not be sustained in perpetuum. The scale of the selloff based on this logic seems too intense. Other casualties included Peloton, whose shares slid heavily on news that production of new equipment would be stopped temporarily due to waning demand.
Attention turned towards January’s FOMC meeting where the expectation is that the Federal Reserve will outline interest rate movements to combat CPI inflation, which has remained stubbornly high and hit 7% year on year in December. The projection from the previous meeting was for four interest rate rises in 2022, with a resultant interest rate around the 1% mark. Any divergence from this projection in January’s meeting could see markets continue trading with excess volatility, and bond yields would likely push higher.
The UK’s inflation rate hit 5.4% year on year in December, driven by rising energy prices contributing to the housing component. The Bank of England has already begun raising interest rates in advance of other central banks, and the next MPC meeting in February could see further rises, with the labour market remaining tight and Covid restrictions due to be scaled back. The possibility of tapering gilt and corporate bond purchases, which currently reinvests the proceeds from maturing bonds back into the market with a total ceiling of £895bn, will also be under scrutiny, with the first step likely to be letting bonds mature and not reinvesting the proceeds. The Bank of England is the biggest holder of gilts, owning c.33% of the outstanding issuance at the latest record date, and any step back from the market by its biggest participant would inevitably have an impact on yields.
Tensions between Russia and the West continue to simmer, with c.100,000 Russian troops now estimated to be stationed on the border of Ukraine. The US announced 8,500 troops were on standby for deployment if required by the NATO alliance. UK intelligence highlighted the concern of a rapid strike on the capital Kiev, and both UK and US diplomats have begun pulling out embassy staff. The potential impact of any escalation is hard to gauge. Europe’s dependence on Russian oil and gas exports has been laid bare in the energy crisis of last year, and the possibility of supplies becoming even tighter as a result of the current circumstances cannot be ruled out.
In the UK, Plan B Covid restrictions are to be lifted, with the work from home guidance and mask-wearing requirements imposed before Christmas to be reversed. As has been discussed in earlier diaries, the UK has followed the expected pattern set by South Africa’s earlier data with a sharp falloff in cases. Hospitalisations and deaths have also remained low in comparison to earlier waves, with rolling seven-day averages both on the decrease and the NHS not having been overwhelmed. The prospect of Covid-19 being downgraded to an endemic status in the UK appears plausible, which could see the UK running a more open economy than other developed nations, resulting in a faster economic recovery.
Growth stocks (and the US indices dominated by them) have been in the ascendancy since the financial crisis, benefitting from low interest rates and the integration of the internet, and further bolstered by the switch to online working and retail during the pandemic but just as growth stocks tend to outperform in a falling yields environment, value stocks tend to outperform in a rising yields environment, which would be beneficial for the UK and detrimental to US performance. It was noted however that the broad definitions of growth and value were not necessarily reflective of the true nature of the business. There are good, highly rated companies which are not necessarily expensive but classed as growth, and there are a lot of poor companies which deserve to be cheap and are classified as value.
The Committee agreed that supply chain bottlenecks were fuelling inflation, thus central banks were likely to view inflation as more transitory than permanent and delay rate increases.
The property sector in China is responsible for approximately 3rd of China’s GDP growth, so regulatory curbs on spending in this area have contributed to the economic slowdown. Unlike in the West, China has acted on bubbles and misallocations in certain economic sectors and the cryptocurrency space early on, preventing them from growing further, and while this has created a more stable long-term outlook, a slower short-term growth is likely to be expected. Compared to the US, valuations in Asia and EM are lower and there are more prospects for policy loosening in these regions than in developed markets.
The Committee underlined the importance of active management regardless of investment style in the current environment.
Bonds realistically have far more downside risk than upside potential in the current financial climate. With the Federal Reserve and the Bank of England progressing towards less accommodative conditions, treasuries and gilts are likely to sell off and yields would rise. The European Central Bank is showing no imminent signs of quantitative tightening despite surging inflation, which may offer some strategic opportunities across government bonds if the typical correlation between them is skewed. The Clarion Funds and model portfolios remain positioned with an overweight bias to short-dated corporate credit to insulate portfolios from rising yields which more adversely affect longer-dated bonds.
US equities, particularly the high P/E tech stocks that dominate the index, have seen increased volatility since the start of 2022, and demonstrate that the performance of the last few years can change very quickly. One only has to look at the Baillie Gifford American fund to see the shocking reversal in equity style at play. The conviction in an underweight US equity position across the Clarion Funds and model portfolios on the basis of excessive valuation has seen an outperformance over the last 12 weeks.
The UK is primed for a strong recovery with the route out of Covid looking increasingly plausible. Many services and financials laggards could see re-rating and significant capital gains for investors as a result. UK equities across the board have long traded at a discount to their peers in other developed markets and offer excellent value for quality companies, many of which possess robust worldwide revenue streams. The Investment Committee retain an overweight position in UK equities on this basis.
For a fuller version of Clarion’s Economic and Stock Market Commentary, written by Clarion Group Chairman Keith Thompson, please click here
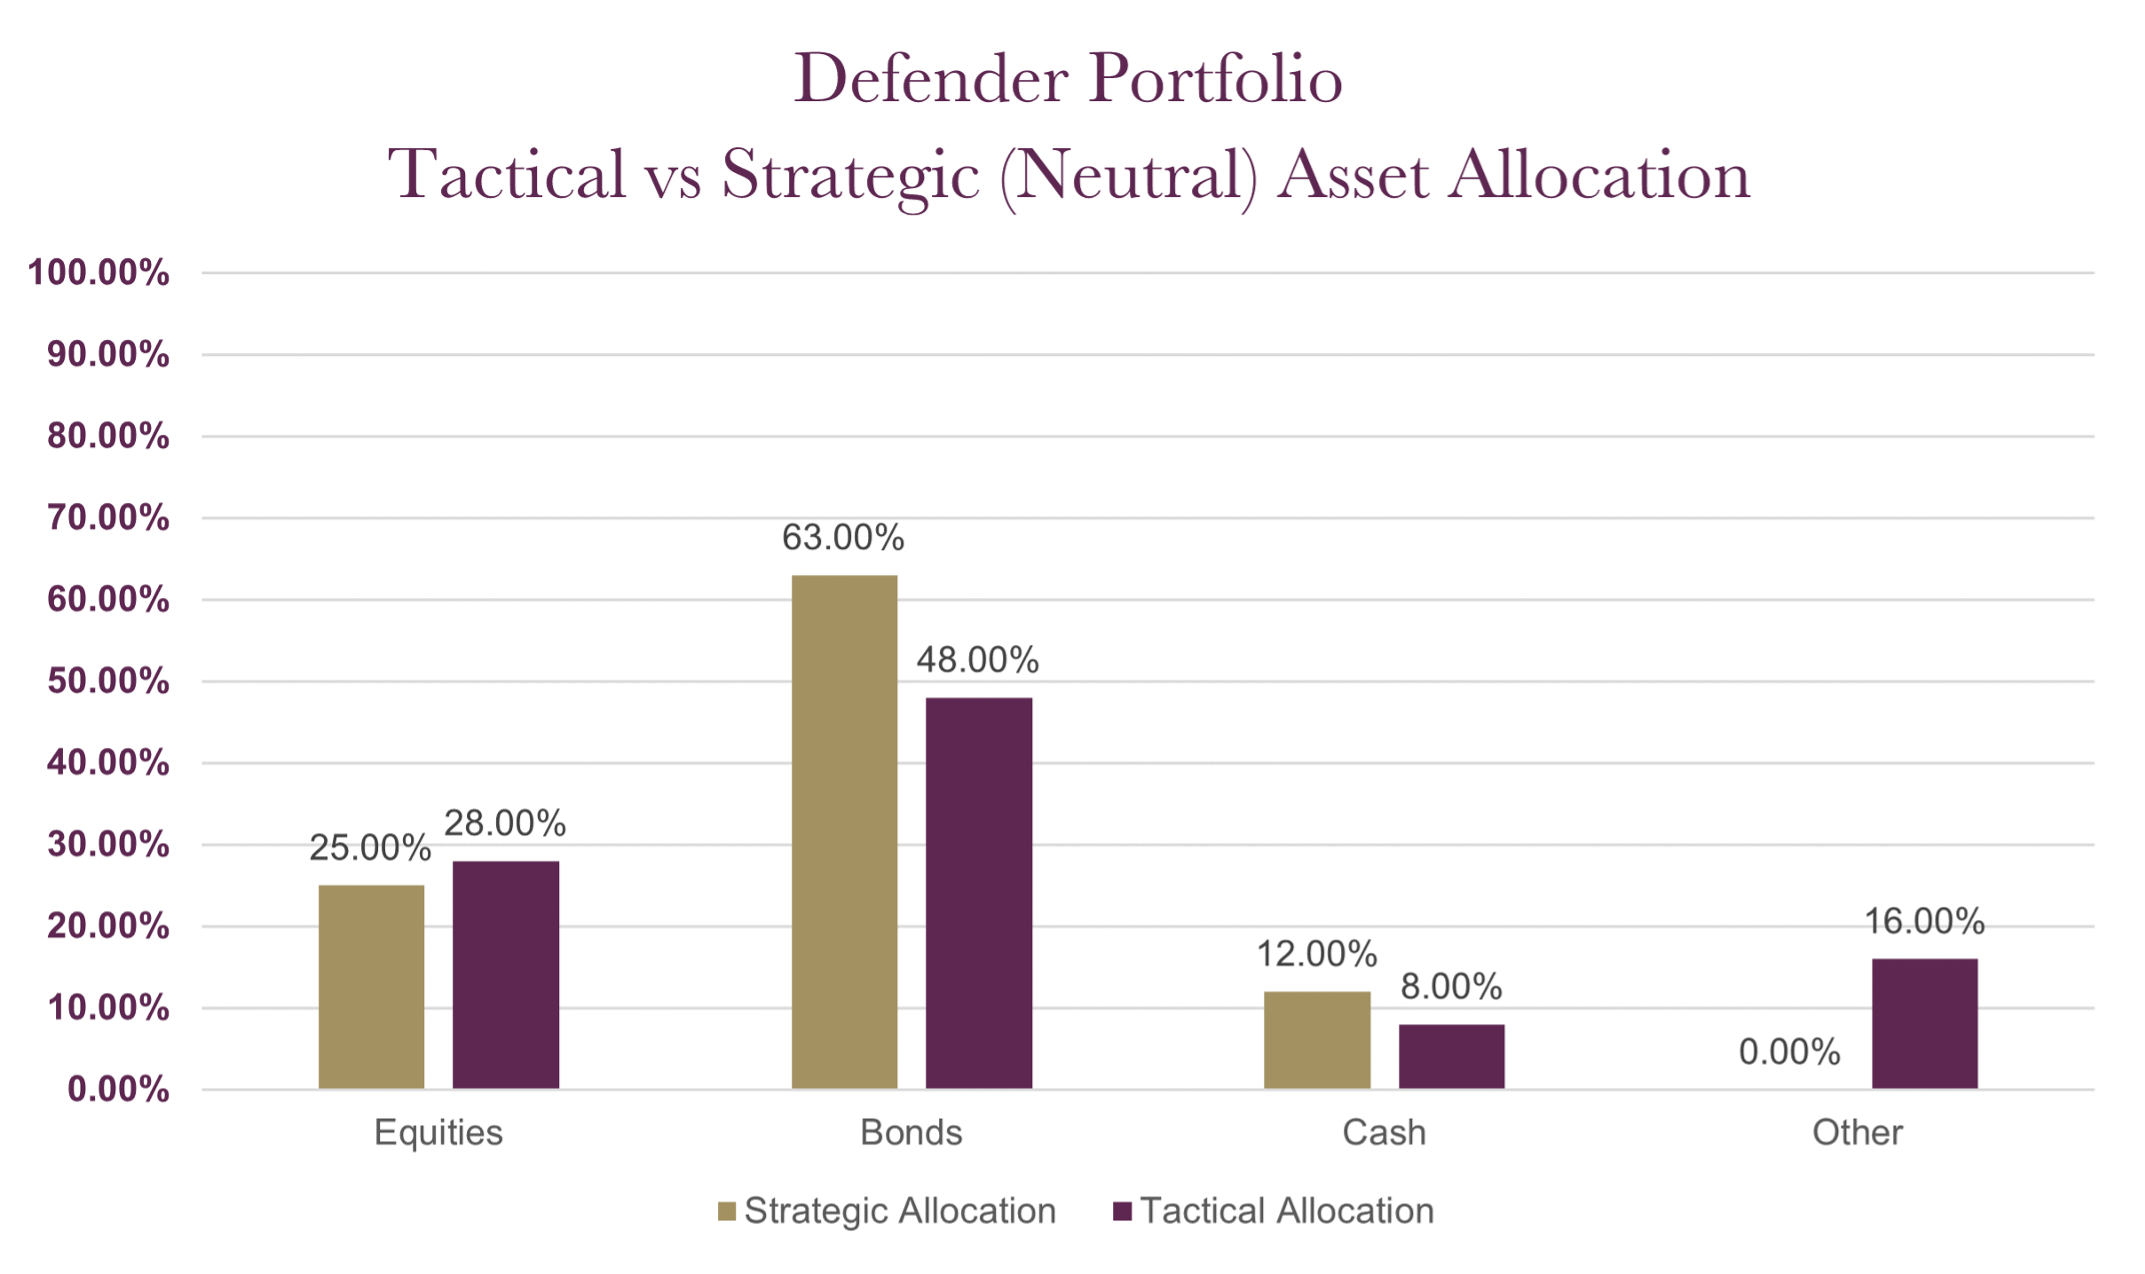
The charts below show the tactical asset allocation of the Defender Portfolio against the neutral/strategic asset allocation as well as the historical performance of the portfolio against a relevant benchmark since the start of the available data.
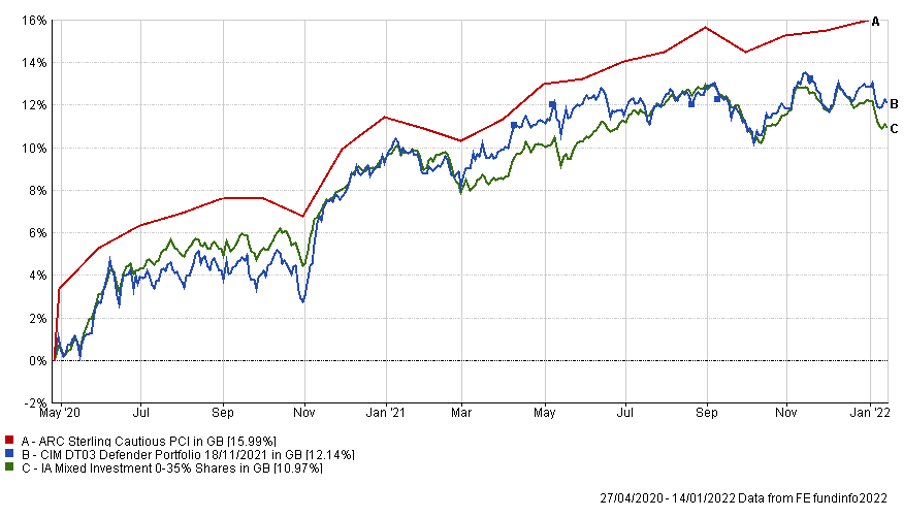
The table below shows the annualised performance to the last quarter end:
| 31/12/20 to 31/12/21 | |
| CIM DT03 Defender Portfolio | 3.26% |
| ARC Sterling Cautious PCI | 4.09% |
| IA Mixed Investment 0-35% Shares | 2.52% |
Changes to the Defender model
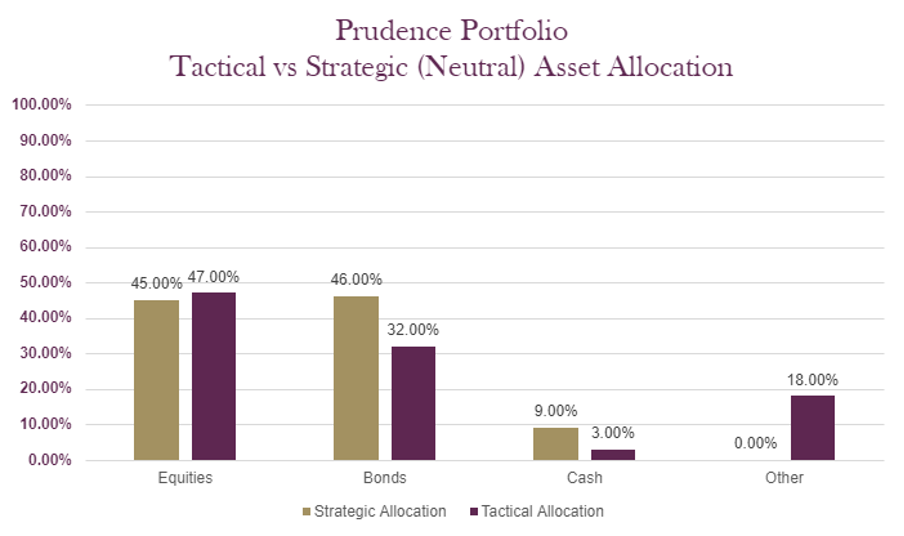
The charts below show the tactical asset allocation of the Prudence Portfolio against the neutral/strategic asset allocation as well as the historical performance of the portfolio against a relevant benchmark(s) since the start of the available data.
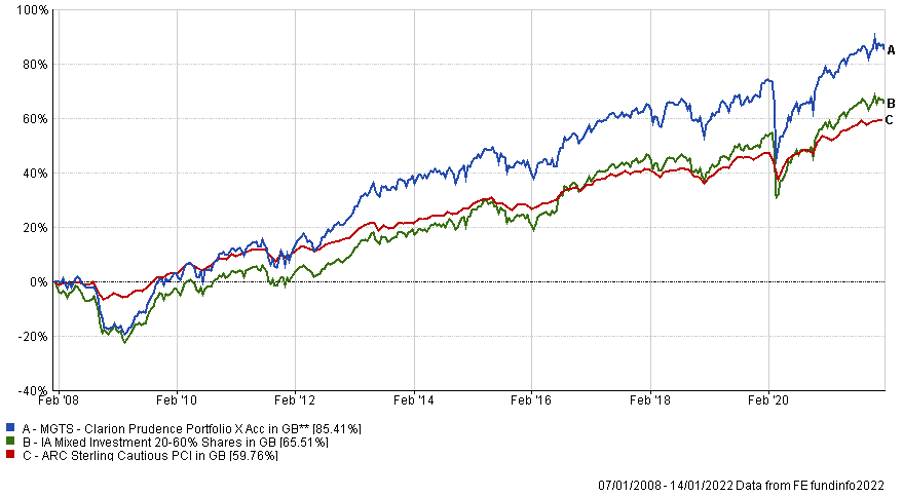
The table below shows the annualised performance to the last quarter end:
| 31/12/20 to 31/12/21 | 31/12/19 to 31/12/20 | 31/12/18 to 31/12/19 | 31/12/17 to 31/12/18 | 31/12/16 to 31/12/17 | |
| MGTS Clarion Prudence X Acc | 5.52% | 2.08% | 12.50% | -5.90% | 5.59% |
| CIM DT04 Prudence Portfolio | 6.08% | 2.90% | 11.52% | -5.74% | |
| ARC Sterling Cautious PCI | 4.09% | 4.20% | 8.05% | -3.63% | 4.48% |
| IA Mixed Investment 20-60% Shares | 6.58% | 2.85% | 11.25% | -5.68% | 6.48% |
Changes to the Prudence fund & model
The charts below show the tactical asset allocation of the Navigator Portfolio against the neutral/strategic asset allocation as well as the historical performance of the portfolio against a relevant benchmark(s) since the start of the available data.
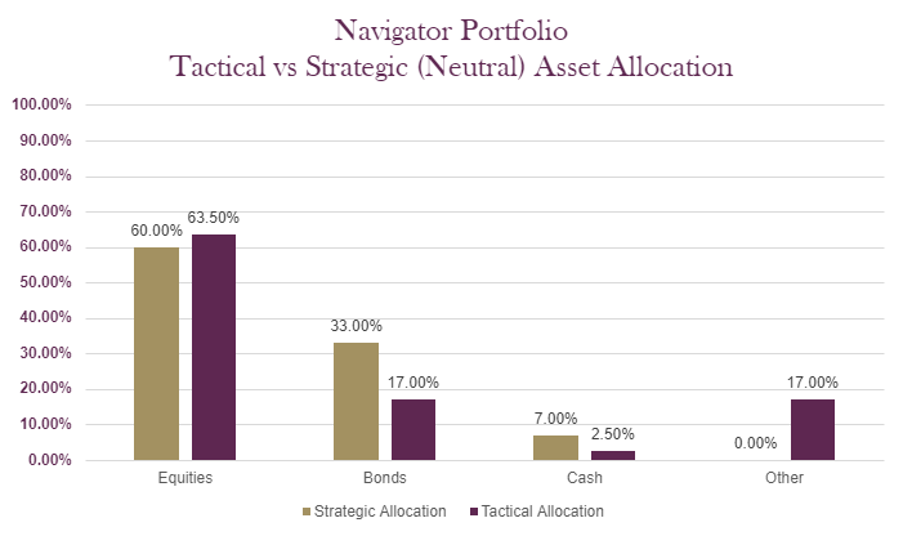
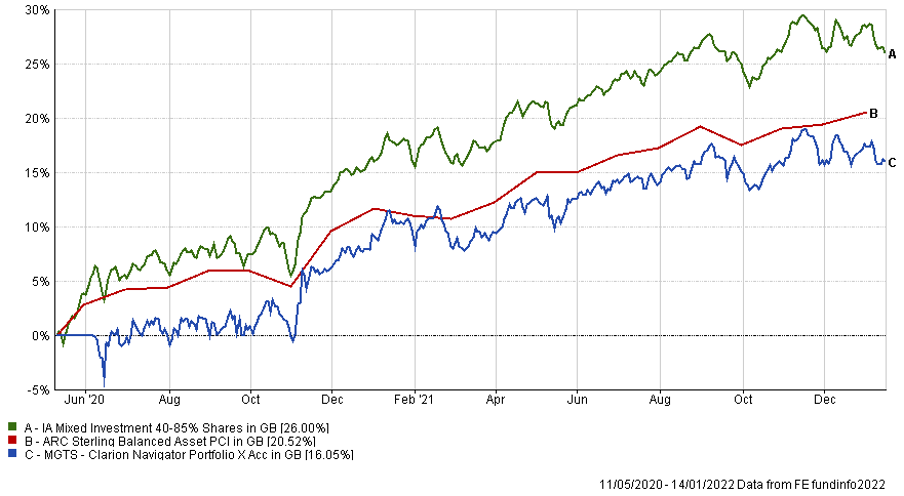
The table below shows the annualised performance to the last quarter end:
| 31/12/20 to 31/12/21 | |
| MGTS Clarion Navigator X Acc | 7.49% |
| CIM DT05 Navigator Portfolio | 7.97% |
| IA Mixed Investment 40-85% Shares | 10.67% |
ARC Sterling Balanced Asset PCI 7.90%
Changes to the Navigator fund & model
The charts below show the tactical asset allocation of the Meridian Portfolio against the neutral/strategic asset allocation as well as the historical performance of the portfolio against a relevant benchmark(s) since the start of the available data.
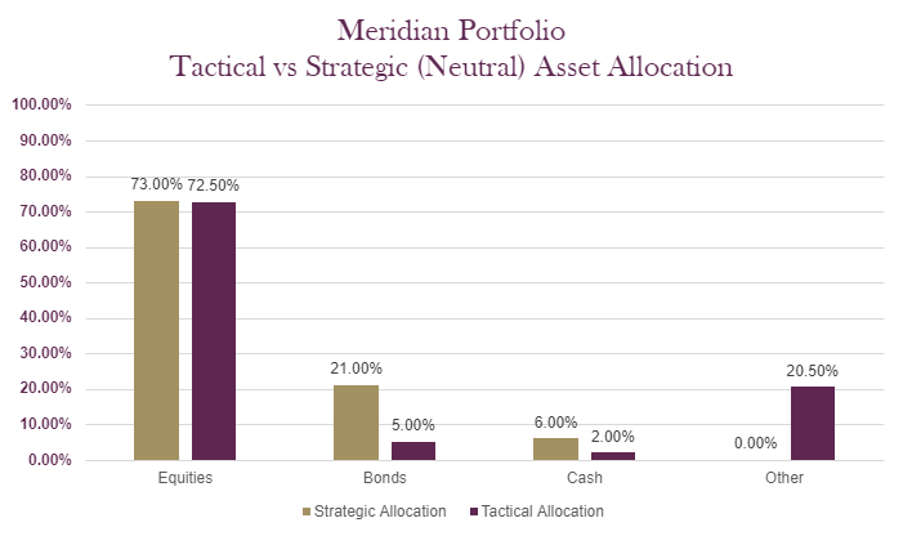
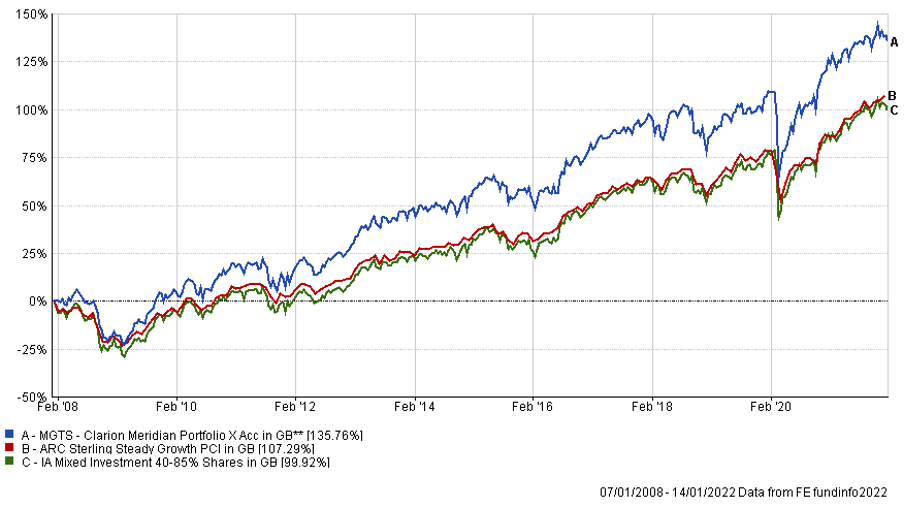
The table below shows the annualised performance to the last quarter end:
| 31/12/20 to 31/12/21 | 31/12/19 to 31/12/20 | 31/12/18 to 31/12/19 | 31/12/17 to 31/12/18 | 31/12/16 to 31/12/17 | |
| MGTS Clarion Meridian X Acc | 8.14% | 6.09% | 15.51% | -7.84% | 9.82% |
| CIM DT06 Meridian Portfolio | 8.88% | 7.34% | 15.51% | -7.05% | |
| ARC Steady Growth PCI | 10.76% | 4.56% | 15.00% | -5.64% | 9.40% |
| IA Mixed Investment 40-85% Shares | 10.67% | 5.00% | 15.29% | -6.46% | 9.58% |
Changes to the Meridian fund & model
The charts below show the tactical asset allocation of the Explorer Portfolio against the neutral/strategic asset allocation as well as the historical performance of the portfolio against a relevant benchmark(s) since the start of the available data.
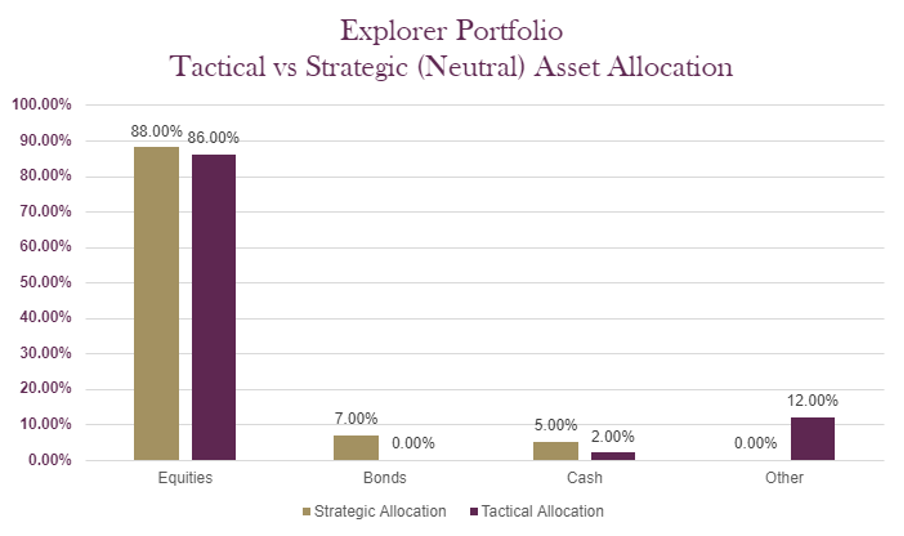
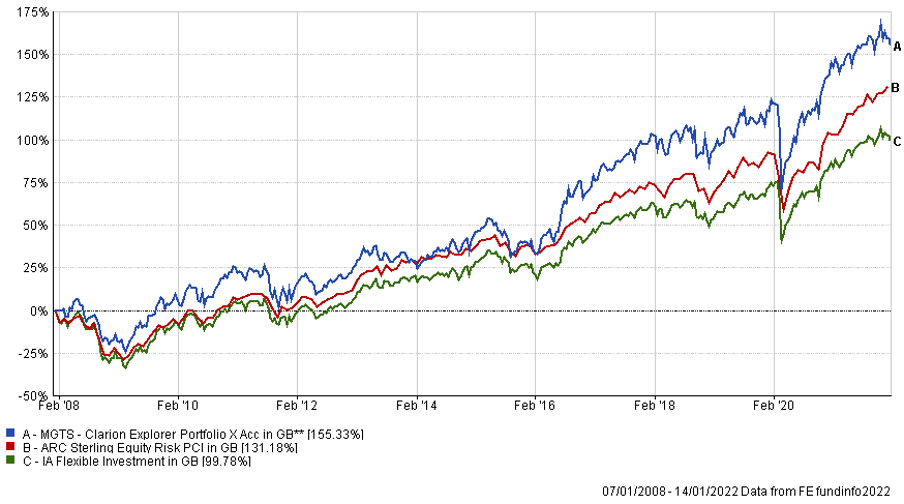
The table below shows the annualised performance to the last quarter end:
| 31/12/20 to 31/12/21 | 31/12/19 to 31/12/20 | 31/12/18 to 31/12/19 | 31/12/17 to 31/12/18 | 31/12/16 to 31/12/17 | |
| MGTS Clarion Explorer X Acc | 8.80% | 9.05% | 16.94% | -6.41% | 16.48% |
| CIM DT07 Explorer Portfolio | 9.69% | 9.74% | 16.16% | -5.66% | |
| ARC Equity Risk PCI | 13.32% | 5.82% | 18.04% | -6.50% | 11.39% |
| IA Flexible Investment | 11.06% | 6.45% | 15.26% | -6.91% | 11.02% |
Changes to the Explorer fund & model
The charts below show the tactical asset allocation of the Voyager Portfolio against the neutral/strategic asset allocation as well as the historical performance of the portfolio against a relevant benchmark(s) since the start of the available data.
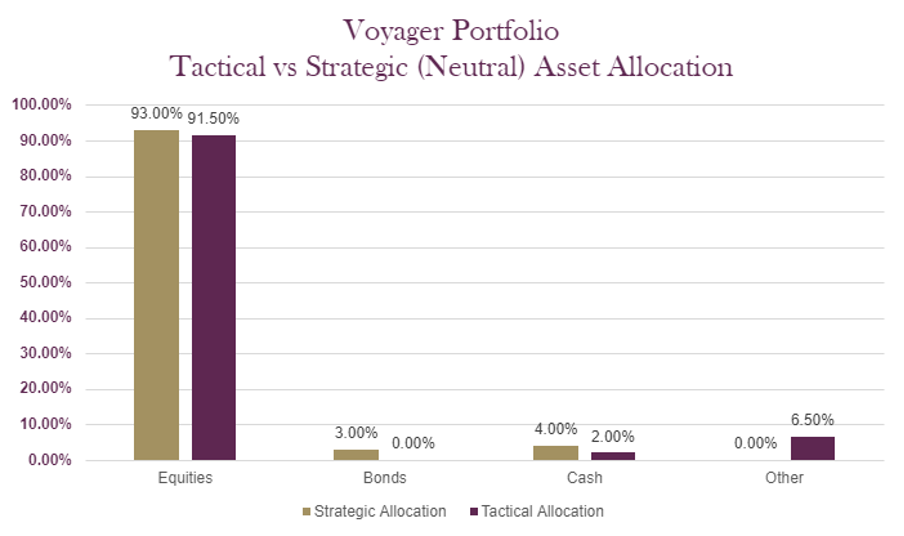
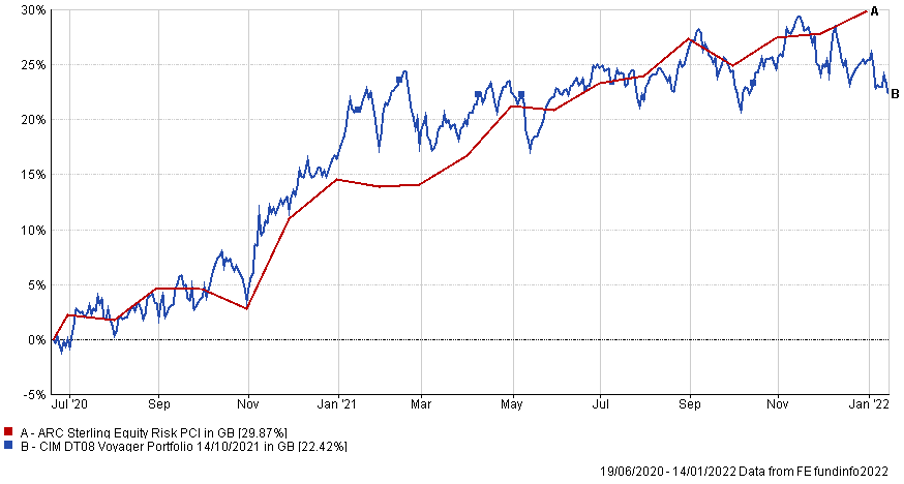
The table below shows the annualised performance to the last quarter end:
| 31/12/20 to 31/12/21 | |||||
| CIM DT08 Voyager Portfolio | 7.64% | ||||
| ARC Equity Risk PCI | 13.32% |
Changes to the Voyager fund & model
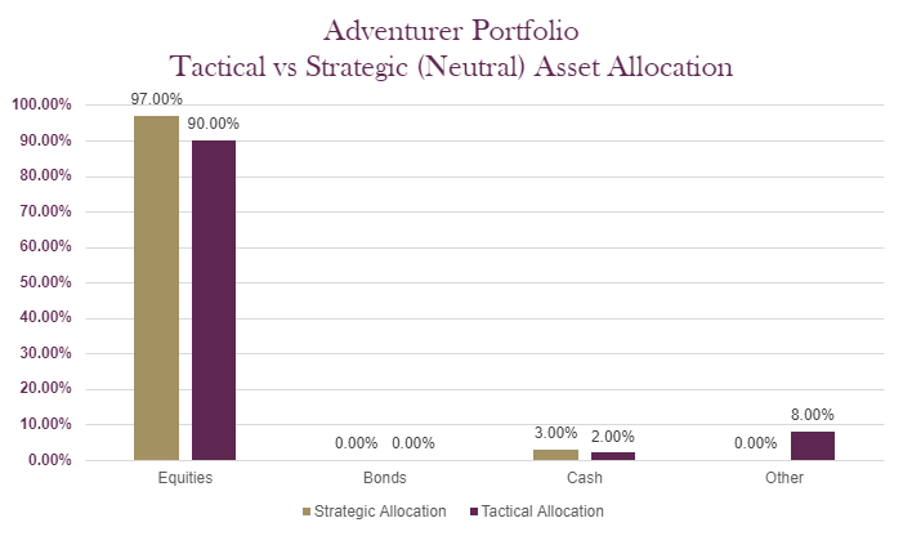
The charts below show the tactical asset allocation of the Adventurer Portfolio against the neutral/strategic asset allocation as well as the historical performance of the portfolio against a relevant benchmark(s) since the start of the available data.
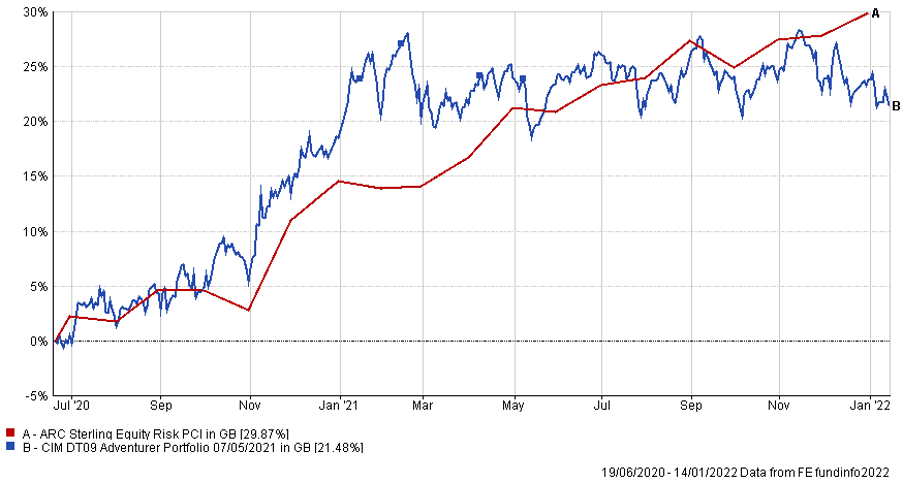
The table below shows the annualised performance to the last quarter end:
| 31/12/20 to 31/12/21 | |||||
| CIM DT09 Adventurer Portfolio | 4.41% | ||||
| ARC Equity Risk PCI | 13.32% |
Changes to the Adventurer model
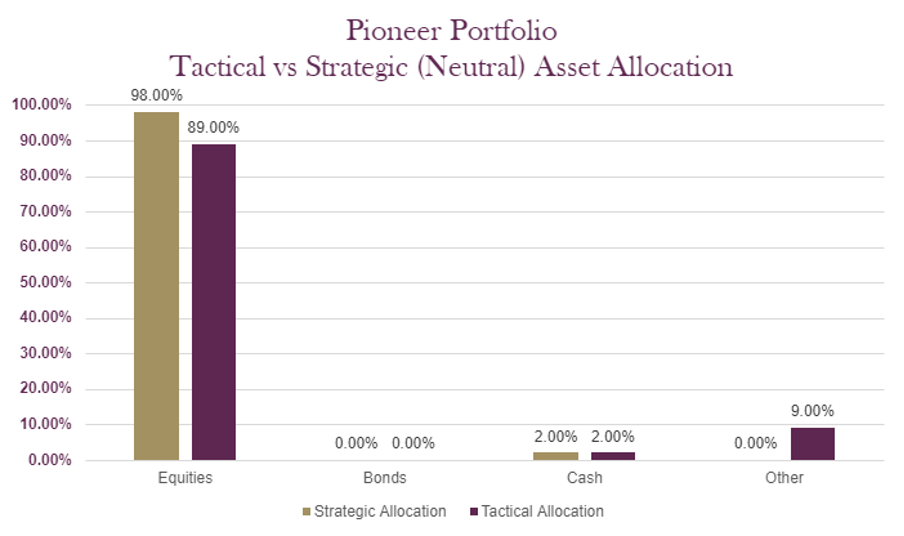
The charts below show the tactical asset allocation of the Pioneer Portfolio against the neutral/strategic asset allocation as well as the historical performance of the portfolio against a relevant benchmark(s) since the start of the available data.
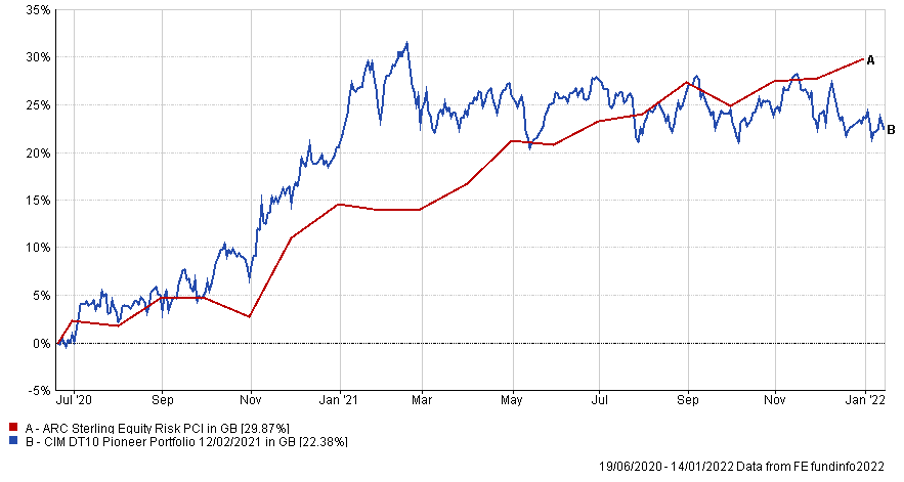
The table below shows the annualised performance to the last quarter end:
| 31/12/20 to 31/12/21 | |||||
| CIM DT10 Pioneer Portfolio | 2.66% | ||||
| ARC Equity Risk PCI | 13.32% |
Changes to the Pioneer model
Any investment performance figures referred to relate to past performance which is not a reliable indicator of future results and should not be the sole factor of consideration when selecting a product or strategy. The value of investments, and the income arising from them, can go down as well as up and is not guaranteed, which means that you may not get back what you invested. Unless indicated otherwise, performance figures are stated in British Pounds. Where performance figures are stated in other currencies, changes in exchange rates may also cause an investment to fluctuate in value.
If you’d like more information about this article, or any other aspect of our true lifelong financial planning, we’d be happy to hear from you. Please call +44 (0)1625 466 360 or email [email protected].
Click here to sign-up to The Clarion for regular updates.