True lifelong financial planning for the serious business of life.
True lifelong financial planning
for the serious business of life.
True lifelong financial planning for the serious business of life.
True lifelong financial planning
for the serious business of life.
Tags: Adventurer Portfolio, Defender Portfolio, Discretionary Investment Management, Explorer Portfolio, funds, investment, Meridian Portfolio, MGTS Clarion Explorer, MGTS Clarion Meridian, MGTS Clarion Prudence, MTGS Clarion Navigator, Navigator Portfolio, Pioneer Portfolio, Prudence Portfolio, Voyager Portfolio
Category:
Investment management
The Clarion Investment Committee met on the 12th of January 2023. The following notes summarise the main points of consideration in the Investment Committee discussions.
(These notes are as at the actual date of the Investment Committee, since which time major central banks have continued with the theme of tightening monetary policy with further interest rate rises although now at a slightly slower pace and inflationary pressures have continued to ease slightly. These developments were widely anticipated by the Clarion Investment Committee and factored into the investment strategy decisions outlined below).
For a fuller version of Clarion’s Economic and Stock Market Commentary, written by Clarion Group Chairman Keith Thompson, please click here
While bond markets offer some upside opportunities following a sharp rise in bond yields last year, it is the Committee’s view that there is a high probability increased volatility will prevail, especially at the longer end of the yield curve. The Committee expect yield curves to normalise with yields at the shorter end of the curve falling and yields at the longer end rising. The Committee have increased the exposure to interest rate risk slightly over the last six months, leaving some room to increase it further should longer-term yields rise. The Committee retain a bias to short-duration debt but are monitoring developments to see if more attractive valuation opportunities arise through adding appropriate duration and credit risk.
Although valuations in the US have moderated relative to their recent past, when compared to other developed markets, such as Europe or the United Kingdom, US equities continue to look expensive. Within the US, the average P/E ratio is approximately two standard deviations higher than the global average. This is significantly higher than the UK & Europe and higher than Asia and Emerging Markets. It is the Committee’s view that the US equity market is likely to have a risk of further contraction compared to markets trading at lower valuations.
The Committee are of the view that these high valuations may leave room for further downward price movements and as such the Committee retain an underweight position to the US and will likely continue to do so until attractive buy opportunities arise in this region. The possibility of a weakening dollar also supports the decision to underweight the US. The Committee continue to focus capital allocation lower down the market cap in the US to take advantage of the strong consumer sentiment supporting domestic businesses.
UK equities are heavily discounted compared to peer-developed equities and, in the case of mid and small caps, are priced firmly with a recessionary outlook in mind. Large cap equities have held up well due to improved overseas earnings translated into sterling and robust pricing power. Surprise upside economic indicators ought to be a catalyst for improved performance. The Committee continue to overweight UK equities.
Asia Pacific & Emerging Market equities also trade at reasonable valuations with current headwinds such as a significant increase in Covid cases in China following relaxation of the zero-covid policy already priced in. The more tolerant Covid policy in China has already had a positive impact on investor sentiment in the region. The region also offers upside in contrarian central bank policy with inflation remaining subdued, which ought to be supportive of equities. The managers retain an overweight position in Asia Pacific and Emerging Market equities.
The key strategic themes can be summarised below:
We have entered a period of “Great Normalisation”, during which market participants are likely to experience further volatility before markets stabilise and prepare for the next stage of growth. There has already been significant capital destruction across several asset classes. Approximately £350billion fall in the value of long bonds and significant falls in excess of 60% in ‘trendy’ assets such as cryptocurrencies (Bitcoin is down c.64.2%), and investor darling growth stocks such as Tesla and Meta which are both down in excess of 50%. Many other assets have seen a temporary loss in value; however, these are unlikely to be permanent.
In the Committee’s view, central banks are likely to shift from the previous inflation target of 2% to a higher figure or a floating range, which is most likely to be around 3-4%. The amount of economic destruction required to bring inflation back to a 2% target would be too great to be justifiable. Coupled with multiple developed economies (US and Europe) trying to ease the reliance on supply chains from China, inflation is likely to be stickier, although much lower than current levels, than initially thought.
Continuing to hold a globally diversified portfolio of high-quality assets is important to protect and grow the value of savings over the long term and remains the appropriate method for allocation of investor capital. Cash is unattractive as inflationary pressures look to be structurally long term.
Keith W Thompson
Clarion Group Chairman
January 2023
Creating better lives now and in the future for our clients, their families and those who are important to them.
The chart below shows the historical performance of the Defender Portfolio against a relevant benchmark since the start of the available data.
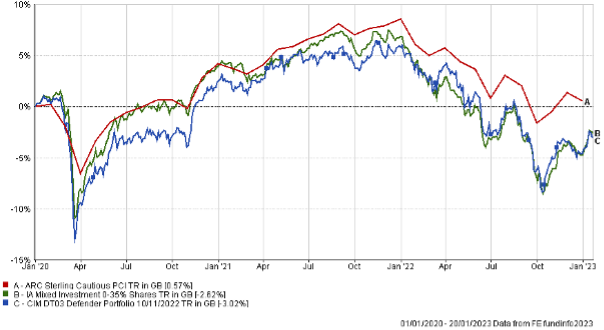
The table below shows the annualised performance to the last quarter end:
| 30/12/21 30/12/20
to to 30/12/22 30/12/21 |
|
| CIM DT03 Defender Portfolio | -9.82% 3.69% |
| ARC Sterling Cautious PCI | -7.39% 4.23% |
| IA Mixed Investment 0-35% Shares | -10.87% 2.84% |
The chart below shows the historical performance of the Prudence Portfolio against a relevant benchmark since the start of the available data.
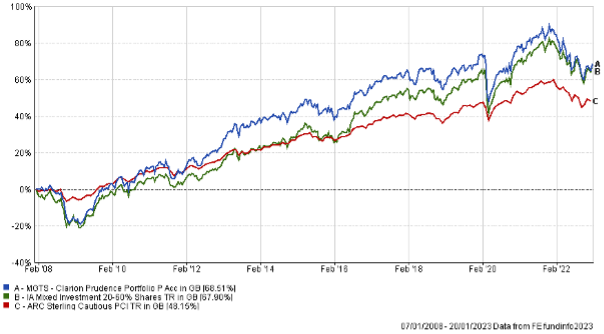
The table below shows the annualised performance to the last quarter end:
| 30/12/21 to 30/12/22 | 30/12/20 to 30/12/21 | 30/12/19 to 30/12/20 | 30/12/18 to 30/12/19 | 30/12/17 to 30/12/18 | |
| MGTS Clarion Prudence P Acc | -11.99% | 5.61% | 2.13% | 12.50% | -5.90% |
| CIM DT04 Prudence Portfolio | -11.87% | 6.28% | 3.05% | 12.13% | -5.23% |
| ARC Sterling Cautious PCI | -7.39% | 4.23% | 4.20% | 8.05% | -3.63% |
| IA Mixed Investment 20-60% Shares | -9.47% | 7.20% | 3.51% | 11.84% | -5.10% |
The chart below shows the historical performance of the Navigator Portfolio against a relevant benchmark since the start of the available data.
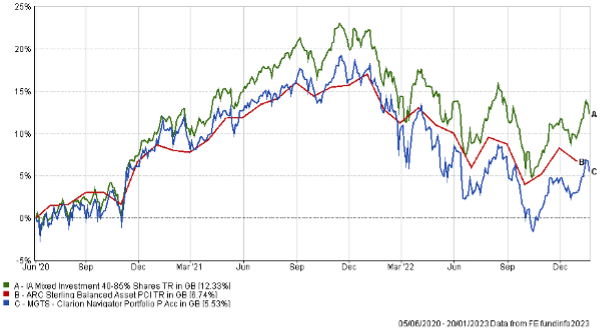
The table below shows the annualised performance to the last quarter end:
| 30/12/21
to 30/12/22 |
30/12/20
to 30/12/21 |
|
| MGTS Clarion Navigator P Acc | -12.36% | 7.59% |
| CIM DT05 Navigator Portfolio | -11.74% | 8.22% |
| IA Mixed Investment 40-85% Shares | -10.04% | 10.94% |
ARC Sterling Balanced Asset PCI -8.75% 7.64%
The chart below shows the historical performance of the Meridian Portfolio against a relevant benchmark since the start of the available data.
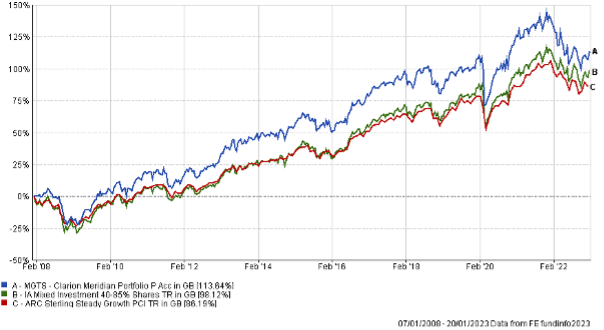
The table below shows the annualised performance to the last quarter end:
| 30/12/21 to 30/12/22 | 30/12/20 to 30/12/21 | 30/12/19 to 30/12/20 | 30/12/18 to 30/12/19 | 30/12/17 to 30/12/18 | |
| MGTS Clarion Meridian P Acc | -13.24% | 8.25% | 6.15% | 15.51% | -7.84% |
| CIM DT06 Meridian Portfolio | -12.58% | 9.02% | 7.39% | 15.67% | -6.89% |
| ARC Steady Growth PCI | -9.76% | 10.24% | 4.56% | 15.00% | -5.64% |
| IA Mixed Investment 40-85% Shares | -10.04% | 10.94% | 5.32% | 15.78% | -6.11% |
The chart below shows the historical performance of the Explorer Portfolio against a relevant benchmark since the start of the available data.
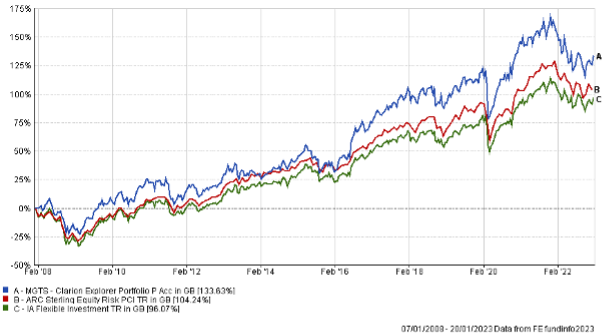
The table below shows the annualised performance to the last quarter end:
| 30/12/21 to 30/12/22 | 30/12/20 to 30/12/21 | 30/12/19 to 30/12/20 | 30/12/18 to 30/12/19 | 30/12/17 to 30/12/18 | |
| MGTS Clarion Explorer P Acc | -13.16% | 8.91% | 9.12% | 16.94% | -6.41% |
| CIM DT07 Explorer Portfolio | -12.90% | 9.72% | 9.83% | 16.31% | -5.61% |
| ARC Equity Risk PCI | -10.86% | 12.31% | 5.82% | 18.04% | -6.50% |
| IA Flexible Investment | -8.98% | 11.30% | 6.70% | 15.66% | -6.72% |
The chart below shows the historical performance of the Voyager Portfolio against a relevant benchmark since the start of the available data.
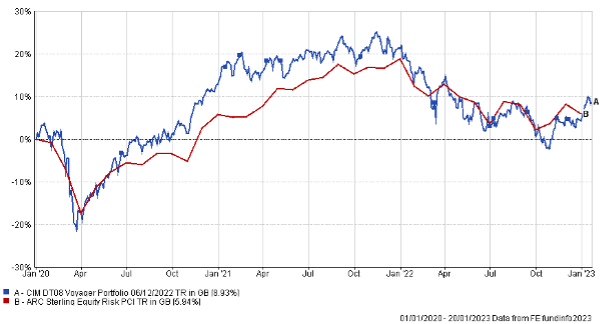
The table below shows the annualised performance to the last quarter end:
| 30/12/21
to 30/12/22 |
30/12/20
to 30/12/21 |
|||||
| CIM DT08 Voyager Portfolio | -13.99% | 7.66% | ||||
| ARC Equity Risk PCI | -10.86% | 12.31% |
The chart below shows the historical performance of the Adventurer Portfolio against a relevant benchmark since the start of the available data.
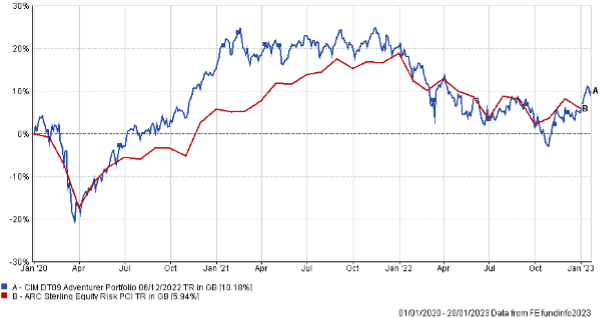
The table below shows the annualised performance to the last quarter end:
| 30/12/21
to 30/12/22 |
30/12/20
to 30/12/21 |
||||
| CIM DT09 Adventurer Portfolio | -12.88% | 4.43% | |||
| ARC Equity Risk PCI | -10.86% | 12.31% |
The chart below shows the historical performance of the Pioneer Portfolio against a relevant benchmark since the start of the available data.
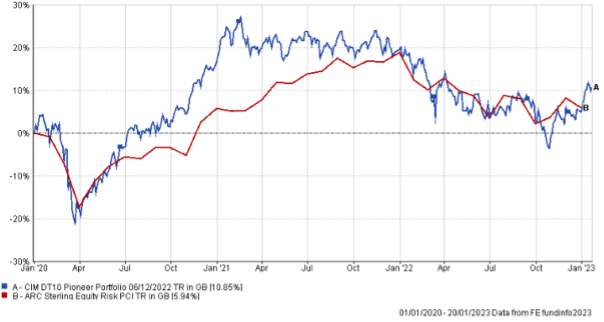
The table below shows the annualised performance to the last quarter end:
| 30/12/21
to 30/12/22 |
30/12/20
to 30/12/21 |
||||
| CIM DT10 Pioneer Portfolio | -12.20% | 2.66% | |||
| ARC Equity Risk PCI | -10.86% | 12.31% |
The content of this article does not constitute financial advice and you may wish to seek professional advice based on your individual circumstances before making any financial decisions.
Any investment performance figures referred to relate to past performance which is not a reliable indicator of future results and should not be the sole factor of consideration when selecting a product or strategy. The value of investments, and the income arising from them, can go down as well as up and is not guaranteed, which means that you may not get back what you invested. Unless indicated otherwise, performance figures are stated in British Pounds. Where performance figures are stated in other currencies, changes in exchange rates may also cause an investment to fluctuate in value.
If you’d like more information about this article, or any other aspect of our true lifelong financial planning, we’d be happy to hear from you. Please call +44 (0)1625 466 360 or email [email protected].
Click here to sign-up to The Clarion for regular updates.