True lifelong financial planning for the serious business of life.
True lifelong financial planning
for the serious business of life.
True lifelong financial planning for the serious business of life.
True lifelong financial planning
for the serious business of life.
Tags: Adventurer Portfolio, Defender Portfolio, Discretionary Investment Management, Explorer Portfolio, funds, investment, Meridian Portfolio, MGTS Clarion Explorer, MGTS Clarion Meridian, MGTS Clarion Prudence, MTGS Clarion Navigator, Navigator Portfolio, Pioneer Portfolio, Prudence Portfolio, Voyager Portfolio
Category:
Investment management
The Clarion Investment Committee met on Thursday 14th July. The following notes summarise the main points of consideration in the investment Committee discussions.
The US economy added a much-greater-than-expected 372,000 jobs in June while the unemployment rate held steady at 3.6%. Bond yields rose on the news as investors judged that this strengthened the case for the Fed to tighten policy.
Inflation in the US hit 9.1% over the last year – a bigger rise than expected – driven by an increase in prices across the board alongside a 41.6% rise in energy prices.
Supply chain pressure, as measured by the US Federal Reserve Bank of New York’s Supply Chain Pressure Index, dropped to its lowest level in over a year, in part due to the lifting of lockdowns in China.
The Bank of England warned of a deterioration in the global economic outlook and that “in some markets, asset valuations appear elevated relative to historical norms” but said that the financial sector “remained resilient”.
UK GDP rose 0.5% in May, over the previous month, beating expectations of a slowdown; the boost came from higher-than-expected demand for holidays and healthcare.
Official estimates show that UK manufacturing output rose by 2.3% in the last 12 months beating economists’ expectations
UK train drivers voted to strike nationwide over pay, marking the first coordinated industrial action by them in 27 years.
The price of crude oil fell last week to levels last seen before Russia’s invasion of Ukraine, pushed lower by the weakest oil demand since 1996 as recession risks rise across the globe.
Germany recorded a trade deficit in goods in May for the first time in 30 years as its exports were hampered by supply chain disruption and spending on energy imports surged.
A survey of Japanese businesses by Nikkei found that 56% think that risk of operating in China has risen, businesses cited the zero-COVID policy, US-China tensions and the risk of China invading Taiwan as risks to doing business.
UK house price growth hit an 18-year high of 13% in the year to June, according to estimates from the Halifax.
The pound continued its fall against the US dollar dropping to $1.18 on Friday, its lowest level since March 2020.
The euro hit parity with the dollar as European recession fears grew and investors bet on a further weakening of the single currency.
The yen fell to its lowest level against the dollar in 24 years, as the Fed is expected to tighten monetary policy even further, while the Bank of Japan maintains its ultra-loose stance.
China recorded the slowest quarterly rise in GDP since the start of the pandemic, with its economy expanding by just 0.4% in the second quarter.
Police in the Sri Lankan capital of Colombo imposed a curfew in advance of planned protests. Protestors are angry over the economic crisis engulfing the country – a shortage of foreign exchange has led to a shortage of fuel, food and medicine.
Bonds have rallied over fears of potential recession and economic slowdown. Long-dated bonds still appear to be poor value in which to allocate capital, with the risks outweighing the reward at current yields. Should these continue to rise, which appears likely in western bond markets with quantitative tightening underway, this risk/reward ratio will shift further towards consideration from the Investment Committee. At present, the Clarion portfolios continue with a short-dated bias in fixed income given the likely rising yield environment, which ought to result in relative outperformance.
US equities continue to trade close to yearly lows having fallen substantially since the turn of the year. The growth stocks at the top of the major indices have been worst hit by interest rate rises which have adversely impacted stocks trading on elevated P/E ratios. Despite these falls, these ratios are still above long-term historical averages, which indicates further potential drawdown is yet possible.
The UK has seen relative outperformance in the value rotation amid tightening financial conditions and still trades at a discount to peer developed equity regions. Many companies continue to be penalised for their choice of listing location, despite increasingly deriving earnings from overseas, with the FTSE 100 recording 79% and the FTSE 250 60%, of revenues from outside the UK according to JPM’s latest guide to the markets. The Investment Committee remain broadly positive on the prospects for the UK markets.
Asia Pacific equities trade at attractive valuations following a challenging 2021, particularly in the technology sector, where the disparity with US technology equities is wide. Macroeconomic conditions remain tough in the region at present, but valuations ought to be supported by loose central bank policy from the People’s Bank of China (PBoC) and Bank of Japan (BoJ) in contrast to current western central bank policy. In Japan, the yen is trading at its lowest level since the Asian Crisis, which offers an attractive entry point for equities that benefit from a strengthening of the currency from this point. Over the long-term, the investment thesis in the region is attractive.
Continuing to hold diversified high-quality assets over the longer term remains the appropriate method for allocation of investor capital.
For a fuller version of Clarion’s Economic and Stock Market Commentary, written by Clarion Group Chairman Keith Thompson, please click here
Each year, we undertake a review of our portfolios to ascertain whether our strategic asset allocation (SAA) is appropriate. This is the neutral position of the portfolios to ensure that they are appropriate for a given level of risk on the risk/reward scale. On top of this, we then apply what is known as a tactical overlay which results in the investment committee (IC) either going underweight or overweight against the SAA to take account of the current economic conditions.
This month, however, we have undertaken a more in-depth ‘root and branch’ review of the portfolios and the SAA because of the extreme economic conditions we are currently seeing. As part of this process, we have been working with a firm (whom we have an existing relationship with) called Dynamic Planner to review the SAA.
Dynamic Planner specialises in risk management, asset allocation and fund research and we already utilise a lot of their work in our processes. For example, we use their risk profiling tool and their investment growth assumptions for cashflow modelling.
The biggest change following our recent review is that, in future, we are going to more closely follow Dynamic Planner’s strategic asset allocations.
Additionally, the IC has decided to begin using Exchange Traded Funds (ETFs) within the portfolios in future. The use of ETFs will help to significantly reduce costs whilst allowing access to a much wider and diverse range of investments.
The change to the SAAs and the increased use of ETFs have led to higher-than-normal trading activity this month. However, this is a rare event and trading activity levels will revert to normal in future months.
The chart below shows the historical performance of the portfolio against a relevant benchmark since the start of the available data.
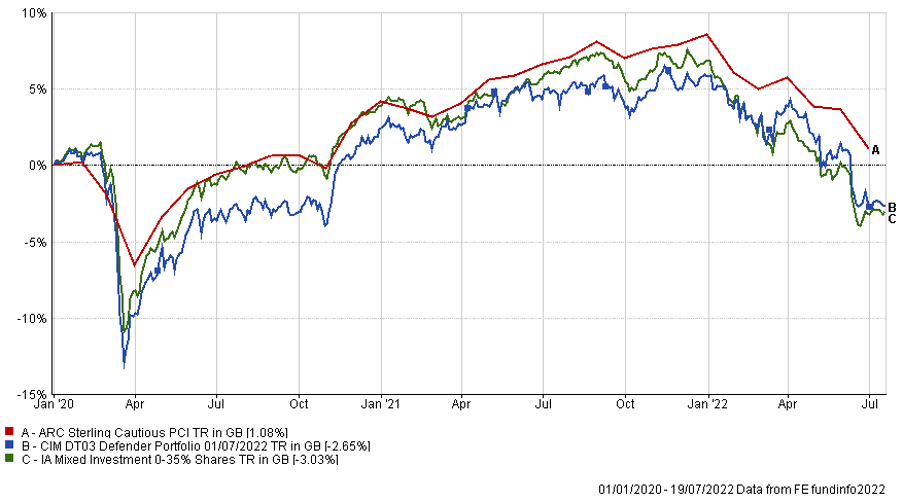
The table below shows the annualised performance to the last quarter end:
| 30/06/21 30/06/20
to to 30/06/22 30/06/21 |
|
| CIM DT03 Defender Portfolio | -6.88% 7.80% |
| ARC Sterling Cautious PCI | -5.21% 7.25% |
| IA Mixed Investment 0-35% Shares | -8.57% 6.86% |
Funds Sold from the Defender Portfolio
Funds Added to the Defender Portfolio
Changes to Fund Allocation in the Defender Portfolio
The chart below shows the historical performance of the portfolio against a relevant benchmark(s) since the start of the available data.
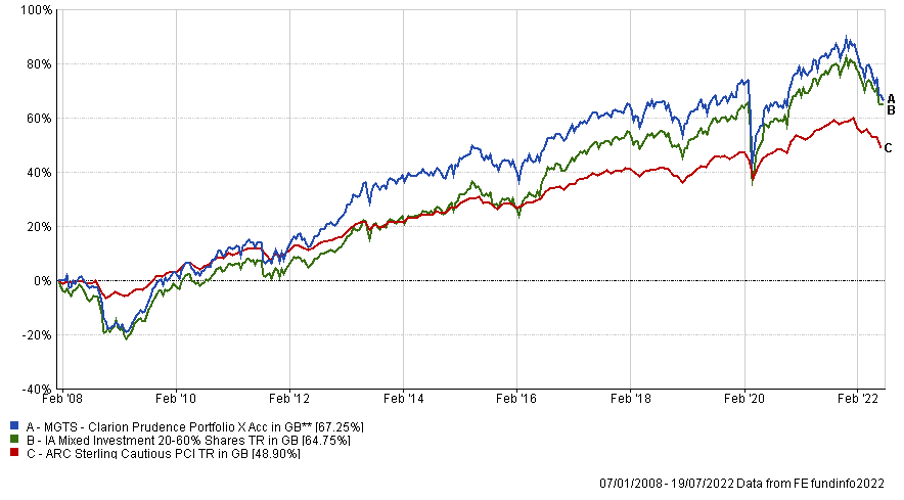
The table below shows the annualised performance to the last quarter end:
| 30/06/21 to 30/06/22 | 30/06/20 to 30/06/21 | 30/06/19 to 30/06/20 | 30/06/18 to 30/06/19 | 30/06/17 to 30/06/18 | |
| MGTS Clarion Prudence X Acc | -8.97% | 12.32% | -1.60% | 0.69% | 2.35% |
| CIM DT04 Prudence Portfolio | -9.06% | 12.26% | -1.27% | 1.43% | 3.56% |
| ARC Sterling Cautious PCI | -5.21% | 7.25% | 1.66% | 2.37% | 1.41% |
| IA Mixed Investment 20-60% Shares | -7.09% | 12.74% | -0.63% | 2.89% | 2.44% |
Funds Sold from the Prudence Portfolio
Funds Added to the Prudence Portfolio
Changes to Fund Allocation in the Prudence Portfolio
The chart below shows the historical performance of the portfolio against a relevant benchmark(s) since the start of the available data.
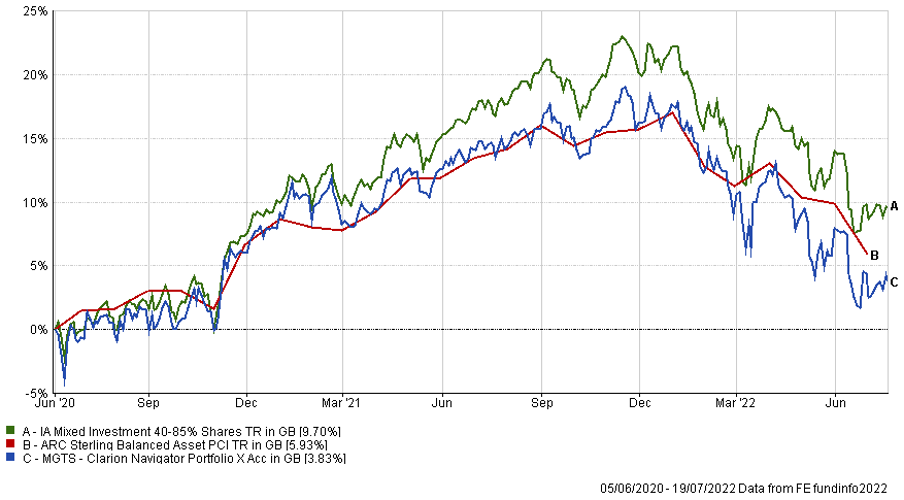
The table below shows the annualised performance to the last quarter end:
| 30/06/21
to 30/06/22 |
30/06/20
to 30/06/21 |
|
| MGTS Clarion Navigator X Acc | -9.53% | 15.12% |
| CIM DT05 Navigator Portfolio | -10.01% | 16.14% |
| IA Mixed Investment 40-85% Shares | -7.16% | 17.29% |
ARC Sterling Balanced Asset PCI -6.63% 11.84%
Funds Sold from the Navigator Portfolio
Funds Added to the Navigator Portfolio
Changes to Fund Allocation in the Navigator Portfolio
The chart below shows the historical performance of the portfolio against a relevant benchmark(s) since the start of the available data.
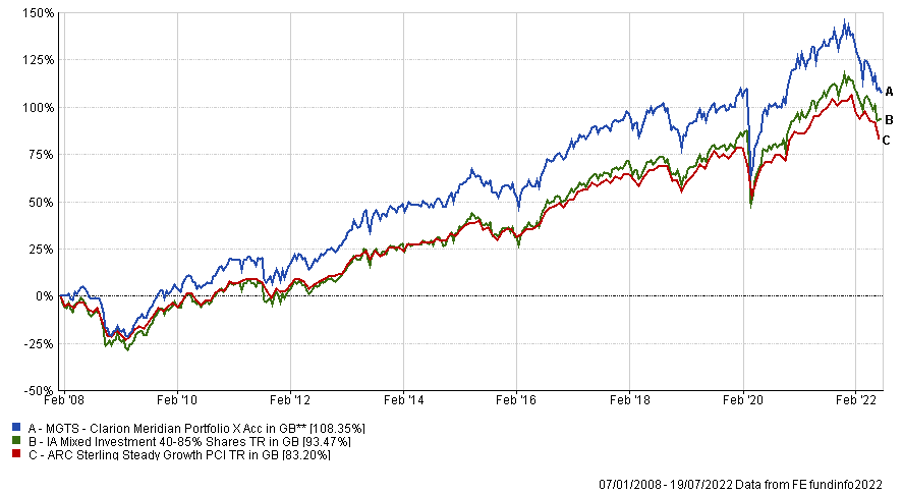
The table below shows the annualised performance to the last quarter end:
| 30/06/21 to 30/06/22 | 30/06/20 to 30/06/21 | 30/06/19 to 30/06/20 | 30/06/18 to 30/06/19 | 30/06/17 to 30/06/18 | |
| MGTS Clarion Meridian X Acc | -11.58% | 19.62% | -0.98% | 0.73% | 5.00% |
| CIM DT06 Meridian Portfolio | -12.00% | 19.73% | -0.51% | 3.26% | 5.36% |
| ARC Steady Growth PCI | -7.67%% | 15.87% | -0.51% | 3.54% | 4.92% |
| IA Mixed Investment 40-85% Shares | -7.16% | 17.29% | -0.11% | 3.62% | 4.85% |
Funds Sold from the Meridian Portfolio
Funds Added to the Meridian Portfolio
Changes to Fund Allocation in the Meridian Portfolio
The chart below shows the historical performance of the portfolio against a relevant benchmark(s) since the start of the available data.
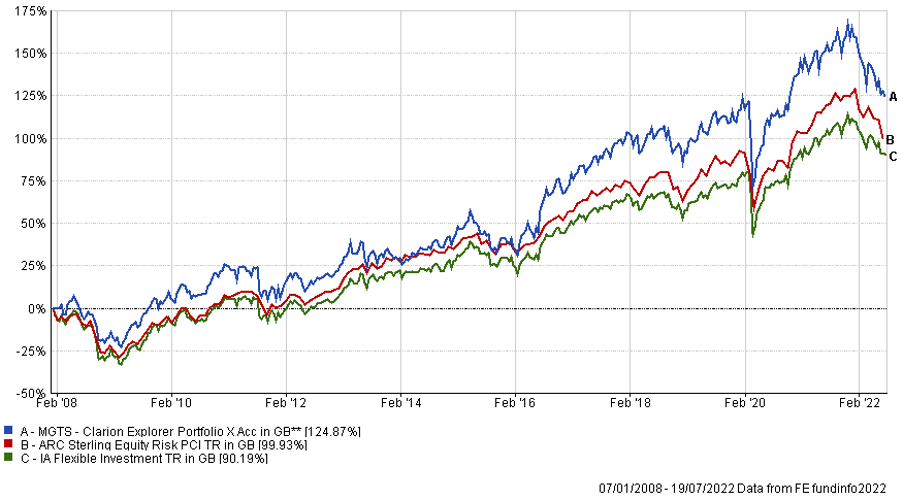
The table below shows the annualised performance to the last quarter end:
| 30/06/21 to 30/06/22 | 30/06/20 to 30/06/21 | 30/06/19 to 30/06/20 | 30/06/18 to 30/06/19 | 30/06/17 to 30/06/18 | |
| MGTS Clarion Explorer X Acc | -11.98% | 22.72% | -1.22% | 5.33% | 6.96% |
| CIM DT07 Explorer Portfolio | -12.73% | 22.46% | -1.09% | 5.69% | 8.60 |
| ARC Equity Risk PCI | -8.92% | 20.57% | -1.13% | 4.02% | 6.36% |
| IA Flexible Investment | -7.09% | 19.48% | 0.31% | 2.95% | 5.04% |
Funds Sold from the Explorer Portfolio
Funds Added to the Explorer Portfolio
Changes to Fund Allocation in the Explorer Portfolio
The chart below shows the historical performance of the portfolio against a relevant benchmark(s) since the start of the available data.
The table below shows the annualised performance to the last quarter end:
| 30/06/21
to 30/06/22 |
30/06/20
to 30/06/21 |
|||||
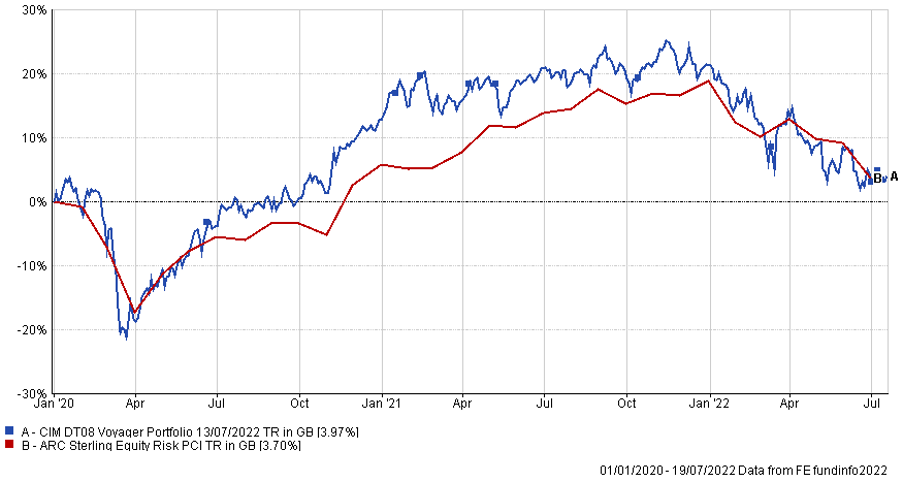
| CIM DT08 Voyager Portfolio | -14.46% | 24.81% | ||||
| ARC Equity Risk PCI | -8.92% | 20.57% |
Funds Sold from the Voyager Portfolio
Funds Added to the Voyager Portfolio
Changes to Fund Allocation in the Voyager Portfolio
The chart below shows the historical performance of the portfolio against a relevant benchmark(s) since the start of the available data.
The table below shows the annualised performance to the last quarter end:
| 30/06/21
to 30/06/22 |
30/06/20
to 30/06/21 |
||||
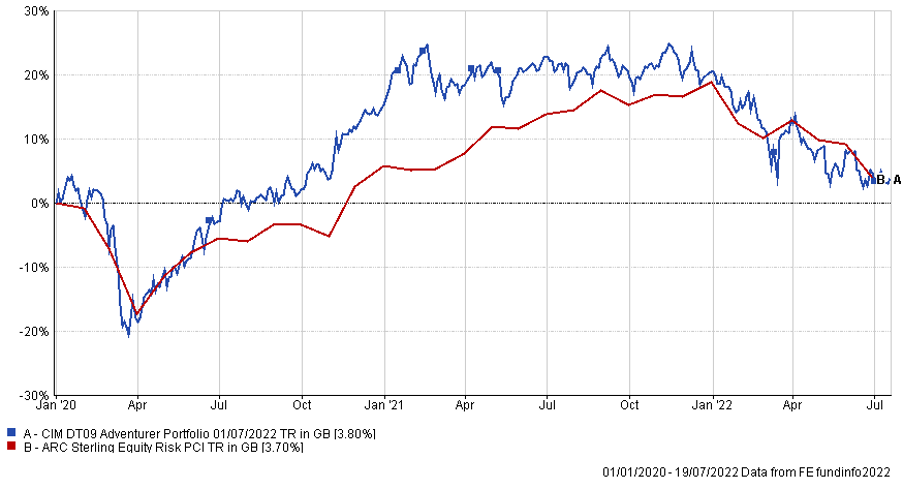
| CIM DT09 Adventurer Portfolio | -15.60% | 25.54% | |||
| ARC Equity Risk PCI | -8.92% | 20.57% |
Funds Sold from the Adventurer Portfolio
Funds Added to the Adventurer Portfolio
Changes to Fund Allocation in the Adventurer Portfolio
The chart below shows the historical performance of the portfolio against a relevant benchmark(s) since the start of the available data
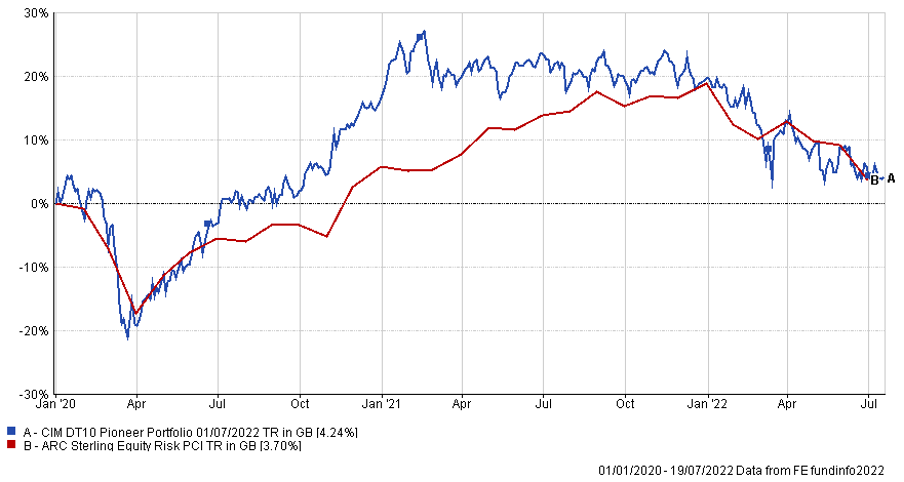
The table below shows the annualised performance to the last quarter end:
| 30/06/21
to 30/06/22 |
30/06/20
to 30/06/21 |
||||
| CIM DT10 Pioneer Portfolio | -15.18% | 26.74% | |||
| ARC Equity Risk PCI | -8.92% | 20.57% |
Funds Sold from the Pioneer Portfolio
Funds Added to the Pioneer Portfolio
Changes to Fund Allocation in the Pioneer Portfolio
The content of this article does not constitute financial advice and you may wish to seek professional advice based on your individual circumstances before making any financial decisions.
Any investment performance figures referred to relate to past performance which is not a reliable indicator of future results and should not be the sole factor of consideration when selecting a product or strategy. The value of investments, and the income arising from them, can go down as well as up and is not guaranteed, which means that you may not get back what you invested. Unless indicated otherwise, performance figures are stated in British Pounds. Where performance figures are stated in other currencies, changes in exchange rates may also cause an investment to fluctuate in value.
If you’d like more information about this article, or any other aspect of our true lifelong financial planning, we’d be happy to hear from you. Please call +44 (0)1625 466 360 or email [email protected].
Click here to sign-up to The Clarion for regular updates.