Tags: Adventurer Portfolio, Defender Portfolio, Discretionary Investment Management, Explorer Portfolio, funds, investment, Meridian Portfolio, MGTS Clarion Explorer, MGTS Clarion Meridian, MGTS Clarion Prudence, MTGS Clarion Navigator, Navigator Portfolio, Pioneer Portfolio, Prudence Portfolio, Voyager Portfolio
Category:
Investment management
The Clarion Investment Committee met on the 13th of July 2023. The following notes summarise the main points of consideration in the Investment Committee discussions but have been updated to include commentary on recent events and the wider implications for financial markets.
To access Clarion’s Economic and Stock Market Commentary, written by Clarion Group Chairman Keith Thompson, please click here
China’s economic growth has not met expectations, underscored by troubling indicators: a decline in property sales, a notable drop of 12.4% in year-on-year exports in June, and an unresponsive retail sector. Despite these figures exceeding the forecasts of some of the more bearish economists, the lacklustre results are far from the robust post-COVID rebound many anticipated. This trend underscores the profound impact of the pandemic on China’s economic landscape. Particularly troubling is the youth unemployment figure, persistently hovering over 20% for consecutive months — a rate akin to that of Italy.
Amid these challenges, China’s recorded growth rate stood at 6.3%, falling short of the 7+% that analysts had projected. This backdrop has fuelled speculation that Beijing will intensify its support to stimulate the economy, especially given the stuttering post-COVID recovery. While experts believe that increased government spending might bolster key sectors, it is not viewed as the ultimate solution. Policymakers, in a departure from global trends, find themselves not having to fight inflation but potentially grappling with deflation, resulting from tepid demand.
An unfortunate period has beset the Ukraine war. The US marked a historical approach by sending cluster munition, weapons deemed barbaric by international humanitarian law, signed by over 100 countries. The US argument for their use being that they are cheaper than conventional weapons and have now formed an important part of US war strategy.
Further to the above, Russia has withdrawn from the Ukraine grain deal, leading many to fear an inflationary spike as Ukraine has traditionally been a mass exporter of grain. This could drive up global food prices. Russia claims the conditions of the deal have not been met by the West, stating that continuing sanctions on individuals and the state agricultural bank has led Russian exports to drop significantly. The predominant driver for increasing food costs would likely be caused by insurance companies charging “war risk insurance” on commercial shipping vessels.
The investment committee have been reviewing the duration of the portfolios and are investigating an increase to the underlying duration of the strategies if inflation continues to provide an opportunity for greater capital appreciation at the longer end of the yield curve.
The investment committee continue to favour the UK over the US on a valuation basis. The US equity market is still highly distorted, with a few large-cap technology companies driving the performance of US equity indices. The UK equity market, on the other hand, has a much broader base and should be more resilient to a high-interest rate environment due to its higher exposure to dividend-paying companies and companies in sectors that can remain profitable in the current macroeconomic environment.
The relative market valuations also continue to act as a guiding light for the weighting of the portfolio funds with regards to the UK and US. The average price to earnings in the US being above historical averages and the UK being below historical averages. While the investment committee continue to foresee potential short-term rallies within US equities, the expectation is that the region will underperform the UK over the medium term.
The Committee are of the view that the Asia Pacific region and Emerging Markets are likely to perform ahead of their developed market counterparts over the medium term (around 3-5 years). However, there continue to be headwinds in the region that are limiting the effect of the post-COVID recovery in China as outlined above. One of the driving factors of this expected China recovery is current price to earnings ratio being around 10, with a historical high of around 34, suggesting a that significant re-rating is possible.
The key themes are as follows:
In the Committee’s view central banks are likely to shift from the previous inflation target of 2% to a higher figure or a floating range, which will most likely be around 3-4%. The amount of economic destruction required to bring inflation back to a 2% target would be too great to be justifiable. Coupled with multiple developed economies (US and Europe) trying to ease the reliance on supply chains from China, inflation is likely to be stickier, although much lower than current levels, than initially thought.
Continuing to hold a globally diversified portfolio of high-quality assets is important to provide resilience and grow the value of savings over the long term and remains the appropriate method for allocation of investor capital. Cash is unattractive as inflationary pressures, although moderating, look to be structurally long-term.
Keith W Thompson
Clarion Group Chairman
July 2023
Creating better lives now and in the future for our clients, their families and those who are important to them.
The chart below shows the historical performance of the Defender Portfolio against a relevant benchmark since the start of the available data.
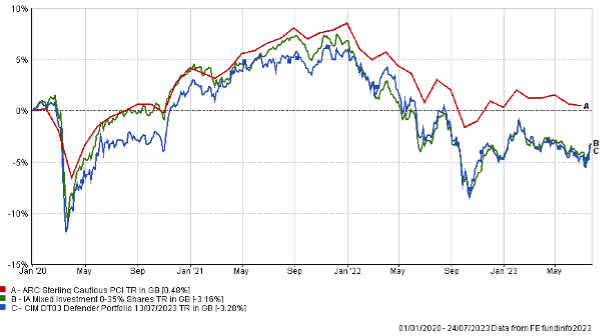
The table below shows the annualised performance to the last quarter end:
| 30/06/2022
to 30/06/2023 |
30/06/21
to 30/06/22 |
30/06/20
to 30/06/21 |
|
| CIM DT03 Defender Portfolio | -1.71% | -6.88% | 7.80% |
| ARC Sterling Cautious PCI | -0.33% | -5.46% | 7.25% |
| IA Mixed Investment 0-35% Shares | -0.85% | -8.57% | 6.86% |
The chart below shows the historical performance of the Prudence Portfolio against a relevant benchmark since the start of the available data.
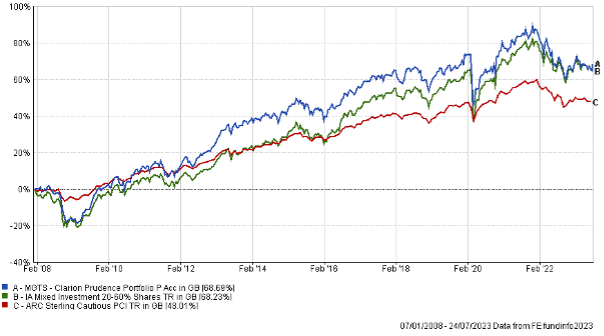
The table below shows the annualised performance to the last quarter end:
| 30/06/22 to 30/06/23 | 30/06/21 to 30/06/22 | 30/06/20 to 30/06/21 | 30/06/19 to 30/06/20 | 30/06/18 to 30/06/19 | |
| MGTS Clarion Prudence P Acc | -0.79% | -8.89% | 12.39% | -1.58% | 0.69% |
| CIM DT04 Prudence Portfolio | -0.14% | -9.06% | 12.26% | -1.27% | 1.43% |
| ARC Sterling Cautious PCI | -0.33% | -5.46% | 7.25% | 1.66% | 2.37% |
| IA Mixed Investment 20-60% Shares | 1.18% | -7.09% | 12.74% | -0.63% | 2.89% |
The chart below shows the historical performance of the Navigator Portfolio against a relevant benchmark since the start of the available data.
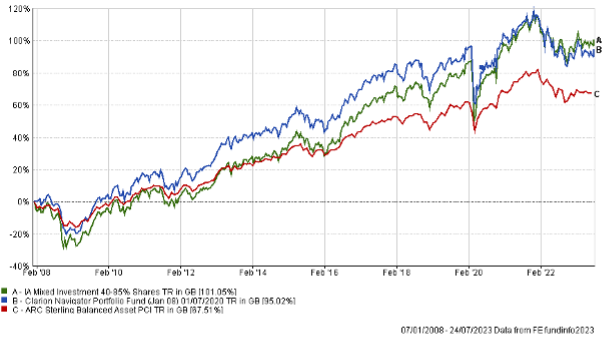
The table below shows the annualised performance to the last quarter end:
| 30/06/22
to 30/06/23 |
30/06/21
to 30/06/22 |
30/06/20
to 30/06/21 |
30/06/19 to 30/06/20 | 30/06/18 to 30/06/19 | ||
| MGTS Clarion Navigator P Acc | 0.45% | -9.44% | 15.23% | |||
| CIM DT05 Navigator Portfolio | 0.45% | -9.44% | 15.23% | -2.21% | 1.21% | |
| ARC Sterling Balanced Asset PCI | 1.49% | -6.54% | 11.84% | 0.50% | 2.74% | |
| IA Mixed Investment 40-85% Shares | 3.25% | -7.16% | 17.29% | -0.11% | 3.62% | |
The chart below shows the historical performance of the Meridian Portfolio against a relevant benchmark since the start of the available data.
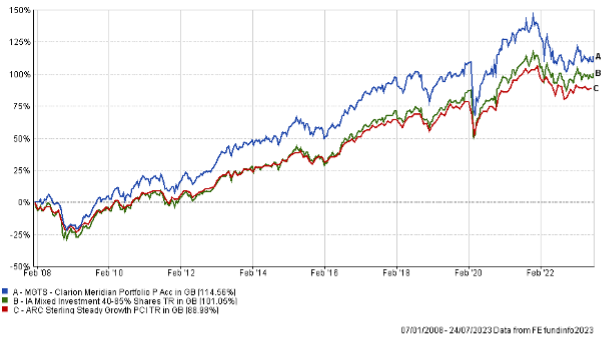
The table below shows the annualised performance to the last quarter end:
| 30/06/22
to 30/06/23 |
30/06/21
to 30/06/22 |
30/06/20
to 30/06/21 |
30/06/19
to 30/06/20 |
30/06/18 to 30/06/19 | |
| MGTS Clarion Meridian P Acc | 1.13% | -11.49% | 19.74% | -0.98% | 0.73% |
| CIM DT06 Meridian Portfolio | 2.98% | -12.00% | 19.73% | -0.51% | 3.26% |
| ARC Steady Growth PCI | 3.01% | -7.54% | 15.87% | -0.51% | 3.54% |
| IA Mixed Investment 40-85% Shares | 3.25% | -7.16% | 17.29% | -0.11% | 3.62% |
The chart below shows the historical performance of the Explorer Portfolio against a relevant benchmark since the start of the available data.
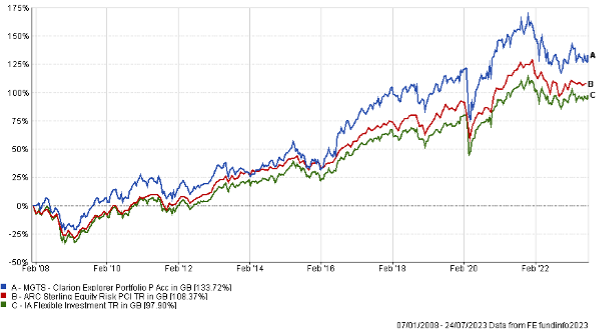
The table below shows the annualised performance to the last quarter end:
| 30/06/22
to 30/06/23 |
30/06/21
to 30/06/22 |
30/06/20
to 30/06/21 |
30/06/19
to 30/06/20 |
30/06/18
to 30/06/19 |
|
| MGTS Clarion Explorer P Acc | 1.55% | -11.89% | 22.85% | -1.20% | 5.33% |
| CIM DT07 Explorer Portfolio | 3.36% | -12.73% | 22.46% | -1.09% | 5.69% |
| ARC Equity Risk PCI | 4.43% | -9.09% | 20.57% | -1.13% | 4.02% |
| IA Flexible Investment | 3.29% | -7.09% | 19.48% | 0.31% | 2.95% |
The chart below shows the historical performance of the Voyager Portfolio against a relevant benchmark since the start of the available data.
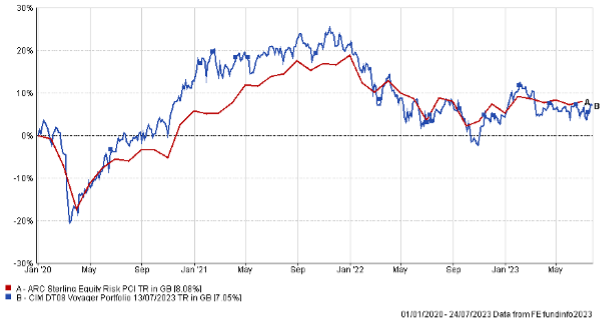
The table below shows the annualised performance to the last quarter end:
| 30/06/22
to 30/06/23 |
30/06/21
to 30/06/22 |
30/06/20
to 30/06/21 |
|
| CIM DT08 Voyager Portfolio | 2.26% | -14.46% | 24.81% |
| ARC Equity Risk PCI | 4.43% | -9.09% | 20.57% |
The chart below shows the historical performance of the Adventurer Portfolio against a relevant benchmark since the start of the available data.
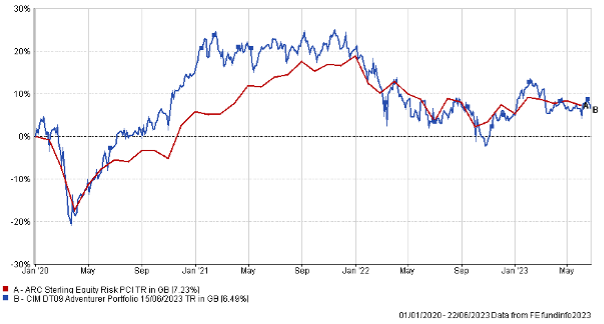
The table below shows the annualised performance to the last quarter end:
| 30/06/22
to 30/06/23 |
30/06/21
to 30/06/22 |
30/03/20
to 30/06/21 |
|||
| CIM DT09 Adventurer Portfolio | 3.14% | -15.60% | 25.54% | ||
| ARC Equity Risk PCI | 4.43% | -9.09% | 20.57% |
The chart below shows the historical performance of the Pioneer Portfolio against a relevant benchmark since the start of the available data.
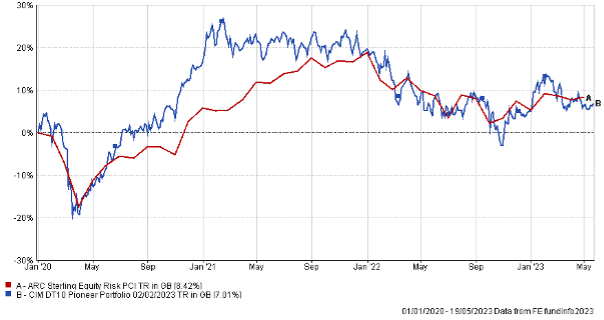
The table below shows the annualised performance to the last quarter end:
| 30/06/22
to 30/06/23 |
30/06/21
to 30/06/22 |
30/06/20
to 30/06/21 |
|||
| CIM DT10 Pioneer Portfolio | 2.34% | -15.18% | 26.74% | ||
| ARC Equity Risk PCI | 4.43% | -9.09% | 20.57% |
Any investment performance figures referred to relate to past performance which is not a reliable indicator of future results and should not be the sole factor of consideration when selecting a product or strategy. The value of investments, and the income arising from them, can go down as well as up and is not guaranteed, which means that you may not get back what you invested. Unless indicated otherwise, performance figures are stated in British Pounds. Where performance figures are stated in other currencies, changes in exchange rates may also cause an investment to fluctuate in value.
The content of this article does not constitute financial advice and you may wish to seek professional advice based on your individual circumstances before making any financial decisions.
If you’d like more information about this article, or any other aspect of our true lifelong financial planning, we’d be happy to hear from you. Please call +44 (0)1625 466 360 or email [email protected].
Click here to sign-up to The Clarion for regular updates.