True lifelong financial planning for the serious business of life.
True lifelong financial planning
for the serious business of life.
True lifelong financial planning for the serious business of life.
True lifelong financial planning
for the serious business of life.
Minutes of the Clarion Investment Committee held at 1pm on 11TH June 2021 by video link. Committee Members in attendance:
| Sam Petts (SP) | IC Chairman/Investment Manager |
| Keith Thompson (KWT) | Chairman (Clarion Investment Management) |
| Adam Wareing (AW) | Operations Director & Compliance Director (Clarion Investment Management) |
| Jacob Hartley (JH) | Associate Financial Planner (Clarion Wealth Planning) |
| Dmitry Konev (DK) | Senior Analyst (Margetts Fund Management) |
| Toby Ricketts (TR) | CEO (Margetts Fund Management) / Investment Manager |
| Elizabeth Chapman (EC) | Analyst (Margetts Fund Management) |
Apologies from:
Ron Walker (RW) Managing Director – Clarion Investment Management
Minutes from the previous meeting held on 6th May 2021 were agreed by the Committee as a true and accurate record.
Please click here to access the June Economic and Stock Market Commentary written by Clarion Group Chairman, Keith Thompson.
The following notes summarise the main points discussed by the Investment Committee.
KT questioned how value stocks could be defined, assuming they are cheaper stocks with a higher yield. The generalisation of value and growth can be misleading as they can sometimes offer less potential/return going forward.
TR Defined a value stock as one that has modest but predictable future earnings and a low P/E ratio, as the visibility of the earnings on a value stock must be high. Some more established businesses, such as oil and industrial companies and banks are often treated as value stocks as they have predictable business models and tend to trade on low P/E ratios. Apple is arguably a future value stock as its revenue growth is likely to slow down, just as Microsoft is arguably a utility business. Many growth stocks will become value stocks.
SP was concerned that Japan was still lagging on its vaccine rollout, as the portfolios are overweight to Japan, and asked the Committee’s view on reducing this allocation.
TR did not view the overweight allocation to Japan as an issue as covid cases in Japan were very low.
KT queried the Committee’s view on increasing exposure to gold within the portfolios.
TR felt that, if cryptoassets were to fall out of favour, gold would be a beneficiary.
SP added that a negative real yield environment also tended to benefit gold prices.
Strategy
Our developed equity positioning is well placed to benefit from economies reopening following successful vaccination rollouts. The UK is biased towards value equities in its major indices, and ought to see a robust rebound from pent-up consumer demand for services.
Our US positioning, with recent additions in US Smaller Companies, also ought to capture the upside from increased domestic spending during the future recovery following fiscal stimulus measures. One of our concerns over the outperformance of US tech stocks has been the possibility of headwinds that would impact earnings multiples. The recent emergence of a taxation blueprint and the possibility of regulation for the wild frontier of technology could have an impact on the earnings of companies such as Facebook, Alphabet and Twitter which could in turn affect their current high valuations.
Emerging Markets have a reasonable bull case in the reflationary trade, as commodities increase in price. Our positioning is tilted away from China and should benefit from the pickup in global trade as economies re-open.
In bonds, our short-dated bias has helped to insulate investors from rising yields, as concerns over inflation weigh on bond prices. The income from these short-dated bond funds remains above inflation, while reducing credit and duration risk.
We expect bond yields to rise further this year, which would acutely affect longer-dated bonds. Duration has crept higher over recent years in bond index trackers, which means their sensitivity to interest rate rises and inflation are increased. The risk of capital loss for bonds that already yield close to zero is all too clear. Our short-dated positioning ought to outperform in this environment.
The Committee reviewed risk reports and confirmed that all Clarion funds have been run in line with expectations. The Committee confirmed that there have been no breaches recorded for any of the funds included in the Clarion range.
The chart below shows the performance of the above fund since inception. The table below that shows the discrete annual performance to the last quarter end.
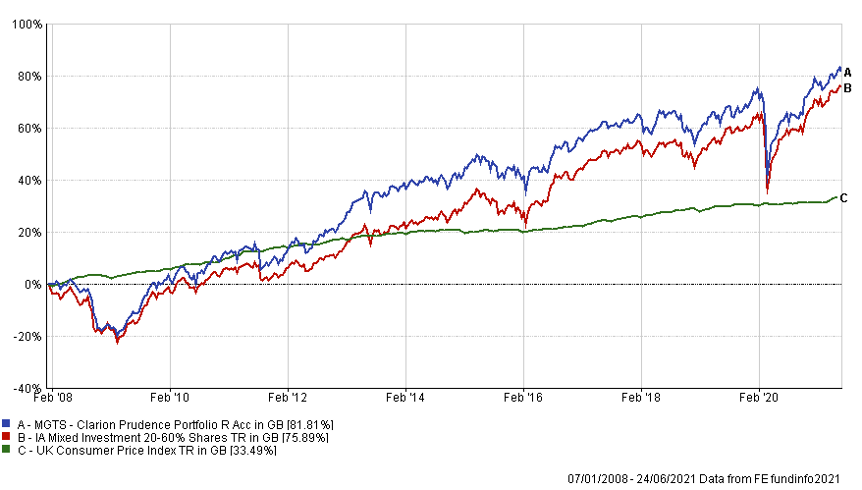
| 31/03/20 to 31/03/21 | 31/03/19 to 31/03/20 | 31/03/18 to 31/03/19 | 31/03/17 to 31/03/18 | 31/03/16 to 31/03/17 | |
| MGTS Clarion Prudence R Acc | 17.96% | -7.89% | 3.87% | -1.24% | 9.59% |
| IA Mixed Investment 20-60% Shares | 19.83% | -7.19% | 2.86% | 0.83% | 12.90% |
Whilst the Navigator fund launched on 11th May 2020, the fund did not receive any cash inflows until 5th June 2020 meaning that no investments were made before this date. You can identify this period as the Navigator fund growth appears flat whilst the sector grew over this period. This gives the impression that the fund lagged the sector when, in fact, the Navigator fund did not participate in any market growth during this period.
However, we also manage a Navigator discretionary portfolio containing almost identical investments to the Navigator fund and this was invested during this period. The chart below compares the performance of this portfolio against both the Navigator fund and the sector since 11th May 2020. The table shows the performance between 11th May 2020 and the end of the previous quarter.
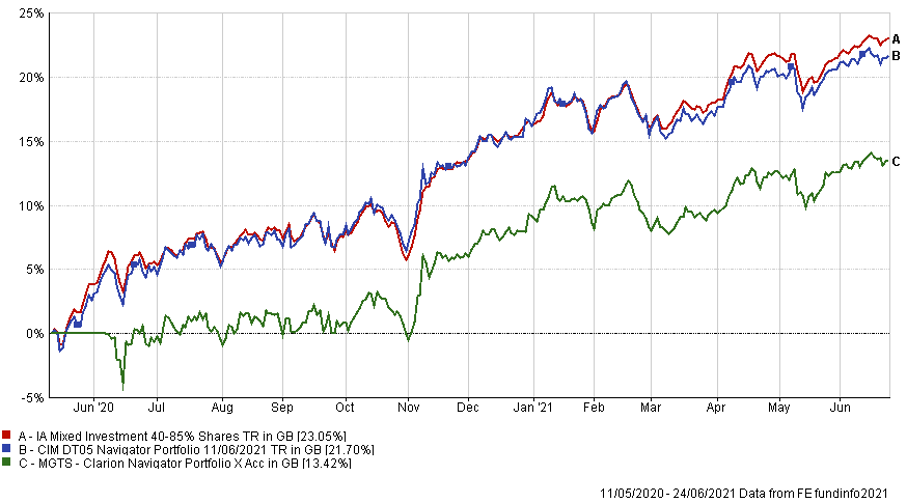
| 11/05/20 to 31/03/21 | |
| MGTS Clarion Navigator X Acc | 9.67% |
| CIM DT05 Navigator Portfolio | 17.02% |
| IA Mixed Investment 40-85% Shares | 17.98% |
The chart below shows the performance of the above fund since inception. The table below that shows the discrete annual performance to the last quarter end.
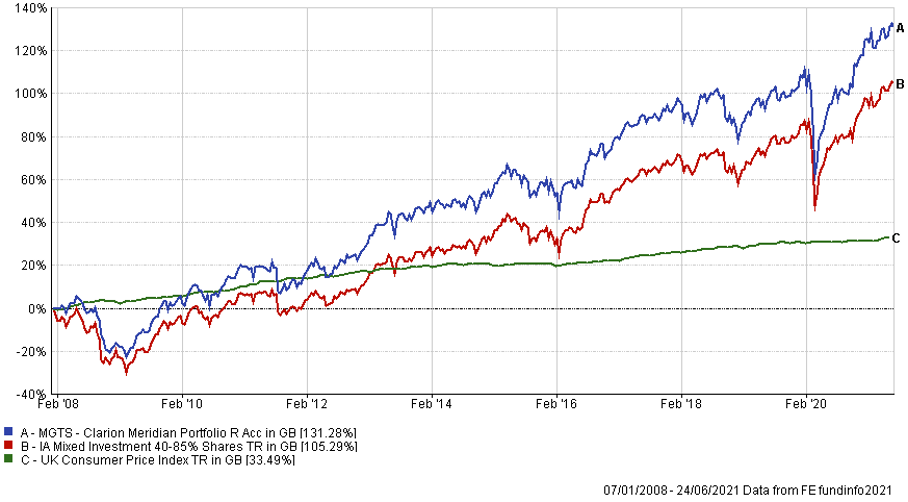
| 31/03/20 to 31/03/21 | 31/03/19 to 31/03/20 | 31/03/18 to 31/03/19 | 31/03/17 to 31/03/18 | 31/03/16 to 31/03/17 | |
| MGTS Clarion Meridian R Acc | 29.63% | -10.01% | 4.27% | -0.40% | 16.80% |
| IA Mixed Investment 40-85% Shares | 6.44% | -7.99% | 4.30% | 1.54% | 17.11% |
The chart below shows the performance of the above fund since inception. The table below that shows the discrete annual performance to the last quarter end.
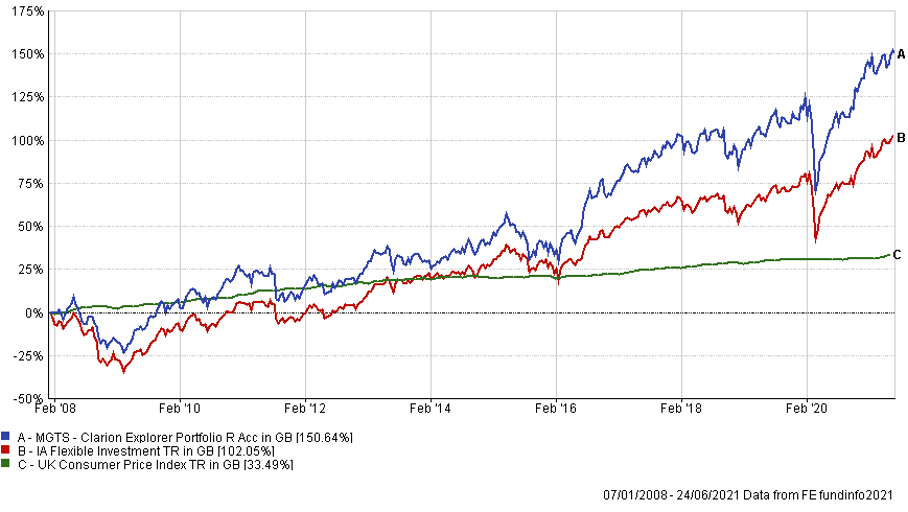
The chart below shows the performance of the above fund since inception. The table below that shows the discrete annual performance to the last quarter end.
| 31/03/20 to 31/03/21 | 31/03/19 to 31/03/20 | 31/03/18 to 31/03/19 | 31/03/17 to 31/03/18 | 31/03/16 to 31/03/17 | |
| MGTS Clarion Explorer R Acc | 34.25% | -9.05% | 4.23% | 3.50% | 27.04% |
| IA Flexible Investment | 29.10% | -8.14% | 3.31% | 2.36% | 19.06% |
It was agreed to make appropriate changes to the model portfolios to reflect the changes to the Portfolio Funds detailed above.
The next Investment Committee Meeting is on 15th July 2021 although in the interim period the Committee intends to conduct slightly shorter conference calls as considered appropriate.
Risk Warnings
Any investment performance figures referred to relate to past performance which is not a reliable indicator of future results and should not be the sole factor of consideration when selecting a product or strategy. The value of investments, and the income arising from them, can go down as well as up and is not guaranteed, which means that you may not get back what you invested. Unless indicated otherwise, performance figures are stated in British Pounds. Where performance figures are stated in other currencies, changes in exchange rates may also cause an investment to fluctuate in value.
————————————————————————
If you’d like more information about this article, or any other aspect of our true lifelong financial planning, we’d be happy to hear from you. Please call +44 (0)1625 466 360 or email [email protected].
Click here to sign-up to The Clarion for regular updates.