True lifelong financial planning for the serious business of life.
True lifelong financial planning
for the serious business of life.
True lifelong financial planning for the serious business of life.
True lifelong financial planning
for the serious business of life.
Tags: Adventurer Portfolio, Defender Portfolio, Discretionary Investment Management, Explorer Portfolio, funds, investment, Meridian Portfolio, MGTS Clarion Explorer, MGTS Clarion Meridian, MGTS Clarion Prudence, MTGS Clarion Navigator, Navigator Portfolio, Pioneer Portfolio, Prudence Portfolio, Voyager Portfolio
Category:
Investment management
The Clarion Investment Committee met on Thursday 16th June. The following notes summarise the main points of consideration in the investment Committee discussions.
The World Bank sharply lowered its forecast for global growth and highlighted the rising risk of recession in many countries.
The OECD warned that global growth is set to be sharply slower this year as the world battles high inflation stemming from the war in Ukraine and China’s zero-COVID policy.
The OECD forecasts that the UK economy will show no growth next year, the weakest performance of any G20 country other than Russia.
US inflation rose to 8.6% in the 12 months to May putting further pressure on the Fed to bring rising prices under control.
US treasury secretary Janet Yellen warned that the US is likely facing a prolonged period of elevated inflation.
US households are spending a higher share of their income on covering housing costs than at any time since 2007.
More investors are betting that the pound will fall further than at any point in almost three years.
A survey of economists conducted by the Financial Times found that the UK is expected to have the highest inflation in the G7 both this year and the next two years.
The FT reports that bus usage, cycling and online interest in electric cars have surged in the UK since March.
UK public satisfaction with how the Bank of England is dealing with inflation dropped to the lowest level since polling started 20 years ago.
An ONS survey found that more than four in ten (46%) UK adults reported that they were buying less food when food shopping in the past two weeks up from 18% at the beginning of 2022. The survey also found that 29% of UK adults said they would be unable to pay an unexpected but necessary expense of £850 and that 38% of the workforce were working from home some or all the time.
Chinese export growth rebounded in May, growing 16.9% compared to the same month in 2021, as Shanghai partially reopened.
Chinese producer price inflation fell to 6.4% in the year to May, a 14-month low, as cooling demand lowers prices for key inputs.
British motoring group the RAC announced that the cost of filling an average family car with petrol had reached over £100 for the first time.
US retail sales unexpectedly fell by 0.3% from April to May. Consumers spent more at petrol stations and grocery stores, reflecting the rising prices of these essentials but trimmed spending on new cars and online purchases.
The UK economy contracted by 0.3% in April, the second consecutive month of declines. A 5.6% fall in healthcare output as NHS Test and Trace wound down weighed on activity in the service sector but contractions were also seen in the manufacturing and construction sectors.
UK labour market data for February to April showed continued resilience in the labour market with unemployment down, inactivity down and vacancies hitting a fresh record.
Some 68,000 metalworkers in north-west Germany negotiated an increase in wages of 6.5%, the largest increase in 30 years, following a series of strikes.
The Bank of England raised interest rates by 0.25 percentage points to 1.25%. Three members of the nine-strong committee voted for an increase of 0.5 percentage points.
The Bank of England now expects inflation to rise to over 11% in October and the economy to contract by 0.3% in the second quarter.
The US Fed raised its target for the fed funds rate by 0.75 percentage points to a range of 1.5%– 1.75%. Policymakers indicated that they expect the policy rate to rise to 3.5% by the end of the year.
The Fed has begun the task of shrinking its balance sheet by not investing the proceeds of maturing bonds. The move will tighten financial conditions.
The Swiss National Bank raised interest rates by 0.5 percentage points to -0.25%, the first time it has raised rates since 2007, as it warned of the dangers of letting inflation “spread”.
The ECB said that it would work on a new policy tool to prevent “fragmentation” to financial markets and economies in the euro area. Italian bonds, which had been trading at a discount to German bonds, rallied on the news.
UK equities continue to trade at a discount relative to other developed equity markets on a historical basis. The value tilt across the FTSE indices and high yield ought to be attractive in the current inflationary environment. The collapse of growth style equities will be giving many asset managers pause for thought. The Investment Committee maintain the conviction with a broadly neutral UK position in the Clarion Portfolio Funds and model portfolios.
Asian equities trade at attractive earnings multiples at present, having suffered a difficult 2021 and 2022 and over the long term these look to have significant capital growth potential, with accommodative monetary policy in place. The short-term outlook remains challenging with rolling lockdowns and slowing growth and exports, but these concerns are ultimately surmountable, and the demographic trends of increasing domestic consumer wealth and spending in the region are positive. The Committee maintain a neutral position in Asia Pacific equities on this basis.
Growth equities have already been selling off substantially, and the US markets continue to throw curveballs at investor expectations, such as the calamity of Netflix’s latest earnings, where a relatively small subscriber loss pulled the rug out from under perennial growth expectations and the stock fell over 30% overnight.
It is notable that the Federal Reserve has now started to accelerate interest rate rises and quantitative tightening, and the wheels already look to be coming off the highly speculative areas of the tech wagon and cryptocurrencies. One only has to briefly glance at Cathie Wood’s sinking ARK technology innovation ETF to witness the bloodbath, where investors have lost half their capital year to date, and two thirds over six months. The Committee believe there are value opportunities in US smaller companies (trading at their widest discount in p/e terms to the S&P 500 in two decades) and at the bottom end of the major indices.
Short-dated bonds are still performing ahead of their long-dated counterparts with threats of higher bond yields continuing to rise. The managers are considering adding long-dated bond funds to increase portfolio duration when yields have risen sufficiently to justify the risk/reward balance. The portfolio funds and model portfolios are currently overweight in short-dated bonds due to their attractive potential returns, with a proportional underweight in long-dated bonds. The CBOE Volatility Index (Ticker: VIX ) is still indicating high levels of volatility which remain close to the peak after the Russian invasion. This is reflected in the performance of the Clarion Portfolio Funds and model portfolios and creates significant discrepancies in the performance of different equity styles, bond credit risk levels and broader asset classes.
No changes have been made to either the Clarion Portfolio Funds or model portfolios in the month of June due to the elevated volatility in financial markets. However, the Investment Committee are acutely aware of the evolving economic, interest rate and inflationary environment, are having in-depth discussions about how best to position the portfolios and will be making changes to the portfolios in early July 2022. However, these will be covered in a future article.
Continuing to hold diversified high-quality assets over the longer term remains the appropriate method for allocation of investor capital.
Keith W Thompson
Clarion Group Chairman
June 2022
For a fuller version of Clarion’s Economic and Stock Market Commentary, written by Clarion Group Chairman Keith Thompson, please click here
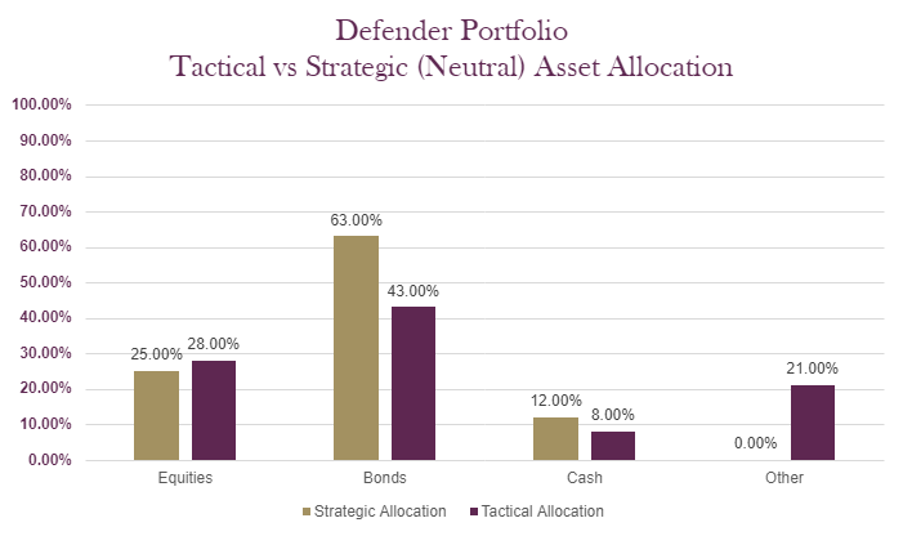
The charts below show the tactical asset allocation of the Defender Portfolio against the neutral/strategic asset allocation as well as the historical performance of the portfolio against a relevant benchmark since the start of the available data.
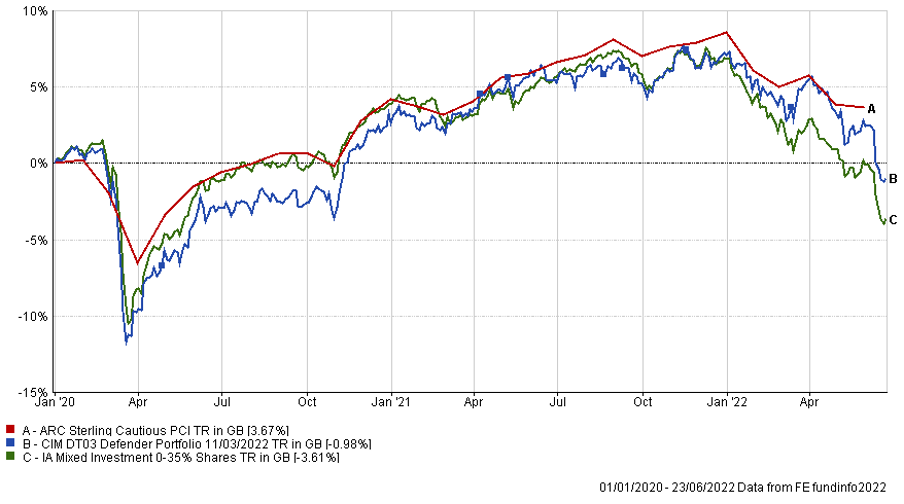
The table below shows the annualised performance to the last quarter end:
| 31/03/21 31/03/20
to to 31/03/22 31/03/21 |
|
| CIM DT03 Defender Portfolio | 1.94% 14.04% |
| ARC Sterling Cautious PCI | 1.82% 11.34% |
| IA Mixed Investment 0-35% Shares | -0.20% 12.09% |
Changes to the Defender model
There were no changes made to the Defender portfolio in June 2022. Changes are planned for July 2022 but these will be covered in a future article.
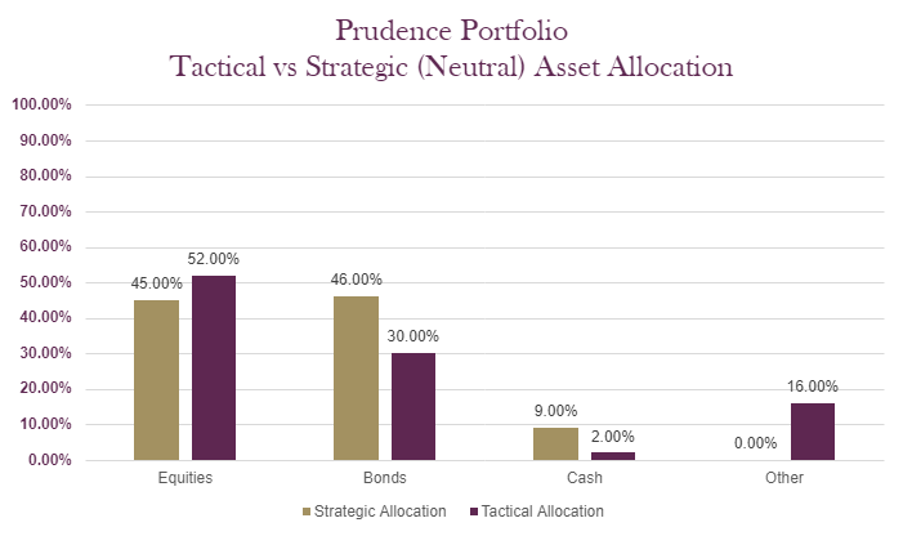
The charts below show the tactical asset allocation of the Prudence Portfolio against the neutral/strategic asset allocation as well as the historical performance of the portfolio against a relevant benchmark(s) since the start of the available data.
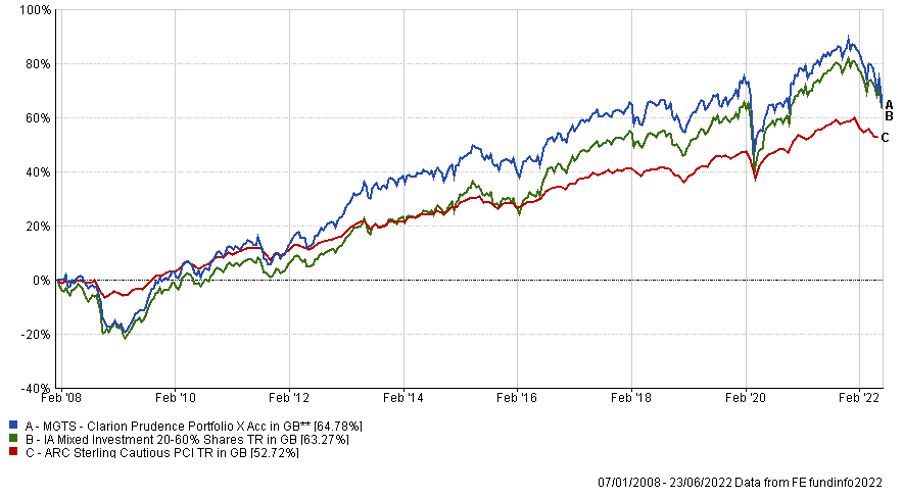
The table below shows the annualised performance to the last quarter end:
| 31/03/21 to 31/03/22 | 31/03/20 to 31/03/21 | 31/03/19 to 31/03/20 | 31/03/18 to 31/03/19 | 31/03/17 to 31/03/18 | |
| MGTS Clarion Prudence X Acc | 2.22% | 18.18% | -7.89% | 3.87% | -1.24% |
| CIM DT04 Prudence Portfolio | 2.88% | 18.24% | -7.42% | 4.15% | |
| ARC Sterling Cautious PCI | 1.82% | 11.34% | -2.29% | 1.71% | 0.65% |
| IA Mixed Investment 20-60% Shares | 2.73% | 19.83% | -7.19% | 2.86% | 0.83% |
Changes to the Prudence fund & model
There were no changes made to the Prudence portfolio in June 2022. Changes are planned for July 2022.
The charts below show the tactical asset allocation of the Navigator Portfolio against the neutral/strategic asset allocation as well as the historical performance of the portfolio against a relevant benchmark(s) since the start of the available data.
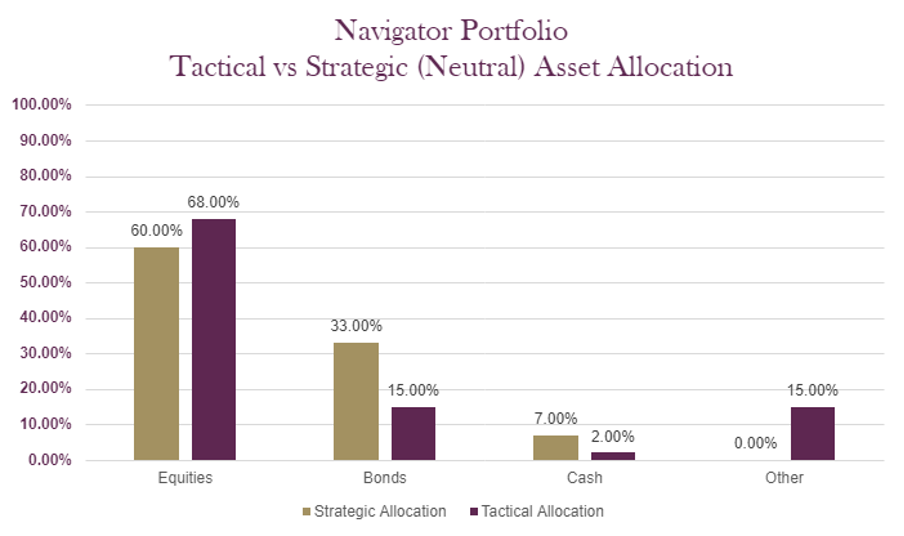
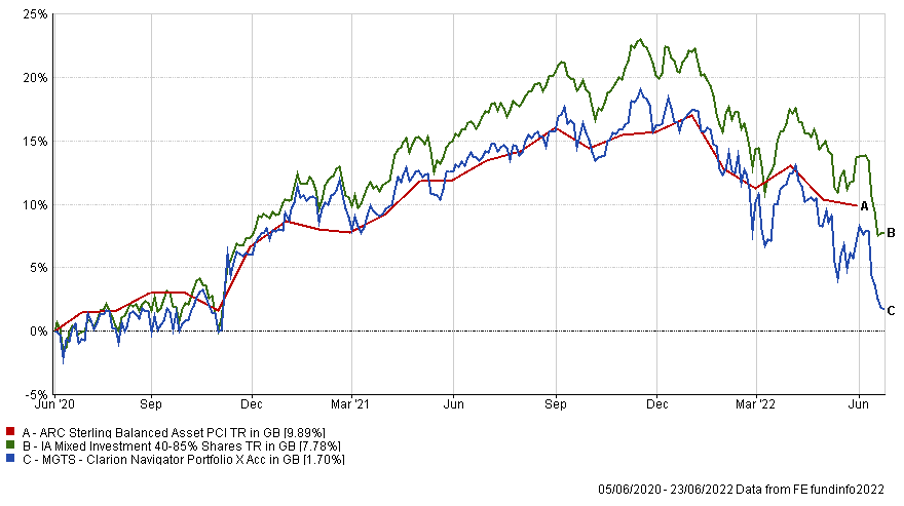
The table below shows the annualised performance to the last quarter end:
| 31/03/21 to 31/03/22 | |
| MGTS Clarion Navigator X Acc | 2.71% |
| CIM DT05 Navigator Portfolio | 3.09% |
| IA Mixed Investment 40-85% Shares | 5.23% |
| ARC Sterling Balanced Asset PCI | 3.63% |
Changes to the Navigator fund & model
There were no changes made to the Navigator portfolio in June 2022. Changes are planned for July 2022 but these will be covered in a future article.
The charts below show the tactical asset allocation of the Meridian Portfolio against the neutral/strategic asset allocation as well as the historical performance of the portfolio against a relevant benchmark(s) since the start of the available data.
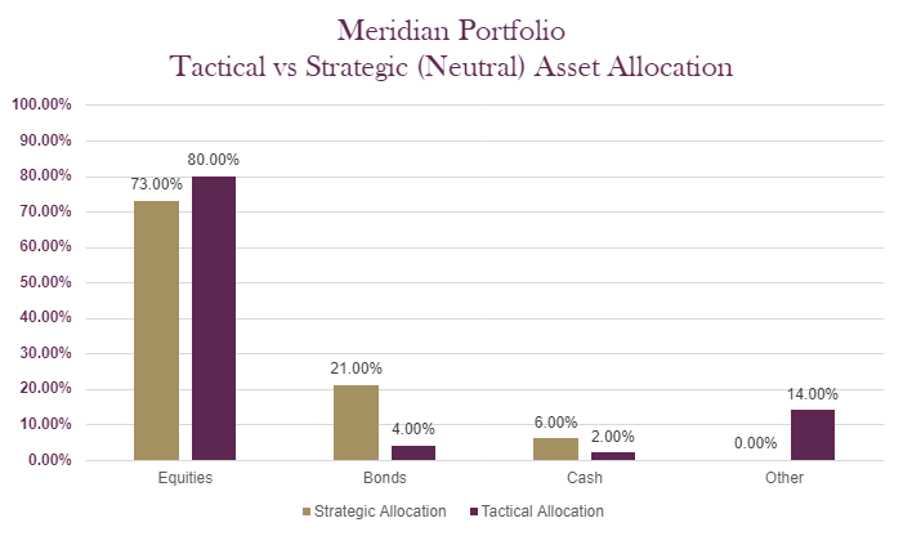
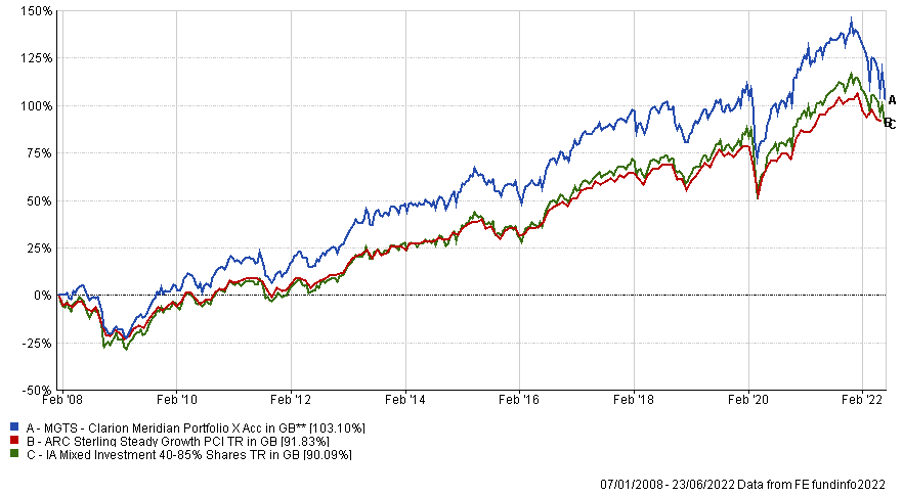
The table below shows the annualised performance to the last quarter end:
| 31/03/21 to 31/03/22 | 31/03/20 to 31/03/21 | 31/03/19 to 31/03/20 | 31/03/18 to 31/03/19 | 31/03/17 to 31/03/18 | |
| MGTS Clarion Meridian X Acc | 1.40% | 30.01% | -10.01% | 4.27% | -0.40% |
| CIM DT06 Meridian Portfolio | 1.76% | 30.90% | -9.43% | 4.28% | |
| ARC Steady Growth PCI | 5.13% | 23.53% | -7.71% | 4.85% | 1.31% |
| IA Mixed Investment 40-85% Shares | 5.23% | 26.44% | -7.99% | 4.30% | 1.54% |
Changes to the Meridian fund & model
There were no changes made to the Meridian portfolio in June 2022
The charts below show the tactical asset allocation of the Explorer Portfolio against the neutral/strategic asset allocation as well as the historical performance of the portfolio against a relevant benchmark(s) since the start of the available data.
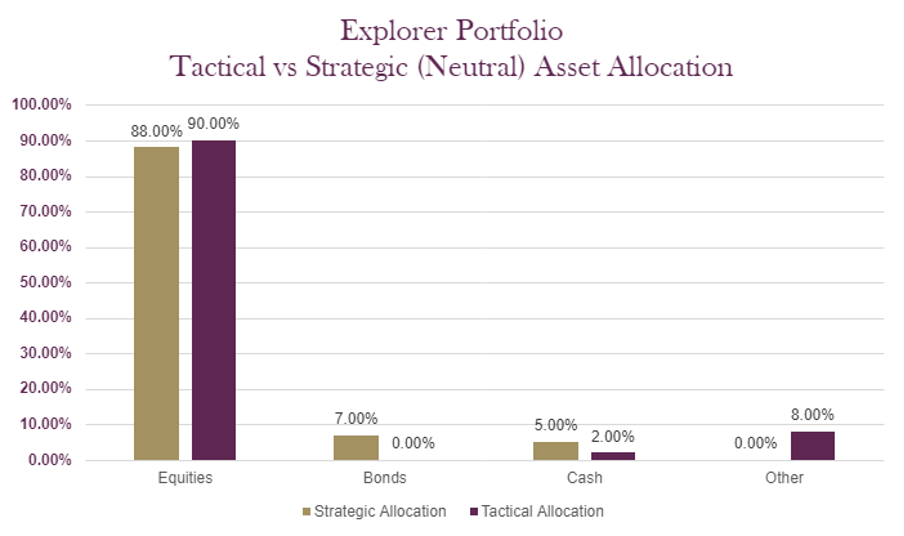
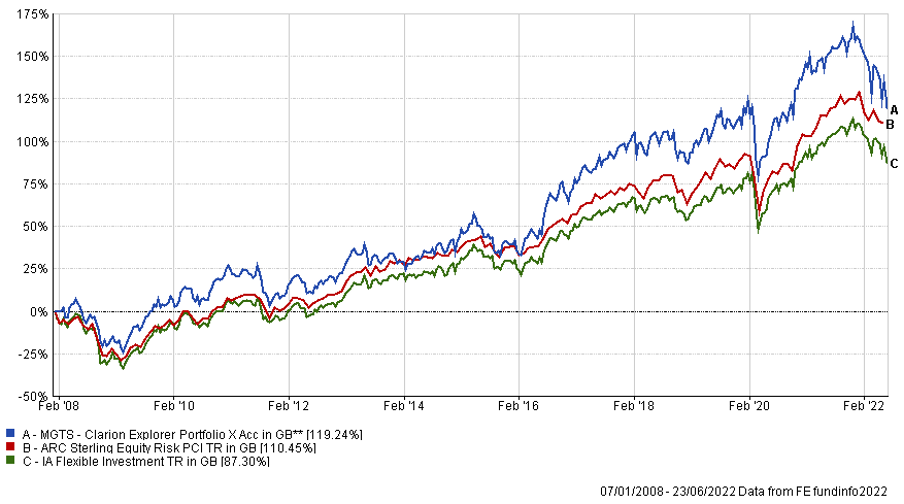
The table below shows the annualised performance to the last quarter end:
| 31/03/21 to 31/03/22 | 31/03/20 to 31/03/21 | 31/03/19 to 31/03/20 | 31/03/18 to 31/03/19 | 31/03/17 to 31/03/18 | |
| MGTS Clarion Explorer X Acc | 1.79% | 34.64% | -9.05% | 4.23% | 3.50% |
| CIM DT07 Explorer Portfolio | 1.61% | 35.28% | -10.10% | 5.22% | |
| ARC Equity Risk PCI | 5.63% | 30.35% | -9.65% | 6.04% | 1.77% |
| IA Flexible Investment | 4.95% | 29.10% | -8.14% | 3.31% | 2.36% |
Changes to the Explorer fund & model
There were no changes made to the Explorer portfolio in June 2022. Changes are planned for July 2022 but these will be covered in a future article.
The charts below show the tactical asset allocation of the Voyager Portfolio against the neutral/strategic asset allocation as well as the historical performance of the portfolio against a relevant benchmark(s) since the start of the available data.
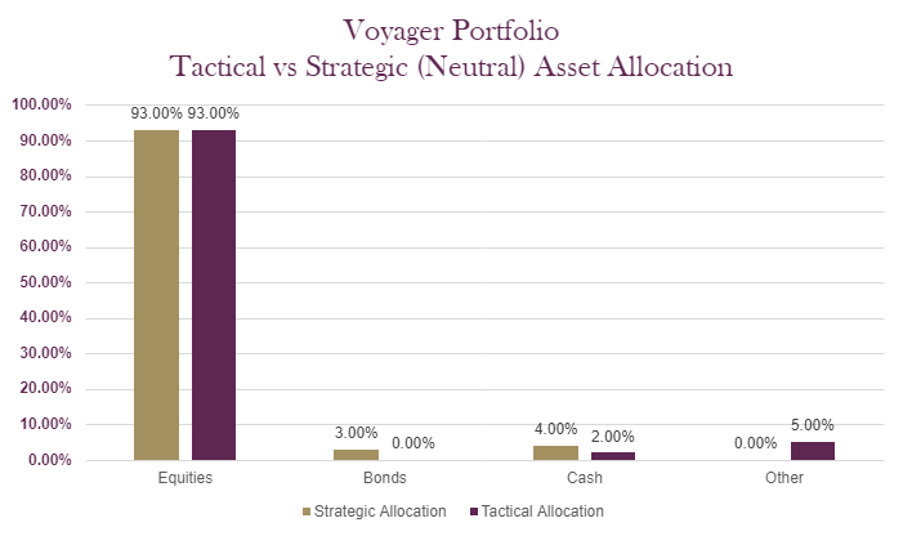
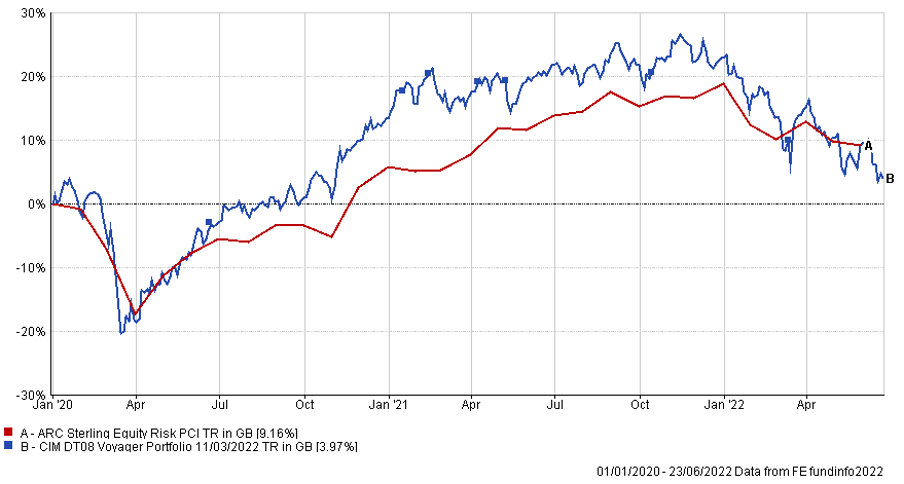
The table below shows the annualised performance to the last quarter end:
| 31/03/21
to 31/03/22 |
31/03/20
to 31/03/21 |
|||||
| CIM DT08 Voyager Portfolio | -1.32% | 40.16% | ||||
| ARC Equity Risk PCI | 5.63% | 30.35% |
Changes to the Voyager fund & model
There were no changes made to the Voyager portfolio in June 2022
The charts below show the tactical asset allocation of the Adventurer Portfolio against the neutral/strategic asset allocation as well as the historical performance of the portfolio against a relevant benchmark(s) since the start of the available data.
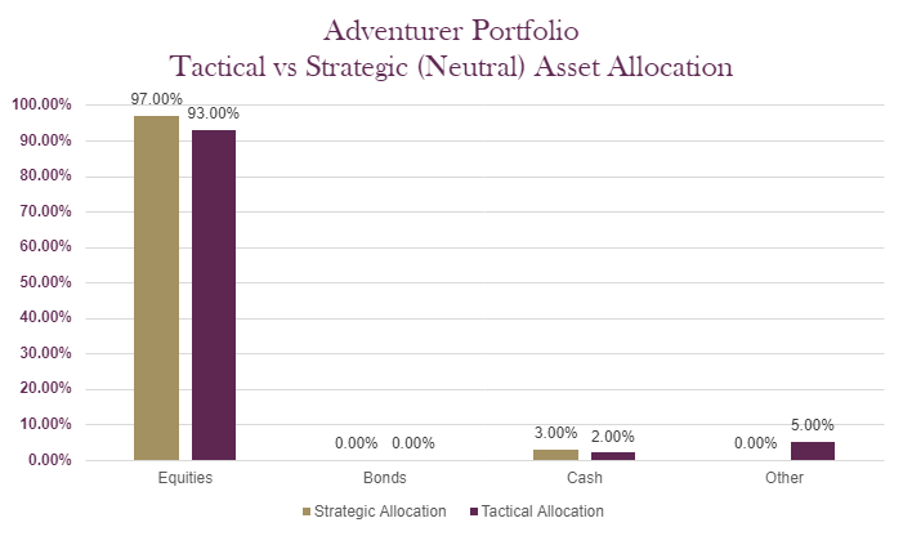
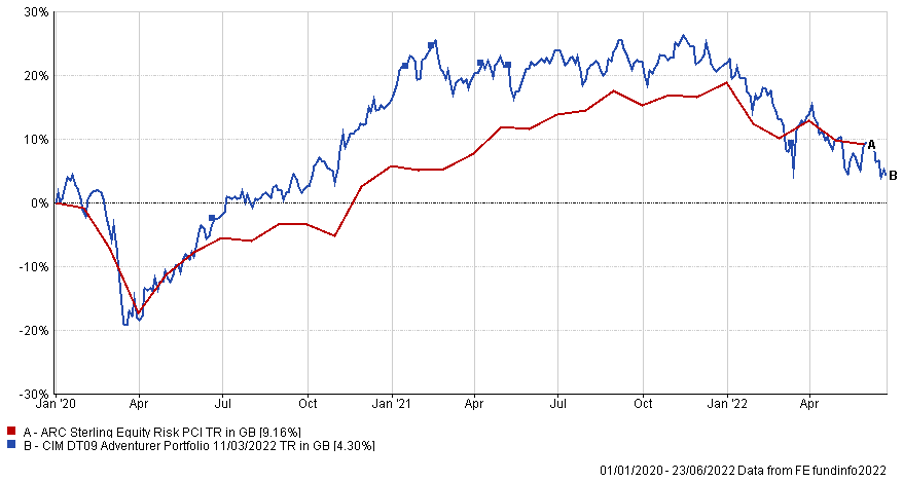
The table below shows the annualised performance to the last quarter end:
| 31/03/21
to 31/03/22 |
31/03/20
to 31/03/21 |
||||
| CIM DT09 Adventurer Portfolio | -4.50% | 43.24% | |||
| ARC Equity Risk PCI | 5.63% | 30.35% |
Changes to the Adventurer model
There were no changes made to the Adventurer portfolio in June 2022. Changes are planned for July 2022 but these will be covered in a future article.
The charts below show the tactical asset allocation of the Pioneer Portfolio against the neutral/strategic asset allocation as well as the historical performance of the portfolio against a relevant benchmark(s) since the start of the available data.
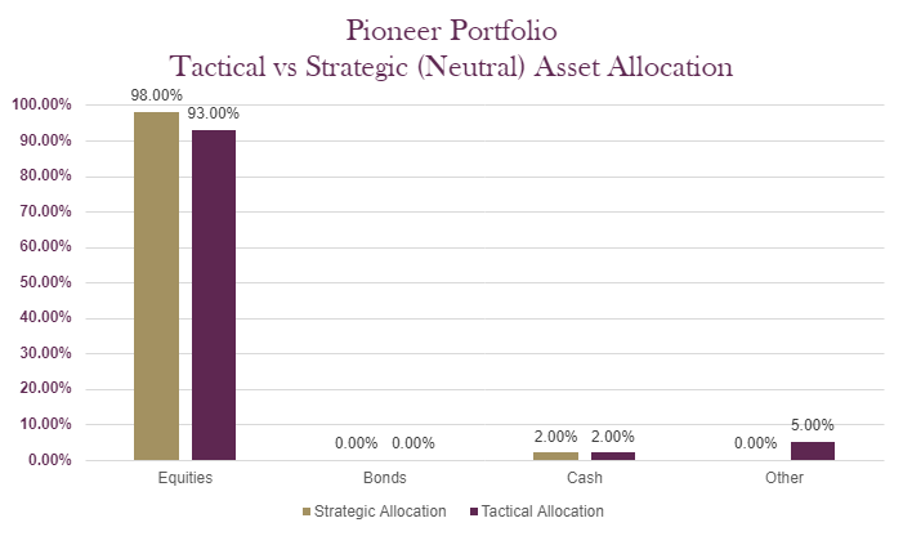
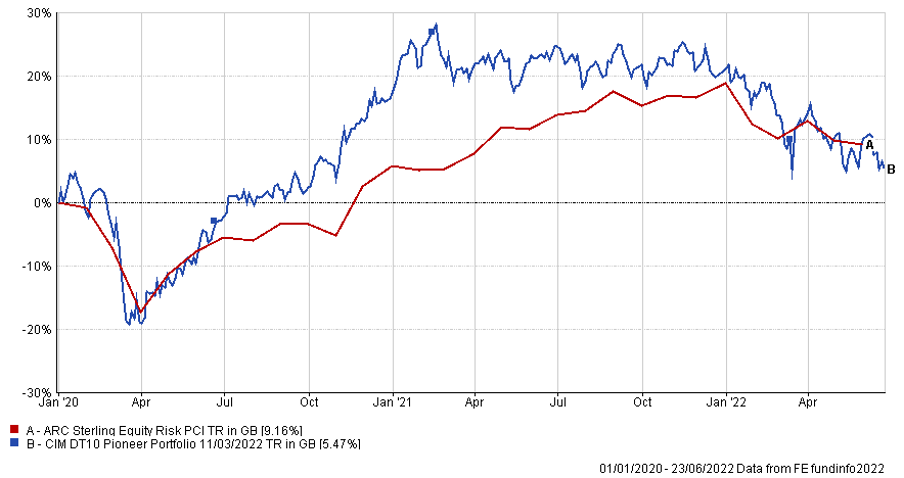
The table below shows the annualised performance to the last quarter end:
| 31/03/21
to 31/03/22 |
31/03/20
to 31/03/21 |
||||
| CIM DT10 Pioneer Portfolio | -5.56% | 46.53% | |||
| ARC Equity Risk PCI | 5.63% | 30.35% |
Changes to the Pioneer model
There were no changes made to the Pioneer portfolio in June 2022. Changes are planned for July 2022 but these will be covered in a future article.
The content of this article does not constitute financial advice and you may wish to seek professional advice based on your individual circumstances before making any financial decisions.
Any investment performance figures referred to relate to past performance which is not a reliable indicator of future results and should not be the sole factor of consideration when selecting a product or strategy. The value of investments, and the income arising from them, can go down as well as up and is not guaranteed, which means that you may not get back what you invested. Unless indicated otherwise, performance figures are stated in British Pounds. Where performance figures are stated in other currencies, changes in exchange rates may also cause an investment to fluctuate in value.
If you’d like more information about this article, or any other aspect of our true lifelong financial planning, we’d be happy to hear from you. Please call +44 (0)1625 466 360 or email [email protected].
Click here to sign-up to The Clarion for regular updates.