Tags: Adventurer Portfolio, Defender Portfolio, Discretionary Investment Management, Explorer Portfolio, funds, investment, Meridian Portfolio, MGTS Clarion Explorer, MGTS Clarion Meridian, MGTS Clarion Prudence, MTGS Clarion Navigator, Navigator Portfolio, Pioneer Portfolio, Prudence Portfolio, Voyager Portfolio
Category:
Investment management
The Clarion Investment Committee met on the 15th of June 2023. The following notes summarise the main points of consideration in the Investment Committee discussions but have been updated to include commentary on recent events and the wider implications for financial markets.
To see Clarion’s Economic and Stock Market Commentary, written by Clarion Group Chairman Keith Thompson, please click here
At the meeting on the 15th of June, the investment committee reflected on the wider financial sector frailties following the fallout from the collapses of the Silicon Valley and First Republic Banks in the US. In Europe, the dramatic loss of confidence in Credit Suisse led to a deposit run-off at digitally-enabled speed and a total wipe-out of its statutory capital reserves, held in specialist bonds called Contingent Convertibles or ‘Cocos’.
These events are symptomatic of the sharp increase in interest rates, shrinking central bank balance sheets and the receding tide of global liquidity that had flooded the financial system for much of the past decade.
For those financial institutions that have relied too much on cheap liquidity by taking on too much leverage and aggressively mismatching their balance sheets, times will be challenging given their magnified exposure to bond duration risk. Should confidence in the banking system weaken further, this could result in contagion risks in other financial markets, particularly the leveraged pension funds. However, it was acknowledged that the major global banks are more robust than in the lead-up to the Global Financial Crisis, with global regulators requiring much greater capital and liquidity buffers.
Despite the financial challenges faced from higher interest rates, growth has been more resilient than expected. Aided by a decline in energy prices, with a mild winter in the northern hemisphere helping to reduce demand for natural gas, growth appears to have picked up in early 2023.
Alongside the rapid reopening of the Chinese economy following the lifting of Covid restrictions, global growth has been more resilient than expected this year.
The IC also discussed the stickiness of underlying inflation being higher than expected at this stage of the economic cycle, indicating a broad-based ability for companies to both pass on higher input costs and maintain (or even expand) margins. Wage growth across the major economies remains quite elevated, as a result of extremely tight labour markets. This is partly reflecting robust levels of demand, but also reduced labour supply, an issue which is particularly impacting the UK economy.
In the US productivity growth has lagged wage increases and this seriously questions the level of stretched P/E ratios in the US, should inflation remain higher for longer and when/if it reverts to the Fed’s original 2% target anytime soon. And the shape of the (inverted) bond yield curve traditionally has been a consistent signal of impending recession, so markets will continue to ponder with why it would be different this time?
The economic and financial market uncertainty created by recent events in the banking system is expected to leave central banks more watchful in the coming months over recession risks. That means that the rapid rate hiking cycles that have been running for a year or more may be paused, or even be coming to an end this year, with the exception of the UK where inflation forces remain elevated.
Despite the ongoing financial and geo-political volatility perturbing global market sentiment, the Investment Committee continue to remain focused on the analysis of long-term trends which are expected to impact a wide range of financial instruments. The process of periodic assumption setting is designed to avoid the over-emphasis of short-term transitory signals whilst remaining alert to strategic drivers of change. At this meeting, the IC approved only minimal changes to the long-term capital market assumptions, with the efficient frontier curve shifting marginally downwards and to the right for the lower to mid-risk benchmarks.
Despite the collapse of Silicon Valley Bank and other regional banks in the US and a dramatic loss of confidence in Credit Suisse which was subsequently rescued by UBS, global equities have remained resilient in the first half of the year, particularly in the US. Such surprising optimism was buoyed by receding recession worries in developed markets as commodity prices fell and lingering concerns of wider systemic risks in the financial sector being shrugged off, given the greater resilience of the major global banks post the global financial crisis of 2007/8. In an expression of confidence, the US Fed raised interest rates by 25 basis points in both February and March to their highest level since 2007. Further tightening was made by the ECB and the Bank of England to tackle stubbornly high and persistent inflation. There was also a sense of renewed optimism about emerging markets, given the re-opening of China’s economy, albeit tempered by re-escalating US-China tensions.
The performance in the US equity market has been quite strong, with the performance of the IA North America sector only bettered by the IA Japan sector amongst major IA sectors representing equity investments. By looking under the bonnet, however, one can see a more distorted picture. Seven stocks; Apple, Microsoft, Alphabet, Amazon, Nvidia, Meta and Tesla have essentially been the only drivers of the US equity market’s performance year-to-date, with the rest of the market delivering near zero or negative returns. It is likely that investors have been concentrating their positions in these stocks based on their exposure to AI. The key case study to this investor behaviour has been in Nvidia.
Nvidia is a technology company that designs graphics processing units (GPUs), application programming interface (APIs) for data science and high-performance computing as well as system on chip units (SoCs) for the mobile computing and automotive market. Nvidia’s GPUs are used in a wide variety of artificial intelligence applications, such as self-driving cars, facial recognition, and natural language processing. The growing adoption of artificial intelligence has led to strong sales growth for Nvidia’s data centre segment. However, the growth of Nvidia’s earnings has not kept up to the rate at which their share price has been rising. Nvidia’s PE ratio (price to earnings ratio) rose to over 100 times at its peak meaning investors were willing to pay 100 times the company’s earnings per share (EPS) for its stock. A high PE ratio can be a sign that investors are expecting strong future growth from the company. However, it can also be a sign that the stock is overvalued.
While there is excitement around the prospects of Nvidia and the potential future earnings that the company may achieve with advancements in AI, there is equally a lot of uncertainty on who will be the winners in an AI revolution. Looking throughout history, companies such as Nokia and Motorola seemed strong winners for the mobile phone market in early adoption of the technology, but ultimately failed to sustain their leadership with Apple and Samsung becoming the market leaders at a later date. Investors should be wary when valuing a company like Nvidia, which briefly became only the sixth trillion-dollar company, as these trends can reverse, and market share can change dynamically leading to significant losses.
Central banks continued with their interest rate hikes against a volatile market backdrop with widening credit spreads. The US banking collapses in mid-March prompted a sharp rally in government bond markets, discounting the possibility of an earlier pause, or even an end to the hiking cycle. While there were signs that previous rate hikes were already biting (particularly in housing markets), their full impact on the broader economy is yet to be seen and concerns still linger over persistently high inflation data in both the US and Europe.
As bond yields reached the highs of Kwasi Kwarteng’s budget announcement, the investment committee are considering adding more exposure to longer-dated bonds. However, a gradual approach will be taken with no major changes expected until yields on 10-year UK gilts approach 5%. For the time being, the committee continue to exhibit bias to short-dated strategies which are more resilient to interest rate rises.
The investment committee continue to favour the UK over the US on a valuation basis. The US equity market is still highly distorted, with a few large-cap technology companies driving the performance of US equity indices. The UK equity market, on the other hand, has a much broader base and should be more resilient to a high-interest rate environment due to its higher exposure to dividend-paying companies and companies in sectors that can remain profitable in the current macroeconomic environment.
The committee continue to favour Asia and Emerging Markets. While the re-opening of China’s economy had a profoundly positive effect on the performance of European, Japanese and commodity-driven stocks, the same effect has yet to have been realised in China’s equity market. While political headwinds remain strong in the region, the valuation argument outweighs the negatives. The Committee expect much broader outperformance in the region within the next 12 months.
The key themes are as follows:
In the Committee’s view, central banks are likely to shift from the previous inflation target of 2% to a higher figure or a floating range, which will most likely be around 3-4%. The amount of economic destruction required to bring inflation back to a 2% target would be too great to be justifiable. Coupled with multiple developed economies (US and Europe) trying to ease the reliance on supply chains from China, inflation is likely to be stickier, although much lower than current levels, than initially thought.
Continuing to hold a globally diversified portfolio of high-quality assets is important to provide resilience and grow the value of savings over the long term and remains the appropriate method for allocation of investor capital. Cash is unattractive as inflationary pressures, although moderating, look to be structurally long term.
Keith W Thompson
Clarion Group Chairman
June 2023
Creating better lives now and in the future for our clients, their families and those who are important to them.
The chart below shows the historical performance of the Defender Portfolio against a relevant benchmark since the start of the available data.
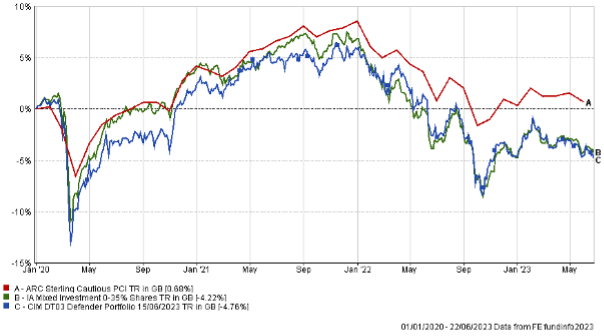
The table below shows the annualised performance to the last quarter end:
| 31/03/2022
to 31/03/2023 |
31/03/21
to 31/03/20 |
31/03/20
to 31/03/21 |
|
| CIM DT03 Defender Portfolio | -7.11% | 1.34% | 13.46% |
| ARC Sterling Cautious PCI | -3.83% | 1.62% | 11.34% |
| IA Mixed Investment 0-35% Shares | -5.94% | -0.20% | 12.09% |
The chart below shows the historical performance of the Prudence Portfolio against a relevant benchmark since the start of the available data.
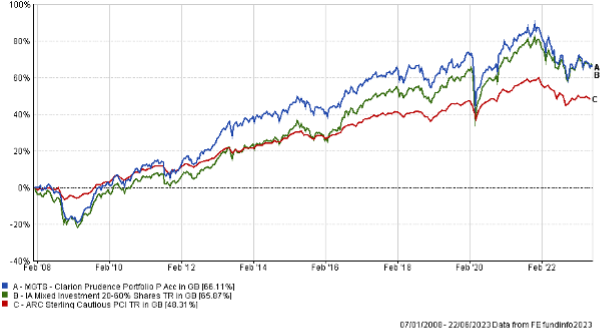
The table below shows the annualised performance to the last quarter end:
| 31/03/22 to 31/03/23 | 31/03/21 to 31/03/22 | 31/03/20 to 31/03/21 | 31/03/19 to 31/03/20 | 31/03/18 to 31/03/19 | |
| MGTS Clarion Prudence P Acc | -7.44% | 2.30% | 18.26% | -7.89% | 3.87% |
| CIM DT04 Prudence Portfolio | -7.58% | 2.88% | 18.24% | -7.42% | 4.15% |
| ARC Sterling Cautious PCI | -3.83% | 1.62% | 11.34% | -2.29% | 1.71% |
| IA Mixed Investment 20-60% Shares | -4.80% | 2.73% | 19.83% | -7.19% | 2.86% |
The chart below shows the historical performance of the Navigator Portfolio against a relevant benchmark since the start of the available data.
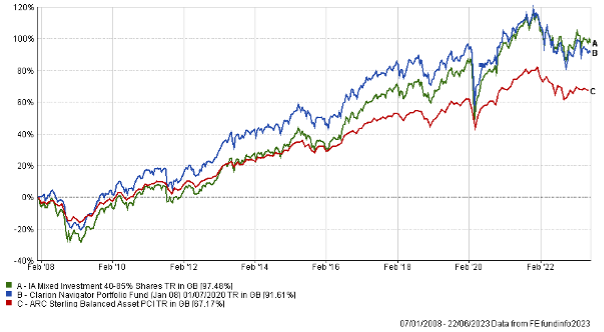
The table below shows the annualised performance to the last quarter end:
| 31/03/22
to 31/03/23 |
31/03/21
to 31/03/22 |
31/03/20
to 31/03/21 |
31/03/19 to 31/03/20 | 31/03/18 to 31/03/19 | |
| MGTS Clarion Navigator P Acc | -6.97% | 2.81% | |||
| CIM DT05 Navigator Portfolio | -6.97% | 2.81% | 22.28% | -9.14% | 4.12% |
| ARC Sterling Balanced Asset PCI | -4.32% | 3.46% | 17.86% | -5.44% | 2.98% |
| IA Mixed Investment 40-85% Shares | -4.54% | 5.23% | 26.44% | -7.99% | 4.30% |
The chart below shows the historical performance of the Meridian Portfolio against a relevant benchmark since the start of the available data.
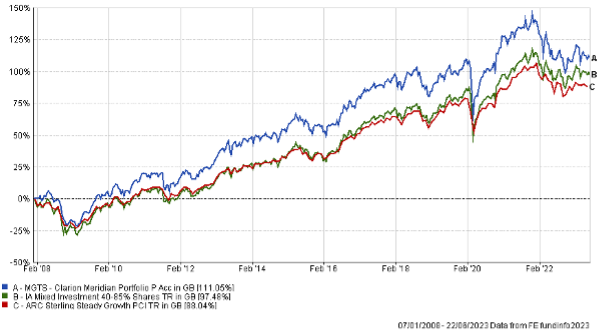
The table below shows the annualised performance to the last quarter end:
| 31/03/22
to 31/03/23 |
31/03/21
to 31/03/22 |
31/03/20
to 31/03/21 |
31/03/19
to 31/03/20 |
31/03/18 to 31/03/19 | |
| MGTS Clarion Meridian P Acc | -7.50% | 1.50% | 30.12% | -10.01% | 4.27% |
| CIM DT06 Meridian Portfolio | -6.65% | 1.76% | 30.90% | -9.43% | 4.28% |
| ARC Steady Growth PCI | -4.60% | 4.64% | 23.53% | -7.71% | 4.85% |
| IA Mixed Investment 40-85% Shares | -4.54% | 5.23% | 26.44% | -7.99% | 4.30% |
The chart below shows the historical performance of the Explorer Portfolio against a relevant benchmark since the start of the available data.
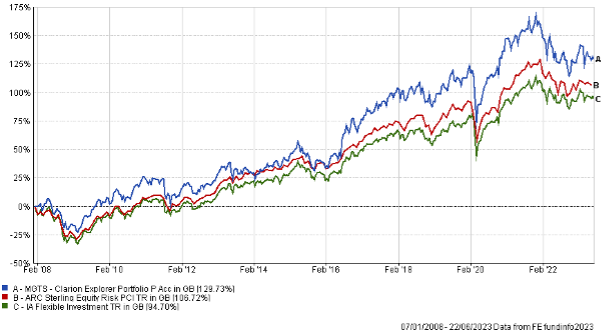
The table below shows the annualised performance to the last quarter end:
| 31/03/22
to 31/03/23 |
31/03/21
to 31/03/22 |
31/03/20
to 31/03/21 |
31/03/19
to 31/03/20 |
31/03/18
to 31/03/19 |
|
| MGTS Clarion Explorer P Acc | -7.41% | 1.90% | 34.77% | -9.05% | 4.23% |
| CIM DT07 Explorer Portfolio | -6.44% | 1.61% | 35.28% | -10.10% | 5.22% |
| ARC Equity Risk PCI | -4.80% | 4.84% | 30.35% | -9.65% | 6.04% |
| IA Flexible Investment | -4.03% | 4.95% | 29.10% | -8.14% | 3.31% |
The chart below shows the historical performance of the Voyager Portfolio against a relevant benchmark since the start of the available data.
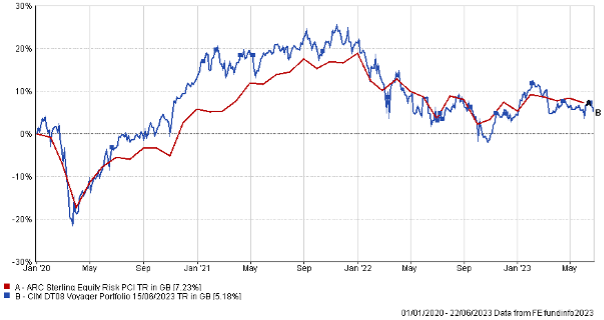
The table below shows the annualised performance to the last quarter end:
| 31/03/22
to 31/03/23 |
31/03/21
to 31/03/22 |
31/03/20
to 31/03/21 |
|
| CIM DT08 Voyager Portfolio | -6.00% | -1.91% | 39.32% |
| ARC Equity Risk PCI | -4.80% | 4.84% | 30.35% |
The chart below shows the historical performance of the Adventurer Portfolio against a relevant benchmark since the start of the available data.
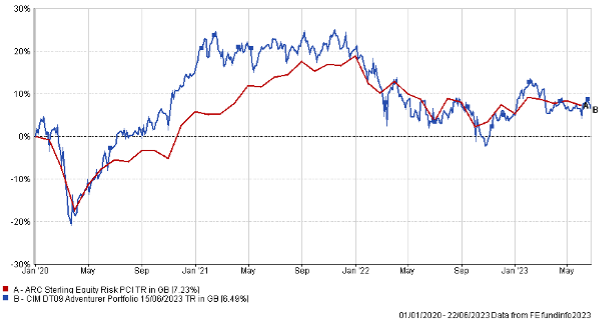
The table below shows the annualised performance to the last quarter end:
| 31/03/22
to 31/03/23 |
31/03/21
to 31/03/22 |
31/03/20
to 31/03/21 |
|||
| CIM DT09 Adventurer Portfolio | -4.13% | -5.07% | 42.38% | ||
| ARC Equity Risk PCI | -4.80% | 4.84% | 30.35% |
The chart below shows the historical performance of the Pioneer Portfolio against a relevant benchmark since the start of the available data.
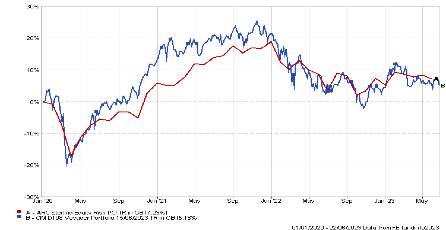
The table below shows the annualised performance to the last quarter end:
| 31/03/22
to 31/03/23 |
31/03/21
to 31/03/22 |
31/03/20
to 31/03/21 |
|||
| CIM DT10 Pioneer Portfolio | -4.11% | -6.12% | 45.66% | ||
| ARC Equity Risk PCI | -4.80% | 4.84% | 30.35% |
The content of this article does not constitute financial advice and you may wish to seek professional advice based on your individual circumstances before making any financial decisions.
Any investment performance figures referred to relate to past performance which is not a reliable indicator of future results and should not be the sole factor of consideration when selecting a product or strategy. The value of investments, and the income arising from them, can go down as well as up and is not guaranteed, which means that you may not get back what you invested. Unless indicated otherwise, performance figures are stated in British Pounds. Where performance figures are stated in other currencies, changes in exchange rates may also cause an investment to fluctuate in value.
If you’d like more information about this article, or any other aspect of our true lifelong financial planning, we’d be happy to hear from you. Please call +44 (0)1625 466 360 or email [email protected].
Click here to sign-up to The Clarion for regular updates.