True lifelong financial planning for the serious business of life.
True lifelong financial planning
for the serious business of life.
True lifelong financial planning for the serious business of life.
True lifelong financial planning
for the serious business of life.
Tags: Adventurer Portfolio, banking, Credit Suisse, Defender Portfolio, Discretionary Investment Management, Explorer Portfolio, funds, investment, Meridian Portfolio, MGTS Clarion Explorer, MGTS Clarion Meridian, MGTS Clarion Prudence, MTGS Clarion Navigator, Navigator Portfolio, Pioneer Portfolio, Prudence Portfolio, Spring Budget, SVB, Voyager Portfolio
Category:
Investment management
The Clarion Investment Committee met on the 9th March, 2023. The following notes summarise the main points of consideration in the Investment Committee discussions but have also been updated to include commentary on the recent turmoil in the banking sector and wider financial markets.
Since the date of the Investment Committee meeting the UK Chancellor has introduced his March Budget and major central banks have continued with the theme of tightening monetary policy with further interest rate rises although now at a slightly slower pace than previously. These developments were widely anticipated by the Committee and factored into the investment strategy decisions outlined below.
Within days of the Committee meeting, we experienced turmoil in the banking sector and heightened volatility in stock markets reminiscent of the events leading up to the Global Financial Crisis of 2008. These events could not have been anticipated but as with previous panics the best reaction is to stand aside and do nothing until things calm down. For the time being, we are comfortable with the positioning of the Funds and Portfolios. A comprehensive review of the investment strategy and the underlying funds will take place at the next committee meeting on 13th April.
And finally… the FT’s Alphaville highlighted a report by SigTech that showed there are over 30,000 hedge funds globally, a greater number than the number of Burger King restaurants or the number of words in George Orwell’s 1945 classic Animal Farm. Despite their apparent popularity, according to data from eVestment, the average hedge fund lost more than 12% before fees in 2022 – Investors might well ask, why bother, management fees are generally two or three times higher than a good old-fashioned long only multi-asset fund like the Clarion portfolio funds and model portfolios.
Silicon Valley Bank (SVB) collapsed on 10th March following a bank run. It was the largest bank collapse since the Global Financial Crisis and the second largest in US history. The strategy of SVB was the greatest factor leading to its demise. The bank’s management left SVB dangerously exposed to duration risk (risk to a rise in interest rates) in its security portfolios. The managers took gains in their interest rate hedged holdings, which reduce duration risk, within the ‘available-for-sale’ (marked to market) portfolio in 2022. In total SVB unwound $11bn of its hedged portfolio in the first half of 2022, leaving just $563mn in hedges at the end of the year. This was down from $15bn at the end of 2021, more than a 96% reduction of its hedged position in the marked-to-market portfolio.
The rest of the bonds SVB held were in its ‘held-to-maturity’ portfolio, these were valued at par value because, as their category on SVB books suggests, they were supposed to be held till they mature. Bonds with a duration of 10 years or more accounted for 94% of the held-to-maturity portfolio. These long-dated bonds are subject to interest rate risk (duration risk) and would accumulate significant unrealised losses if marked to market in a period of rising interest rates. The interest rate risk these bonds exhibit would not matter if they were held to maturity, as all bond valuations converge to par towards the end of their life.
SVB’s clients were almost entirely made up of venture-backed tech start-ups which created a client base of unusually large depositors with highly correlated revenue streams. Most clients’ deposits were in excess of the $250,000 limit insured by the Federal Deposit Insurance Corporation (FDIC). In total 89% of SVB’s clients’ money was not insured in the event of failure. Deposits held at SVB nearly doubled in 2021. The bank faced a gradual outflow of assets throughout 2022, as the Fed began raising the Fed Funds Rate making funding startups more difficult and expensive, forcing some of SVB’s clients to withdraw their deposits to meet liquidity needs.
On Wednesday 8th of March SVB sold $21bn of bonds including those from the ‘held-to-maturity’ portfolio, triggering a revaluation of its assets which have been marked to market and resulted in a $1.8bn loss for the bank, bringing its capital ratios below the regulatory threshold. On Thursday 9th of March SVB attempted to raise $2.25bn of capital to plug the funding gap via common equity and convertible stock offering. The stock sale collapsed and created a panic among SVB’s clients who rushed to withdraw their deposits and created a bank run. On Friday 10th March SVB was shut down.
The failure of SVB is unlikely to be a systemic issue for large banks. Its failure was a result of abysmally poor management rather than an unavoidable consequence of rapid rate rises. In the US, banks with assets over $250bn undergo greater capital and liquidity adequacy regulations than small to mid-size banks, which protects against these management mistakes. These regulations alongside stress testing were previously required for smaller banks but were lifted in the rollback of sections of the Dodd-Frank Act in 2018 under Trump’s presidency.
It could be argued that under current regulation there is still a risk to mismanagement in small to mid-size banks, but the issue is not as present in those larger than $250bn in the US. A review by the Federal Reserve into why SVB was allowed to fail in the way it did is currently taking place with a publication date set as 1st May. Senator Elizabeth Warren has put forward a bill to bring back the lifted regulation on mid-sized banks and prevent the banking sector from taking on too much risk. Should this bill pass and be boosted by evidence from the Fed review, the sector would be more protected from mismanagement. At the same time, any further increases in interest rates by the Fed could tip other mid-size mismanaged banks into the red should they share a securities portfolio similar to SVB.
In Europe, Credit Suisse underwent its final fiasco following the SVB crisis, with an admittance of weakness in their financial controls and an announcement by the Saudi National Bank stating they wouldn’t take their investment into the bank further than 10%, drastically causing a fall in the Credit Suisse share price by 24% and initiating a stream of client withdrawals. In reality, the Saudi statement was more related to regulatory issues associated with holding more than 10% in the bank, rather than confidence issues, however the markets assumed the latter.
Credit Suisse has been the most problematic bank since the Global Financial Crisis with issues ranging from money laundering, exposure to the insolvency of Greensill Capital and Archegos, and absurd management changes related to spying, and quarantine rules. With all the mentioned events occurring in just over three years, it may be safe to say that Credit Suisse’s failure was anything but systemic of the banking sector. A £44bn lifeline was presented by the Swiss National Bank to Credit Suisse in order to fill short-term capital concerns, but this was followed by $10bn of withdrawals the following day as confidence hit an all-time low.
Finally, the troubled bank was put out of its misery as long-term rival UBS agreed a takeover, in the process wiping out $17bn of subordinated Credit Suisse bonds. In Credit Suisse’s case, the lack of confidence was just the straw that broke the camel’s back. Years of scandal had caught up with the bank, and depositors had decided enough was enough. Other large EU, UK and US banks are unlikely to put themselves in a position like that of Credit Suisse and fears in these regions are probably overstated on the basis that these banks are exceptions to the norm.
For a fuller version of Clarion’s Economic and Stock Market Commentary, written by Clarion Group Chairman Keith Thompson, please click here
Markets have entered a period of normalisation as developed economies’ interest rates have risen from their period of historic lows to combat inflation. Some investors may believe that the era of low interest rates will return, but this could be a trap and lead to underperformance. Higher bond yields now offer investors a viable alternative to equities when building portfolios.
Any recession in a high inflationary environment is likely to be mild in nominal terms as earnings per share tend to adjust for inflation. There are also likely to be benefits from China reopening and releasing pent-up savings in the region. China’s re-opening is expected to provide a boost to global supply and global demand helping dampen recession in the West. Elsewhere, if wages and salaries adjust for inflation, consumers will likely continue to consume at approximately the same rates, further reducing the chances of a deep recession.
Further geopolitical events leading to deglobalisation could also feed into the inflation headline figure. However, the expectation in the short term is for the high base effects to feed in and economies see a decline in inflation with factors like the war in Ukraine feeding out. In the long to medium term, there could be a reversal with inflation ticking up from base effects or from knock-on effects such as wage inflation.
The UK yield curve has flattened. In the future, we expect the short end of the curve to come down or remain unchanged and the long and medium sections of the curve to rise. The US yield curve has inverted with the market more optimistic on rates than the FOMC members, who continue to warn of the dangers of lowering rates too soon. We expect long term for inflation to hold over 4%.
US equity valuations are still expensive in the technology sector, seemingly priced for low interest rates in the future. This can cause sell-offs if the Federal Reserve does not return to the era of cheap borrowing. The US market may also be susceptible to issues in private equity firms which may not be revaluing their portfolios in line with the market. Most US pension funds have 20% allocated to private equity, so a selloff in the sector could cause contagion to other US sectors.
The UK, Asia and Emerging Markets are attractive from a valuation point of view and continue to offer strong entry points to the market.
The key themes are as follows:
In the Committee’s view, central banks are likely to shift from the previous inflation target of 2% to a higher figure or a floating range, which will most likely be around 3-4%. The amount of economic destruction required to bring inflation back to a 2% target would be too great to be justifiable. Coupled with multiple developed economies (US and Europe) trying to ease the reliance on supply chains from China, inflation is likely to be stickier, although much lower than current levels, than initially thought.
Continuing to hold a globally diversified portfolio of high-quality assets is important to protect and grow the value of savings over the long term and remains the appropriate method for allocation of investor capital. Cash is unattractive as inflationary pressures look to be structurally long-term.
Keith W Thompson
Clarion Group Chairman
March 2023
Creating better lives now and in the future for our clients, their families and those who are important to them.
The chart below shows the historical performance of the Defender Portfolio against a relevant benchmark since the start of the available data.
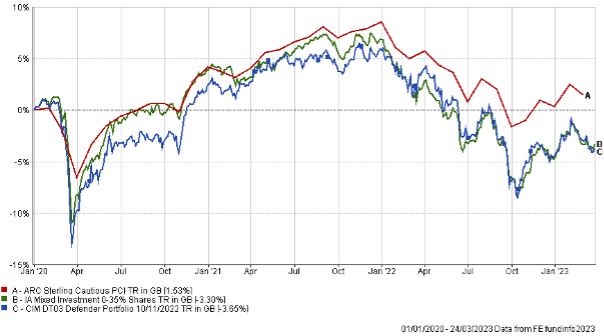
The table below shows the annualised performance to the last quarter end:
| 30/12/21 30/12/20
to to 30/12/22 30/12/21 |
|
| CIM DT03 Defender Portfolio | -9.82% 3.69% |
| ARC Sterling Cautious PCI | -7.39% 4.23% |
| IA Mixed Investment 0-35% Shares | -10.87% 2.84% |
The chart below shows the historical performance of the Prudence Portfolio against a relevant benchmark since the start of the available data.
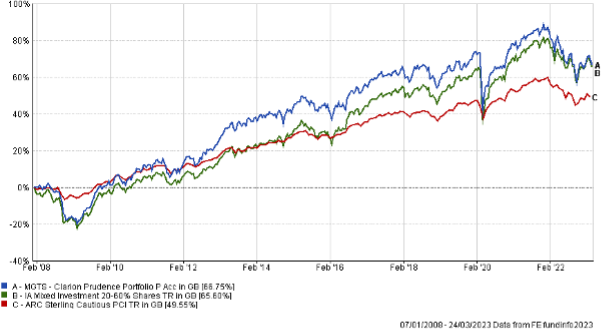
The table below shows the annualised performance to the last quarter end:
| 30/12/21 to 30/12/22 | 30/12/20 to 30/12/21 | 30/12/19 to 30/12/20 | 30/12/18 to 30/12/19 | 30/12/17 to 30/12/18 | |
| MGTS Clarion Prudence P Acc | -11.99% | 5.61% | 2.13% | 12.50% | -5.90% |
| CIM DT04 Prudence Portfolio | -11.87% | 6.28% | 3.05% | 12.13% | -5.23% |
| ARC Sterling Cautious PCI | -7.39% | 4.23% | 4.20% | 8.05% | -3.63% |
| IA Mixed Investment 20-60% Shares | -9.47% | 7.20% | 3.51% | 11.84% | -5.10% |
The chart below shows the historical performance of the Navigator Portfolio against a relevant benchmark since the start of the available data.
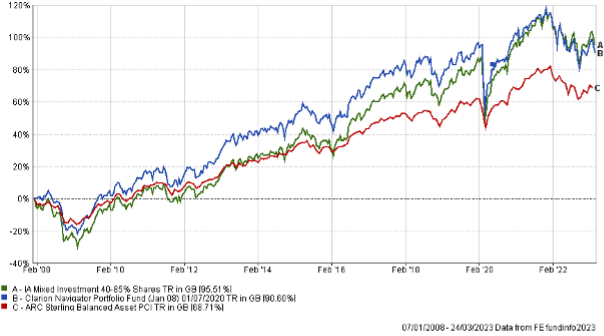
The table below shows the annualised performance to the last quarter end:
| 30/12/21
to 30/12/22 |
30/12/20
to 30/12/21 |
|
| MGTS Clarion Navigator P Acc | -12.36% | 7.59% |
| CIM DT05 Navigator Portfolio | -11.74% | 8.22% |
| IA Mixed Investment 40-85% Shares | -10.04% | 10.94% |
ARC Sterling Balanced Asset PCI -8.75% 7.64%
The chart below shows the historical performance of the Meridian Portfolio against a relevant benchmark since the start of the available data.
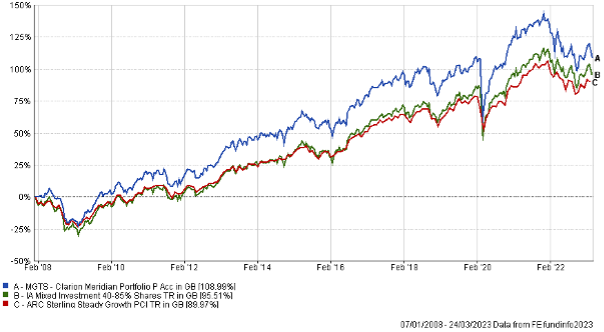
The table below shows the annualised performance to the last quarter end:
| 30/12/21 to 30/12/22 | 30/12/20 to 30/12/21 | 30/12/19 to 30/12/20 | 30/12/18 to 30/12/19 | 30/12/17 to 30/12/18 | |
| MGTS Clarion Meridian P Acc | -13.24% | 8.25% | 6.15% | 15.51% | -7.84% |
| CIM DT06 Meridian Portfolio | -12.58% | 9.02% | 7.39% | 15.67% | -6.89% |
| ARC Steady Growth PCI | -9.76% | 10.24% | 4.56% | 15.00% | -5.64% |
| IA Mixed Investment 40-85% Shares | -10.04% | 10.94% | 5.32% | 15.78% | -6.11% |
The chart below shows the historical performance of the Explorer Portfolio against a relevant benchmark since the start of the available data.
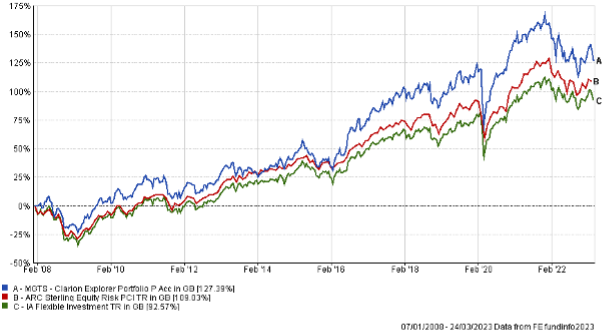
The table below shows the annualised performance to the last quarter end:
| 30/12/21 to 30/12/22 | 30/12/20 to 30/12/21 | 30/12/19 to 30/12/20 | 30/12/18 to 30/12/19 | 30/12/17 to 30/12/18 | |
| MGTS Clarion Explorer P Acc | -13.16% | 8.91% | 9.12% | 16.94% | -6.41% |
| CIM DT07 Explorer Portfolio | -12.90% | 9.72% | 9.83% | 16.31% | -5.61% |
| ARC Equity Risk PCI | -10.86% | 12.31% | 5.82% | 18.04% | -6.50% |
| IA Flexible Investment | -8.98% | 11.30% | 6.70% | 15.66% | -6.72% |
The chart below shows the historical performance of the Voyager Portfolio against a relevant benchmark since the start of the available data.
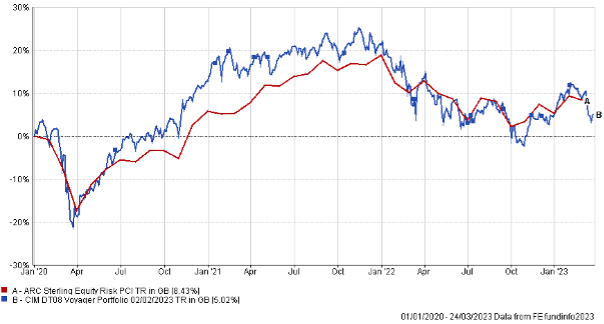
The table below shows the annualised performance to the last quarter end:
| 30/12/21
to 30/12/22 |
30/12/20
to 30/12/21 |
|||||
| CIM DT08 Voyager Portfolio | -13.99% | 7.66% | ||||
| ARC Equity Risk PCI | -10.86% | 12.31% |
The chart below shows the historical performance of the Adventurer Portfolio against a relevant benchmark since the start of the available data.
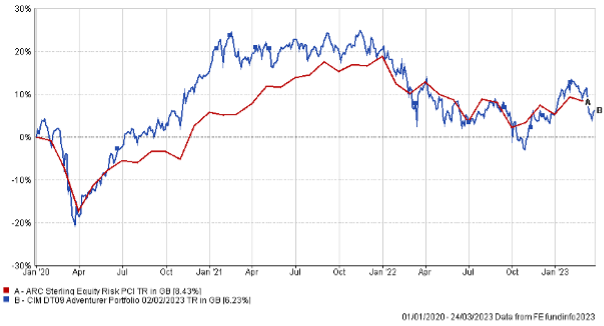
The table below shows the annualised performance to the last quarter end:
| 30/12/21
to 30/12/22 |
30/12/20
to 30/12/21 |
||||
| CIM DT09 Adventurer Portfolio | -12.88% | 4.43% | |||
| ARC Equity Risk PCI | -10.86% | 12.31% |
The chart below shows the historical performance of the Pioneer Portfolio against a relevant benchmark since the start of the available data.
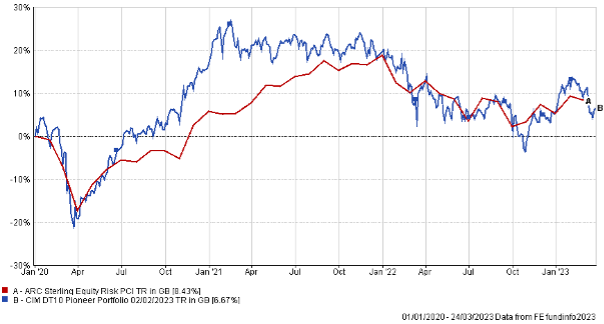
The table below shows the annualised performance to the last quarter end:
| 30/12/21
to 30/12/22 |
30/12/20
to 30/12/21 |
||||
| CIM DT10 Pioneer Portfolio | -12.20% | 2.66% | |||
| ARC Equity Risk PCI | -10.86% | 12.31% |
The content of this article does not constitute financial advice and you may wish to seek professional advice based on your individual circumstances before making any financial decisions.
Any investment performance figures referred to relate to past performance which is not a reliable indicator of future results and should not be the sole factor of consideration when selecting a product or strategy. The value of investments, and the income arising from them, can go down as well as up and is not guaranteed, which means that you may not get back what you invested. Unless indicated otherwise, performance figures are stated in British Pounds. Where performance figures are stated in other currencies, changes in exchange rates may also cause an investment to fluctuate in value.
If you’d like more information about this article, or any other aspect of our true lifelong financial planning, we’d be happy to hear from you. Please call +44 (0)1625 466 360 or email [email protected].
Click here to sign-up to The Clarion for regular updates.