True lifelong financial planning for the serious business of life.
True lifelong financial planning
for the serious business of life.
True lifelong financial planning for the serious business of life.
True lifelong financial planning
for the serious business of life.
Tags: Adventurer Portfolio, Defender Portfolio, Discretionary Investment Management, Explorer Portfolio, funds, investment, Meridian Portfolio, MGTS Clarion Explorer, MGTS Clarion Meridian, MGTS Clarion Prudence, MTGS Clarion Navigator, Navigator Portfolio, Pioneer Portfolio, Prudence Portfolio, Voyager Portfolio
Category:
Investment management
This article provides a brief overview of the topics discussed in the recent investment committee meeting and the decisions made following those discussions.
The following notes summarise the main points discussed by the Investment Committee.
The COP26 conference in Glasgow ended with a whimper as opposed to a bang, due to last-minute changes to the text demanded by Chinese and Indian delegates. The language of coal being “phased out” has been weakened to “phased down”, putting a substantial dent in the goal of limiting global temperature rises to 1.5%.
Royal Dutch Shell announced that it would ask shareholders to approve moving the company headquarters to the UK. Shell has long had an unusual dual share structure, and this would be reduced to a single share if the proposal goes ahead. Concerns over a 15% withholding tax in the Netherlands, and the ability to accelerate share buybacks and other shareholder distributions, are said to be the major factors behind the decision. The decision stands out in stark contrast to media concerns over the outcome of Brexit that companies would choose to leave the UK for the continent as a result.
The possibility of Russia coming to the rescue of continental Europe’s gas shortage took a nosedive as the German Federal Network Agency announced it had suspended certification of the Nord Stream 2 pipeline. This was due to the German subsidiary company not being set up correctly according to German law. UK gas contracts for December rose 10% on the news. The pipeline is politically controversial due to its direct link to Germany under the Baltic Sea, bypassing Eastern Europe. Industry participants are warning of the possibility of rolling blackouts on the continent in a cold winter, and $100 a barrel for crude oil in the near future. Energy prices are proving to be one of the biggest components of rising inflation indices in developed markets, and there is no imminent sign of this trend reversing.
In the US, one of President Biden’s major pieces of legislation was signed into law. Although it is narrower in scope than initially intended, with the remainder of the original proposal still proceeding through the legislative process as the “Build Back Better Act”, the $1.2tn bill marks the first significant infrastructure investment at the US federal level for decades. The $550m set aside for transport infrastructure over the next eight years is long overdue. The 2021 US Infrastructure Report Card, published by the American Society of Civil Engineers, estimates a funding backlog of $786m for road and bridge capital requirements.
US CPI continued its upward trend, rising to 6.2% Year on Year, and marking half a year of inflation at 5% or higher, with the average across the year now above 4%. The Federal Reserve’s inflation measure of choice, Core CPI, which discounts food and energy in its calculation, is also elevated at 4.6% YoY. The Federal Reserve has already announced plans to taper its bond purchases earlier this month and decided to begin reducing the monthly pace of its net asset purchases by $10 billion for Treasury securities and $5 billion for agency mortgage-backed securities. The Fed judges that similar reductions in the pace of net asset purchases will likely be appropriate each month but is prepared to adjust the pace of purchases if warranted by changes in the economic outlook.
This results in a reduction from $70bn to $60bn in monthly Treasury purchases, and $35bn to $30bn in mortgage-backed securities for December, which is akin to a slight touch on the brakes rather than slamming them. The “Taper Tantrum” of 2013 still weighs heavily on policy setters, when yields on Treasuries jumped on the news that the Federal Reserve would reduce its bond purchases in the future. It has benefitted the Federal Reserve that bond markets have been unusually volatile in recent months, with the yield on the 10-year Treasury whipping from c.1.6% in May to c.1.2% during the summer, before pushing back up over 1.6% in the last couple of months. As such, market participants have become more accustomed to swings in yields, and perhaps this meant that the impact of the tapering announcement was less pronounced amongst the wider “noise”.
While the prospect of imminent interest rate rises appears to have somewhat receded, with the Bank of England’s rhetoric falling flat as only two of the nine MPC members voted for a rise in November’s meeting, the inevitable reality of tapering will hit bond markets in due course. With inflation still running hot in Western economies, a yield of c.1% against CPI at 4% plus will look increasingly unattractive to bond investors, who should demand a higher premium for the risk involved. With yields likely to rise, longer-dated bonds, which are more sensitive to changes in financial conditions due to their increased duration (a measure of sensitivity to movements in bond yields) ought to underperform against short-dated bonds, which have a lower sensitivity to changes in bond yields. The Investment Committee has tilted the bond allocation within the Clarion Portfolio Funds and model portfolios towards the shorter end of the yield curve accordingly.
UK equities remain an attractive space in which to allocate capital on a relative valuation basis, in comparison to other developed equity markets. UK equities continue to trade at a deep historical discount, with many strong global companies apparently penalised for being listed on the wrong stock exchange. The extensive activity of private equity in acquiring UK listed companies in recent months demonstrates the opportunities on offer for the patient investor.
Within the FTSE 100, many of the companies generate revenue from overseas and should benefit from global trade re-opening. The preponderance of financials, energy and miners throughout the FTSE indices also ought to aid the UK in relative outperformance as trade continues its recovery. The Investment Committee continue to increase the allocation to the UK across the Portfolio Funds and model portfolios as a result.
The US equity markets have powered on to new all-time highs, with the S&P 500 having hit 65 record closes this year already. This is fast catching up to the record set in 1995 of 77 record closes and marks only the seventh time 50+ record closes have been recorded in a calendar year. It is hard to see how the exponential rise can continue indefinitely. Valuations are sufficiently stretched that justifying price to earnings ratios of some stocks is becoming increasingly implausible. The reversal of central bank support propping up credit markets and reducing borrowing costs should impact the ability of some companies to invest and refinance. Prospects of new regulations for big US tech giants also cast a shadow on the future of their profitability. The Investment Committee, therefore, maintain an underweight position accordingly and remain vigilant on the selection of US-focused funds.
For a fuller version of Clarion’s Economic and Stock Market Commentary, written by Clarion Group Chairman Keith Thompson, please click here.
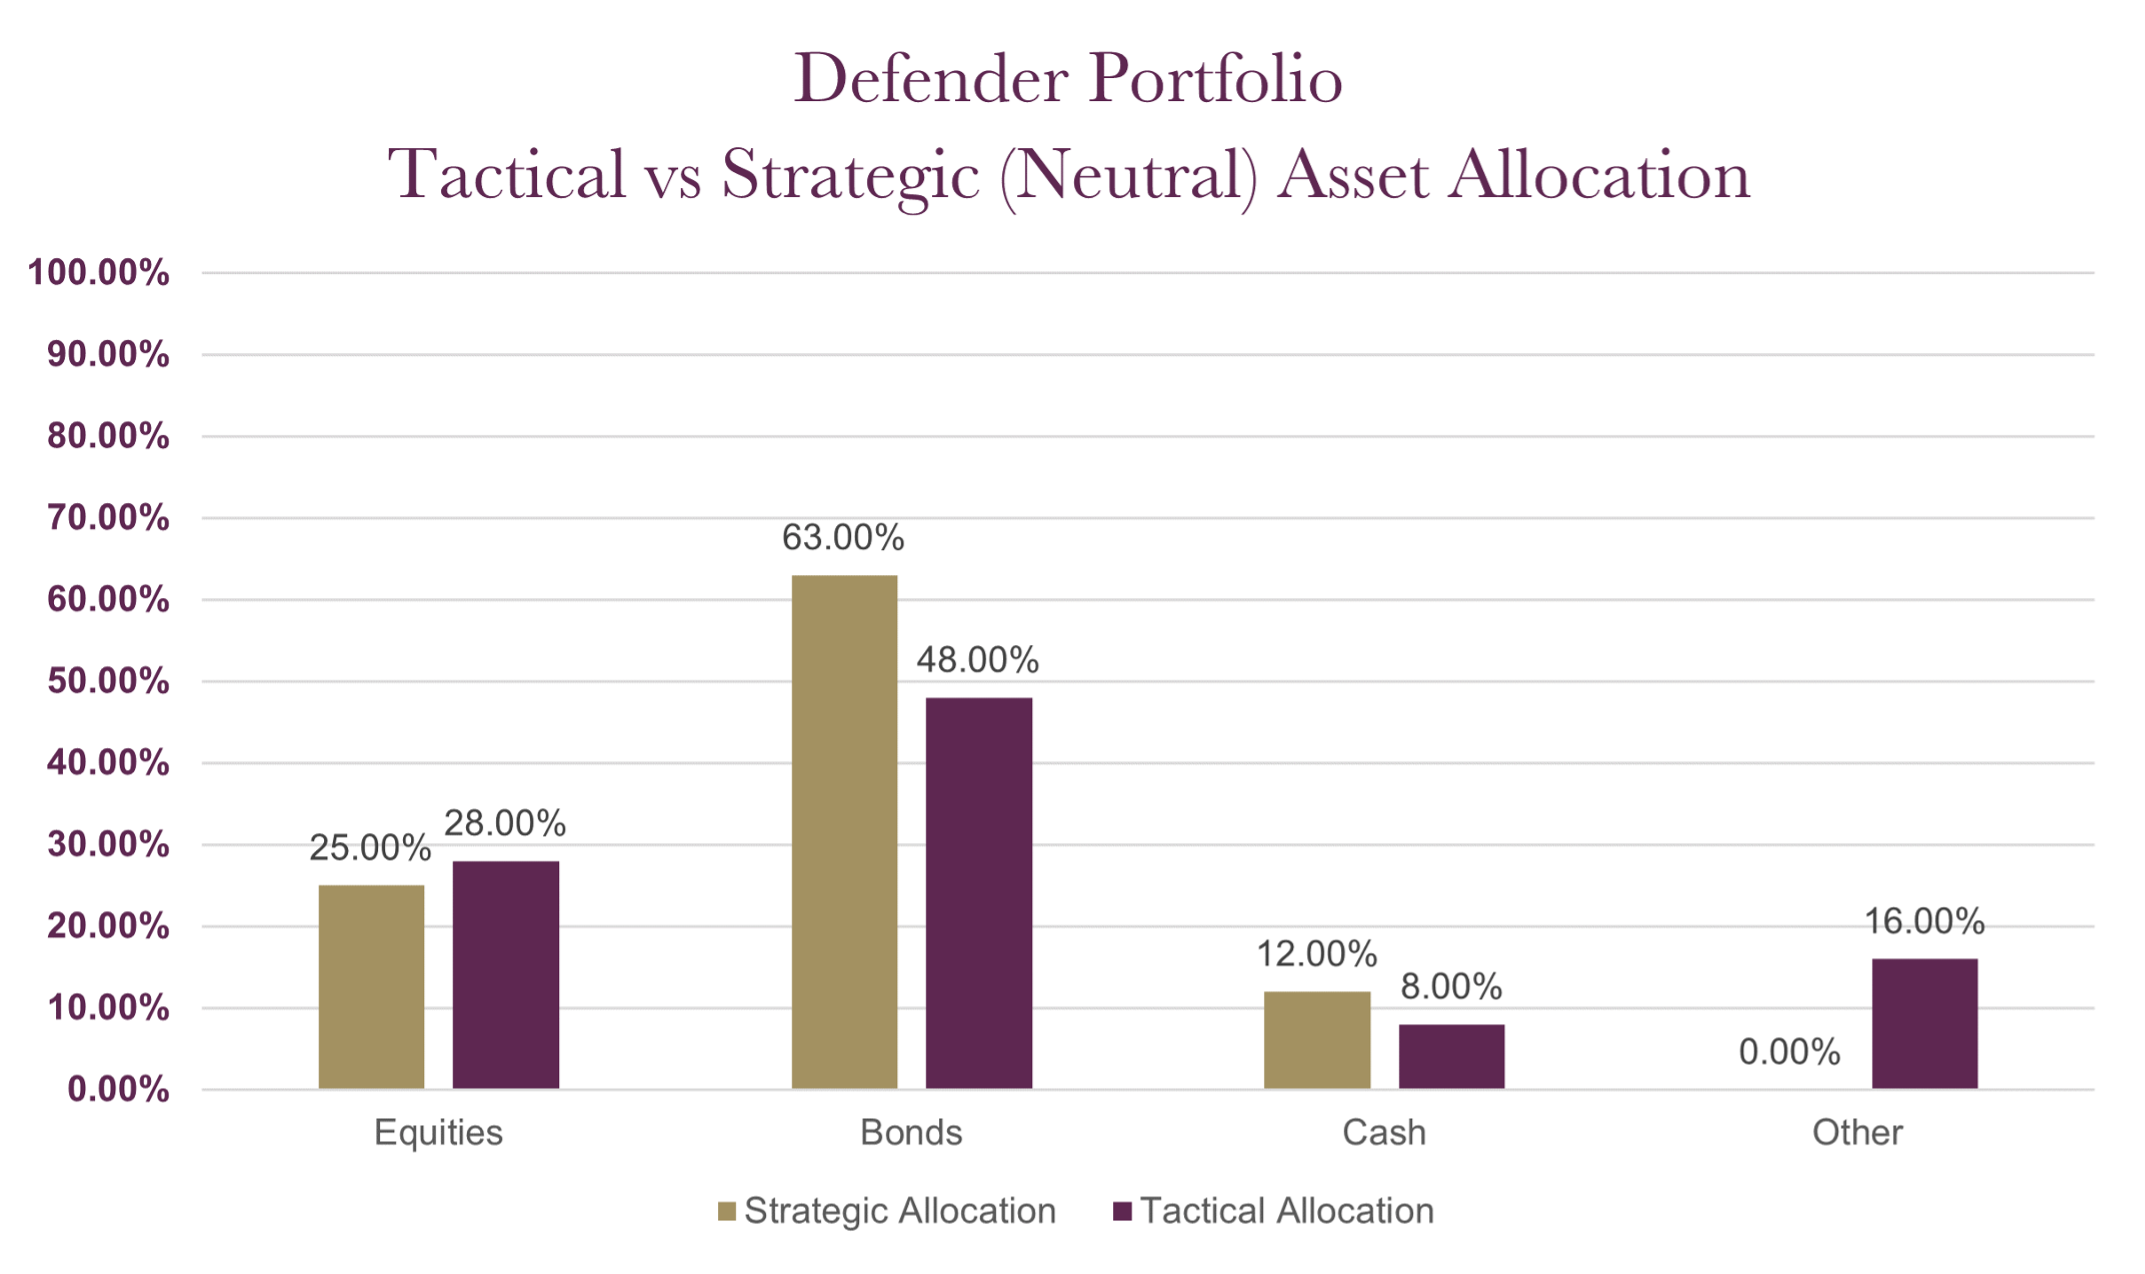
The charts below show the tactical asset allocation of the Defender Portfolio against the neutral/strategic asset allocation as well as the historical performance of the portfolio against a relevant benchmark since the start of the available data.
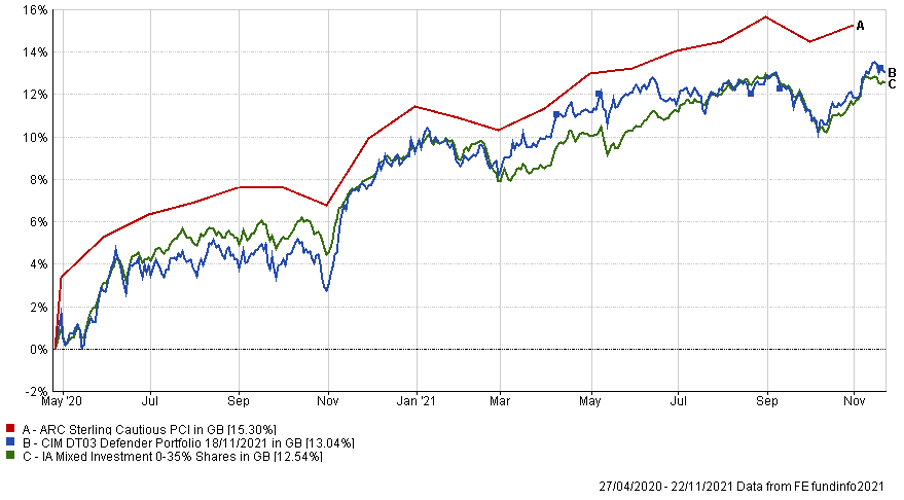
The table below shows the annualised performance to the last quarter end:
| 30/09/20 to 30/09/21 | |
| CIM DT03 Defender Portfolio | 5.69% |
| ARC Sterling Cautious PCI | 7.42% |
| IA Mixed Investment 0-35% Shares | 6.02% |
Changes to the Defender model
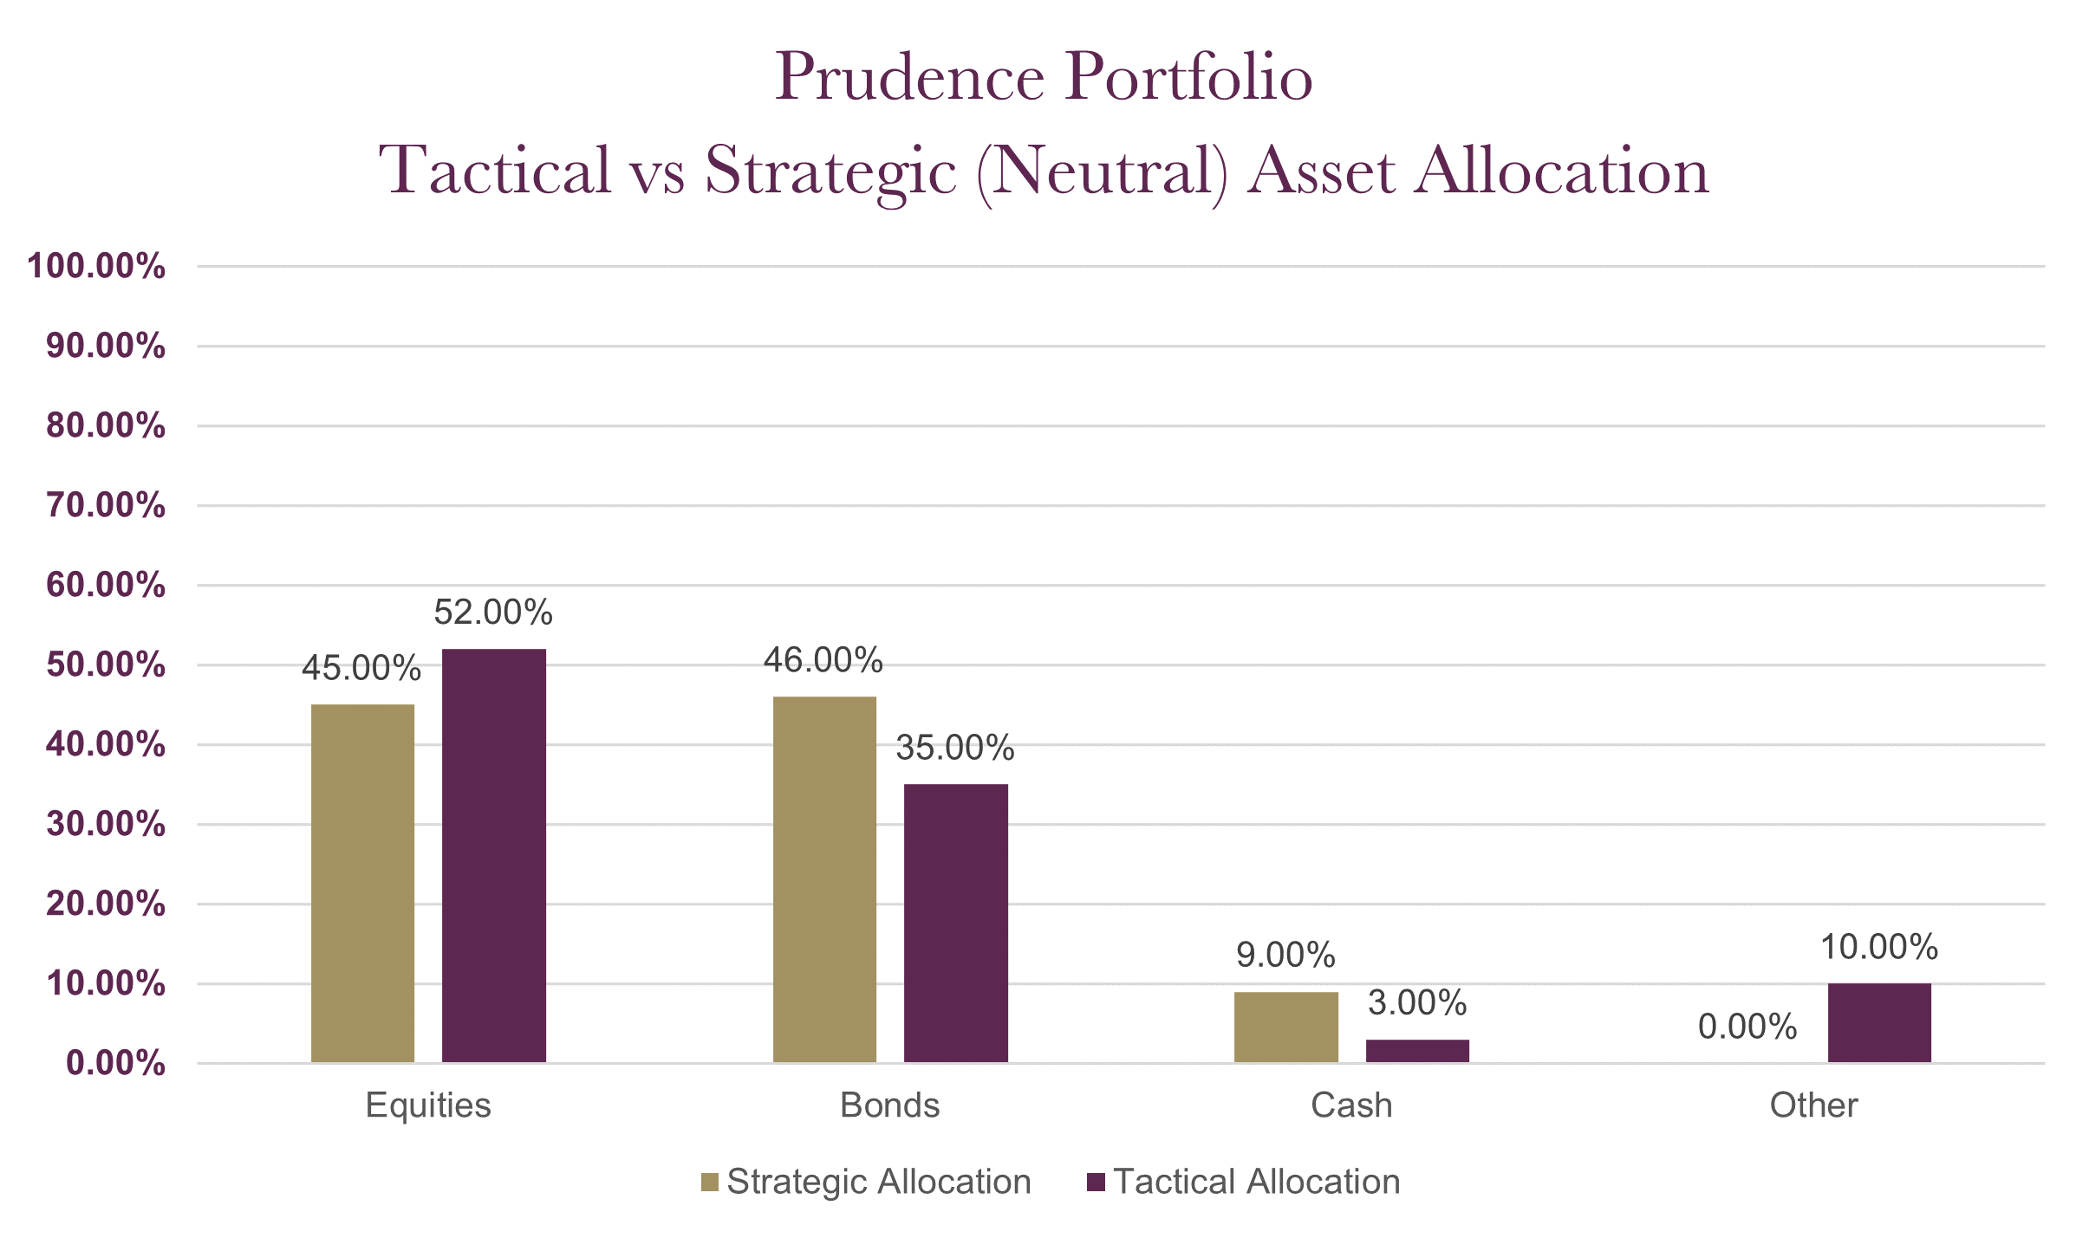
The charts below show the tactical asset allocation of the Prudence Portfolio against the neutral/strategic asset allocation as well as the historical performance of the portfolio against a relevant benchmark(s) since the start of the available data.
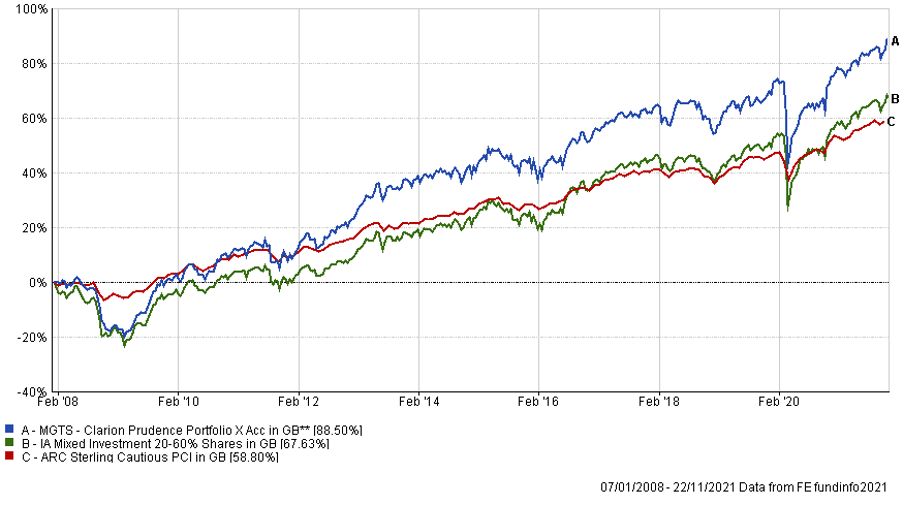
The table below shows the annualised performance to the last quarter end:
| 30/09/20 to 30/09/21 | 30/09/19 to 30/09/20 | 30/09/18 to 30/09/19 | 30/09/17 to 30/09/18 | 30/09/16 to 30/09/17 | |
| MGTS Clarion Prudence X Acc | 11.63% | -2.00% | 1.83% | 2.90% | 4.77% |
| CIM DT04 Prudence Portfolio | 11.66% | -1.23% | 2.54% | 2.93% | |
| ARC Sterling Cautious PCI | 5.69% | 1.52% | 3.40% | 1.29% | 3.86% |
| IA Mixed Investment 20-60% Shares | 12.21% | -1.19% | 4.01% | 2.60% | 6.15% |
Changes to the Prudence fund & model
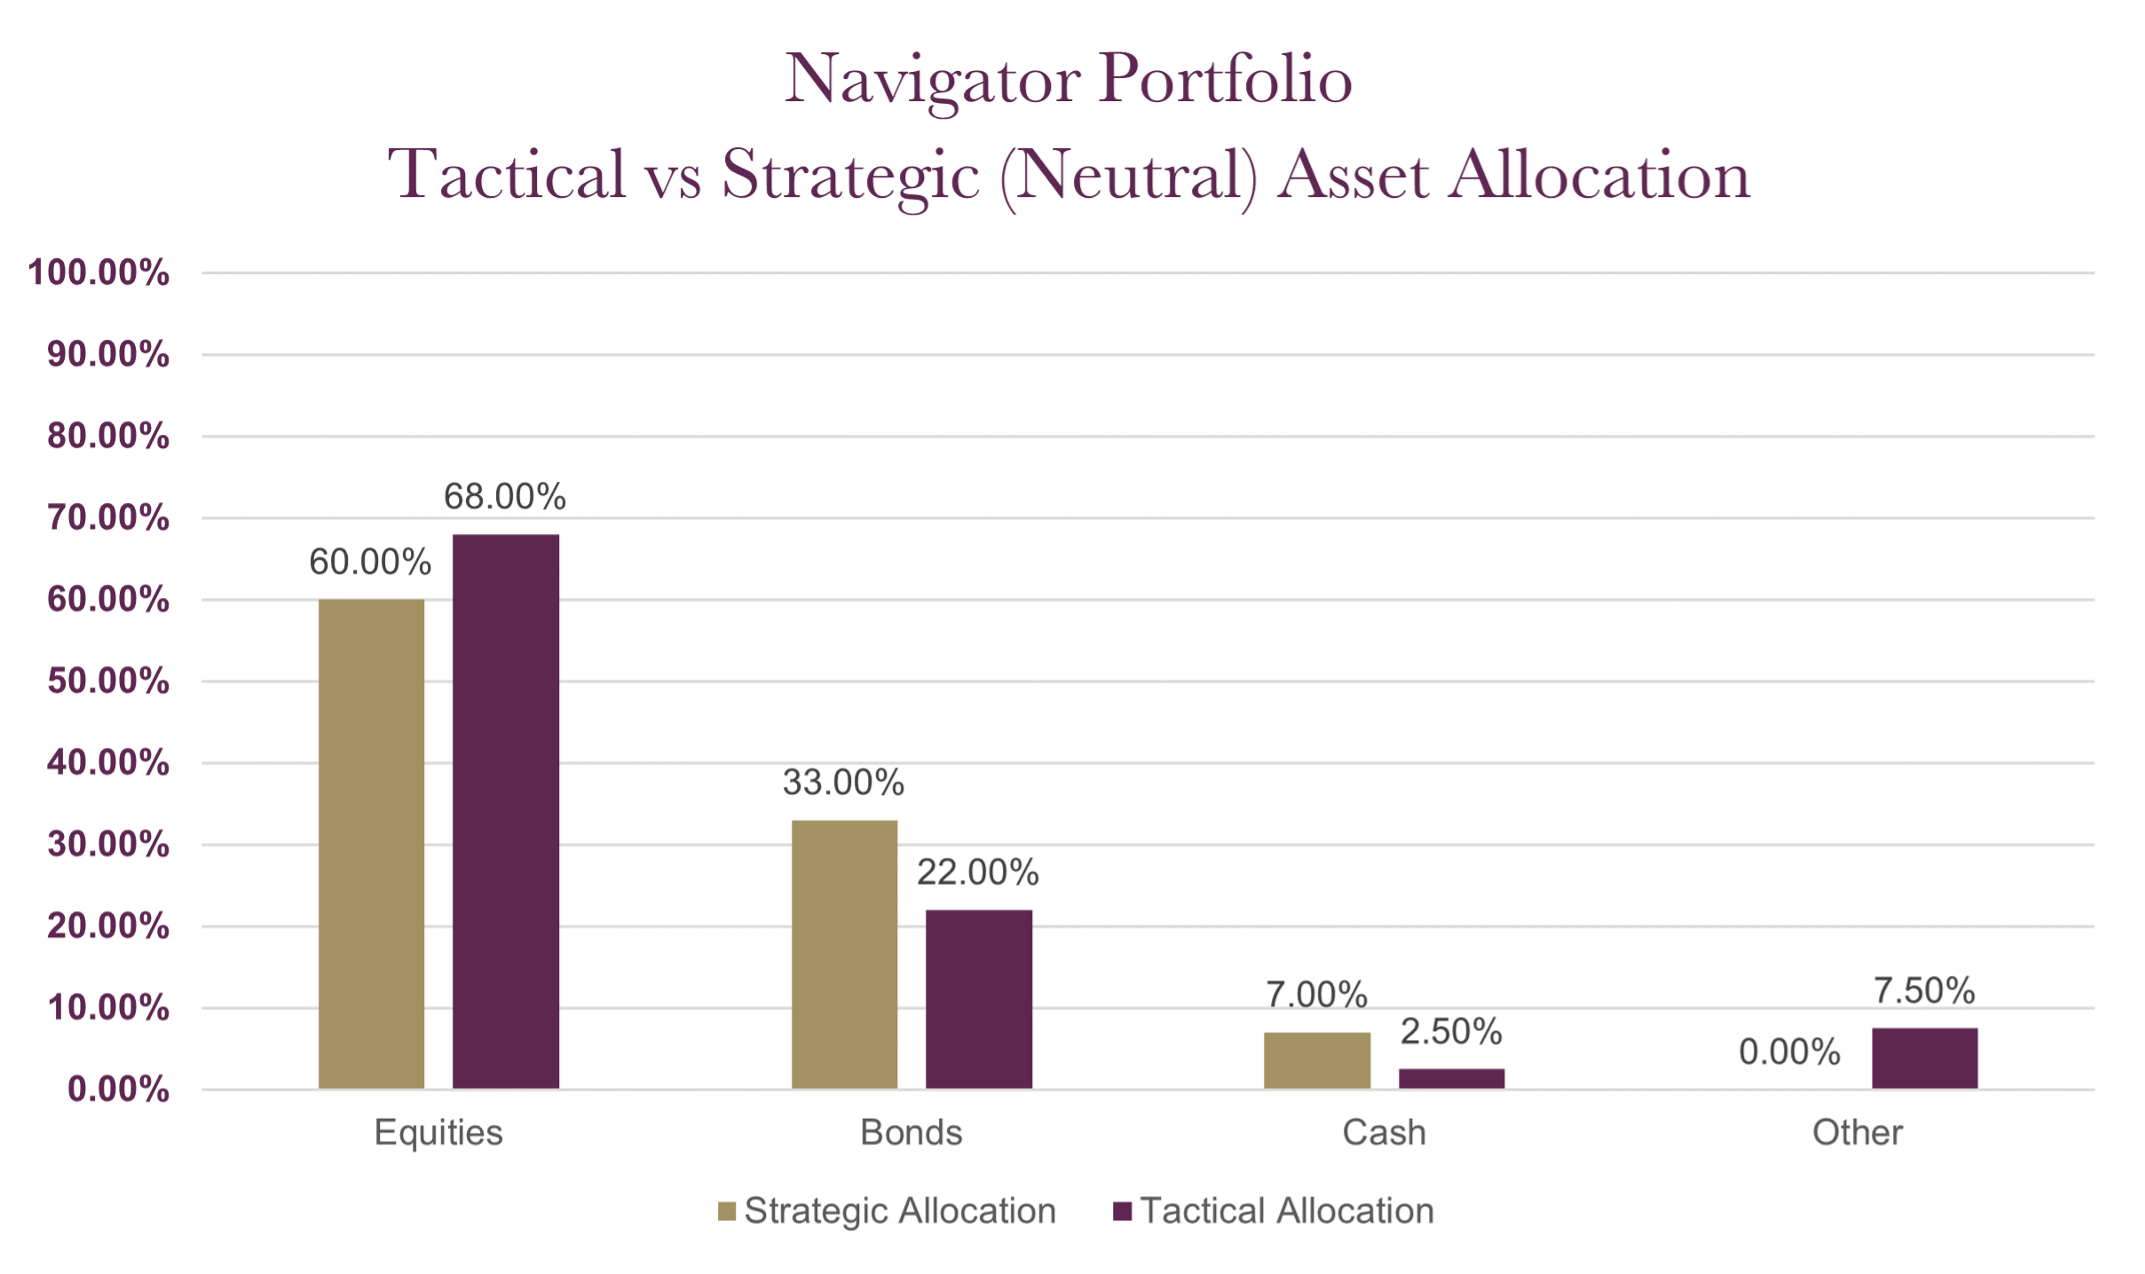
The charts below show the tactical asset allocation of the Navigator Portfolio against the neutral/strategic asset allocation as well as the historical performance of the portfolio against a relevant benchmark(s) since the start of the available data.
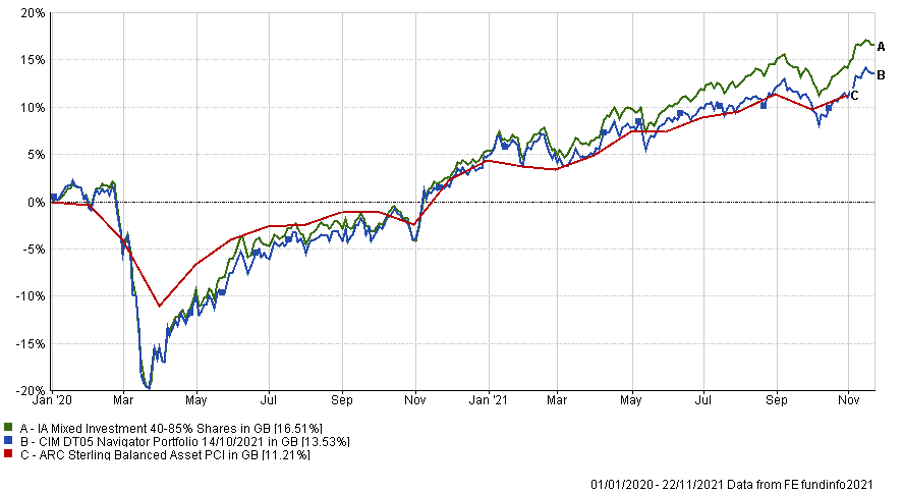
The table below shows the annualised performance to the last quarter end:
| 30/09/20 to 30/09/21 | |
| MGTS Clarion Navigator X Acc | 14.17% |
| CIM DT05 Navigator Portfolio | 14.32% |
| IA Mixed Investment 40-85% Shares | 16.63% |
Changes to the Navigator fund & model
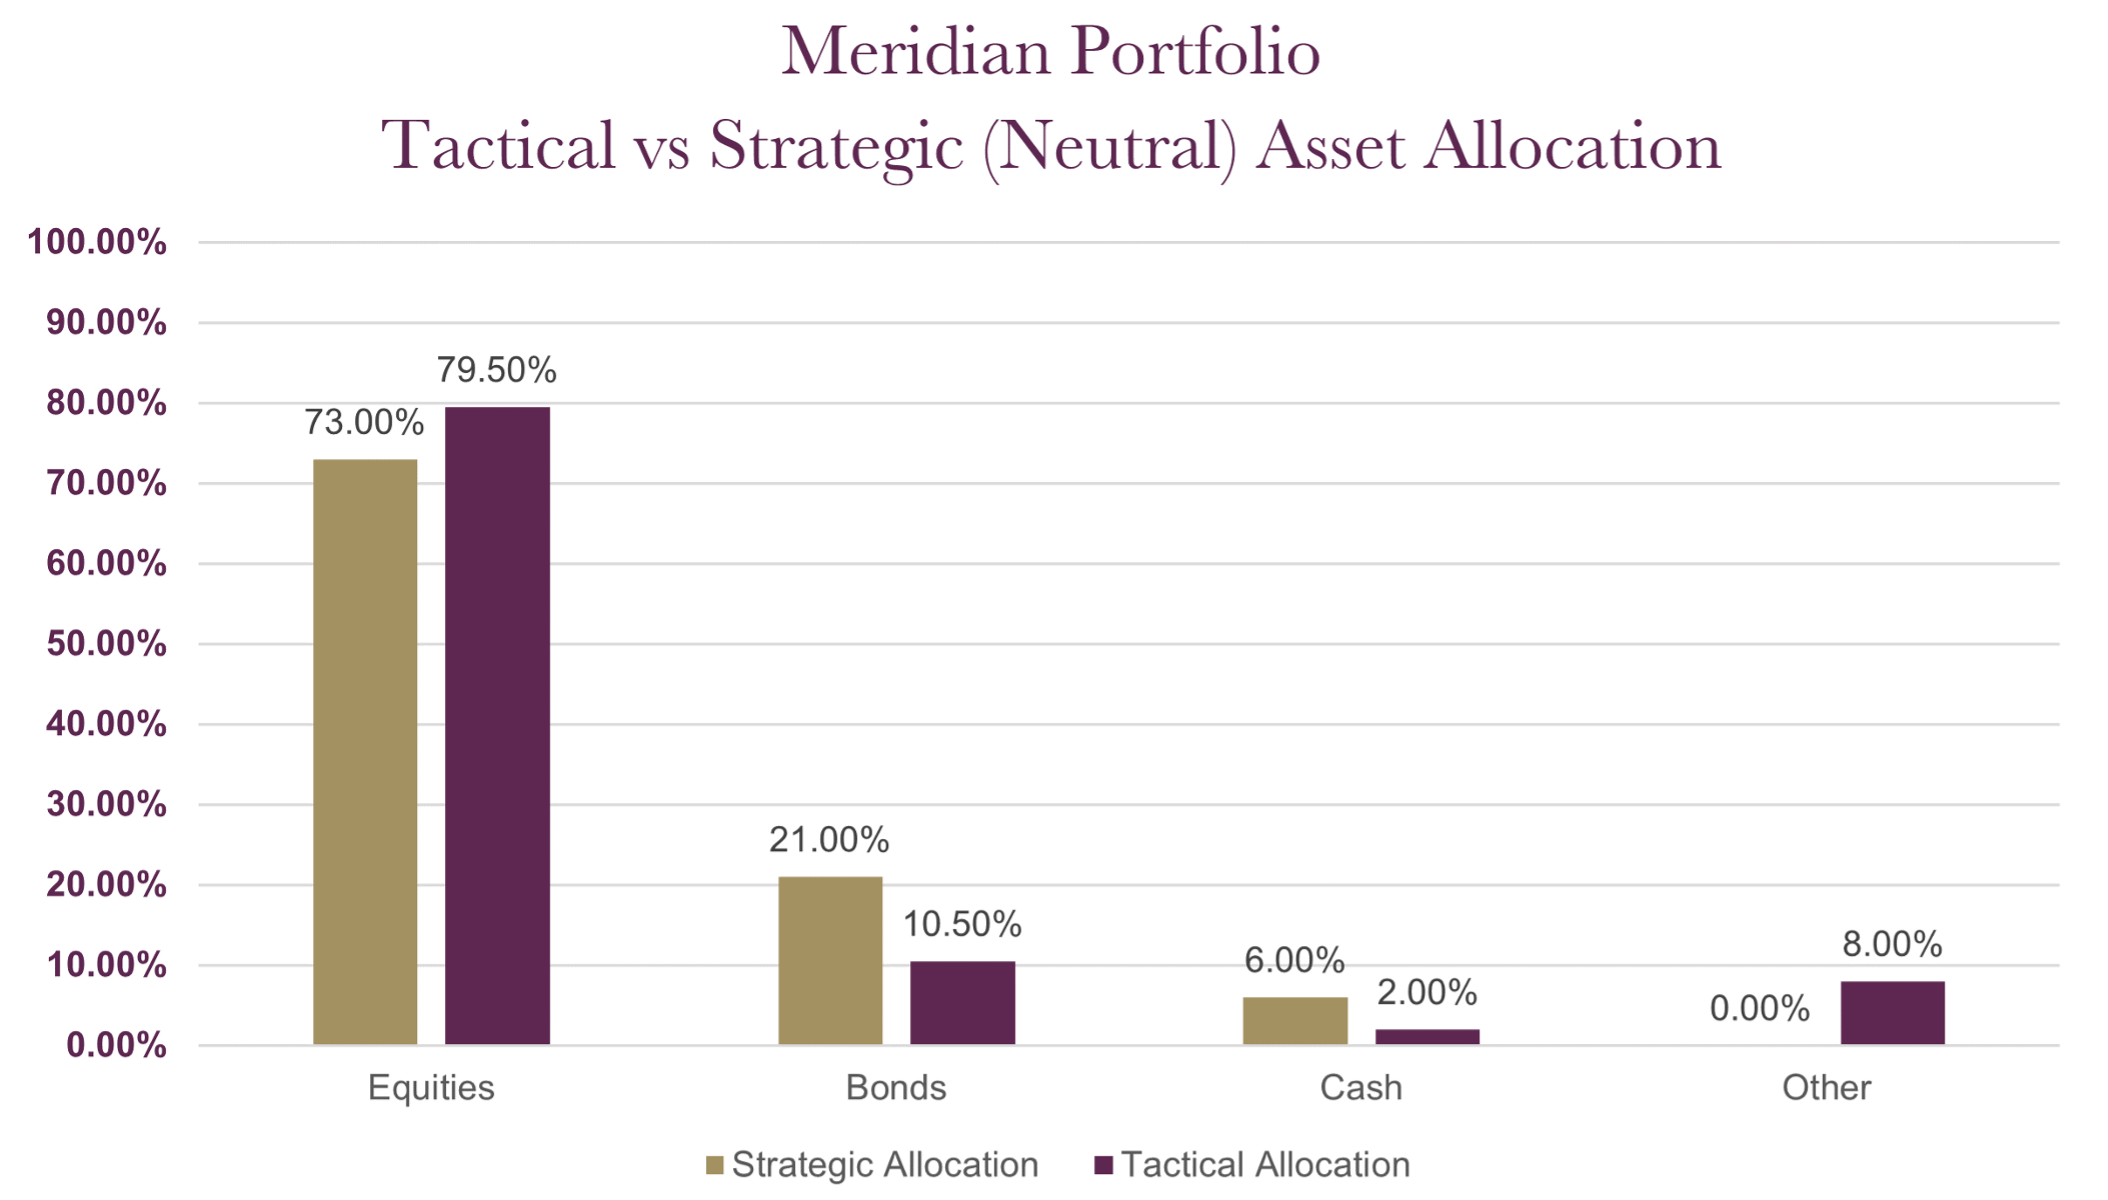
The charts below show the tactical asset allocation of the Meridian Portfolio against the neutral/strategic asset allocation as well as the historical performance of the portfolio against a relevant benchmark(s) since the start of the available data.
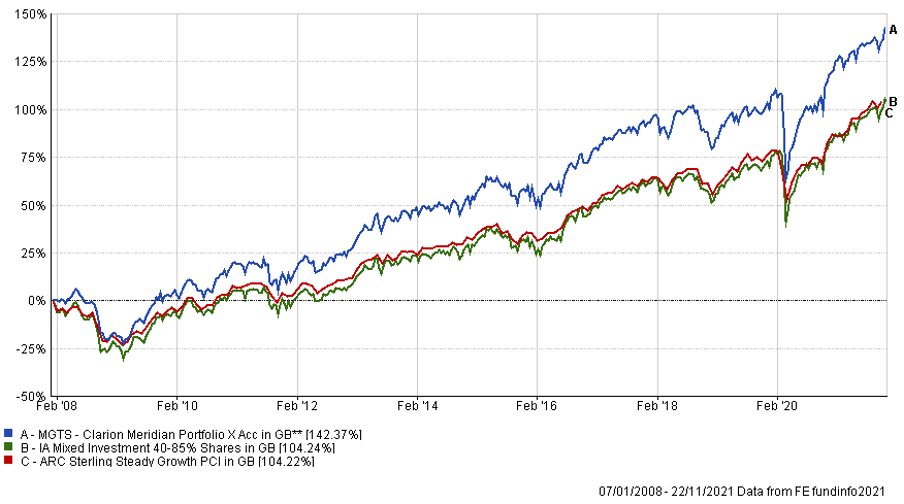
The table below shows the annualised performance to the last quarter end:
| 30/09/20 to 30/09/21 | 30/09/19 to 30/09/20 | 30/09/18 to 30/09/19 | 30/09/17 to 30/09/18 | 30/09/16 to 30/09/17 | |
| MGTS Clarion Meridian X Acc | 16.76% | 0.00% | 0.99% | 6.39% | 8.49% |
| CIM DT06 Meridian Portfolio | 17.08% | 0.93% | 3.36% | 5.31% | |
| ARC Steady Growth PCI | 14.43% | -0.16% | 3.82% | 5.15% | 8.67% |
| IA Mixed Investment 40-85% Shares | 16.63% | -0.19% | 4.20% | 5.35% | 9.09% |
Changes to the Meridian fund & model
The charts below show the tactical asset allocation of the Explorer Portfolio against the neutral/strategic asset allocation as well as the historical performance of the portfolio against a relevant benchmark(s) since the start of the available data.
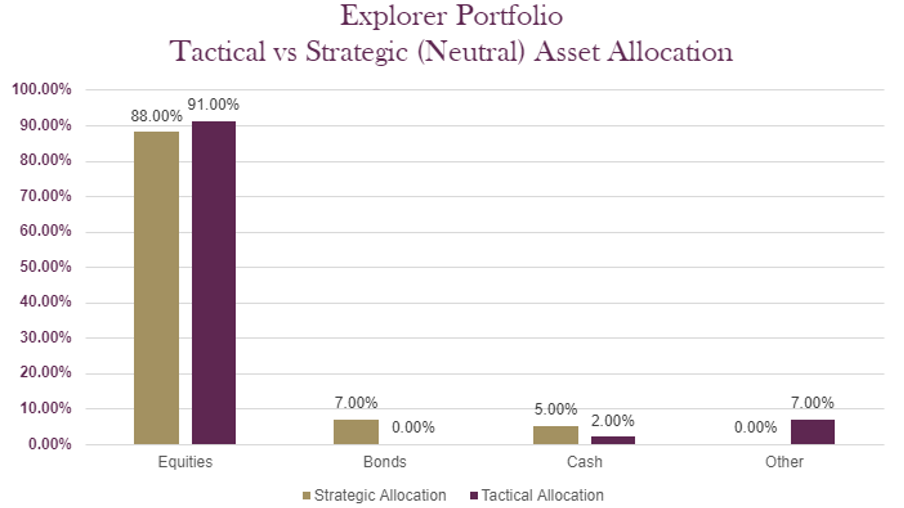
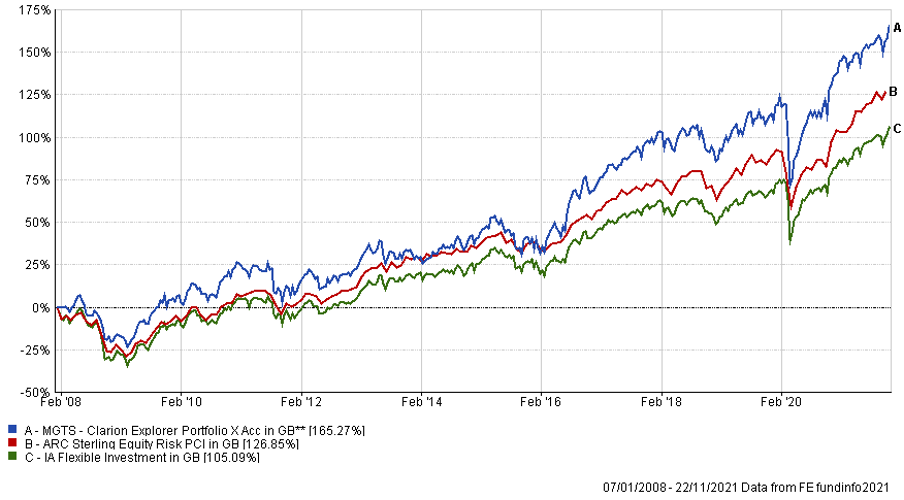
The table below shows the annualised performance to the last quarter end:
| 30/09/20 to 30/09/21 | 30/09/19 to 30/09/20 | 30/09/18 to 30/09/19 | 30/09/17 to 30/09/18 | 30/09/16 to 30/09/17 | |
| MGTS Clarion Explorer X Acc | 18.75% | 0.86% | 4.48% | 8.58% | 10.86% |
| CIM DT07 Explorer Portfolio | 19.03% | 1.21% | 3.97% | 9.27% | |
| ARC Equity Risk PCI | 19.10% | -0.25% | 3.84% | 6.53% | 10.69% |
| IA Flexible Investment | 18.30% | 0.88% | 3.24% | 5.37% | 10.53% |
Changes to the Explorer fund & model
The charts below show the tactical asset allocation of the Voyager Portfolio against the neutral/strategic asset allocation as well as the historical performance of the portfolio against a relevant benchmark(s) since the start of the available data.
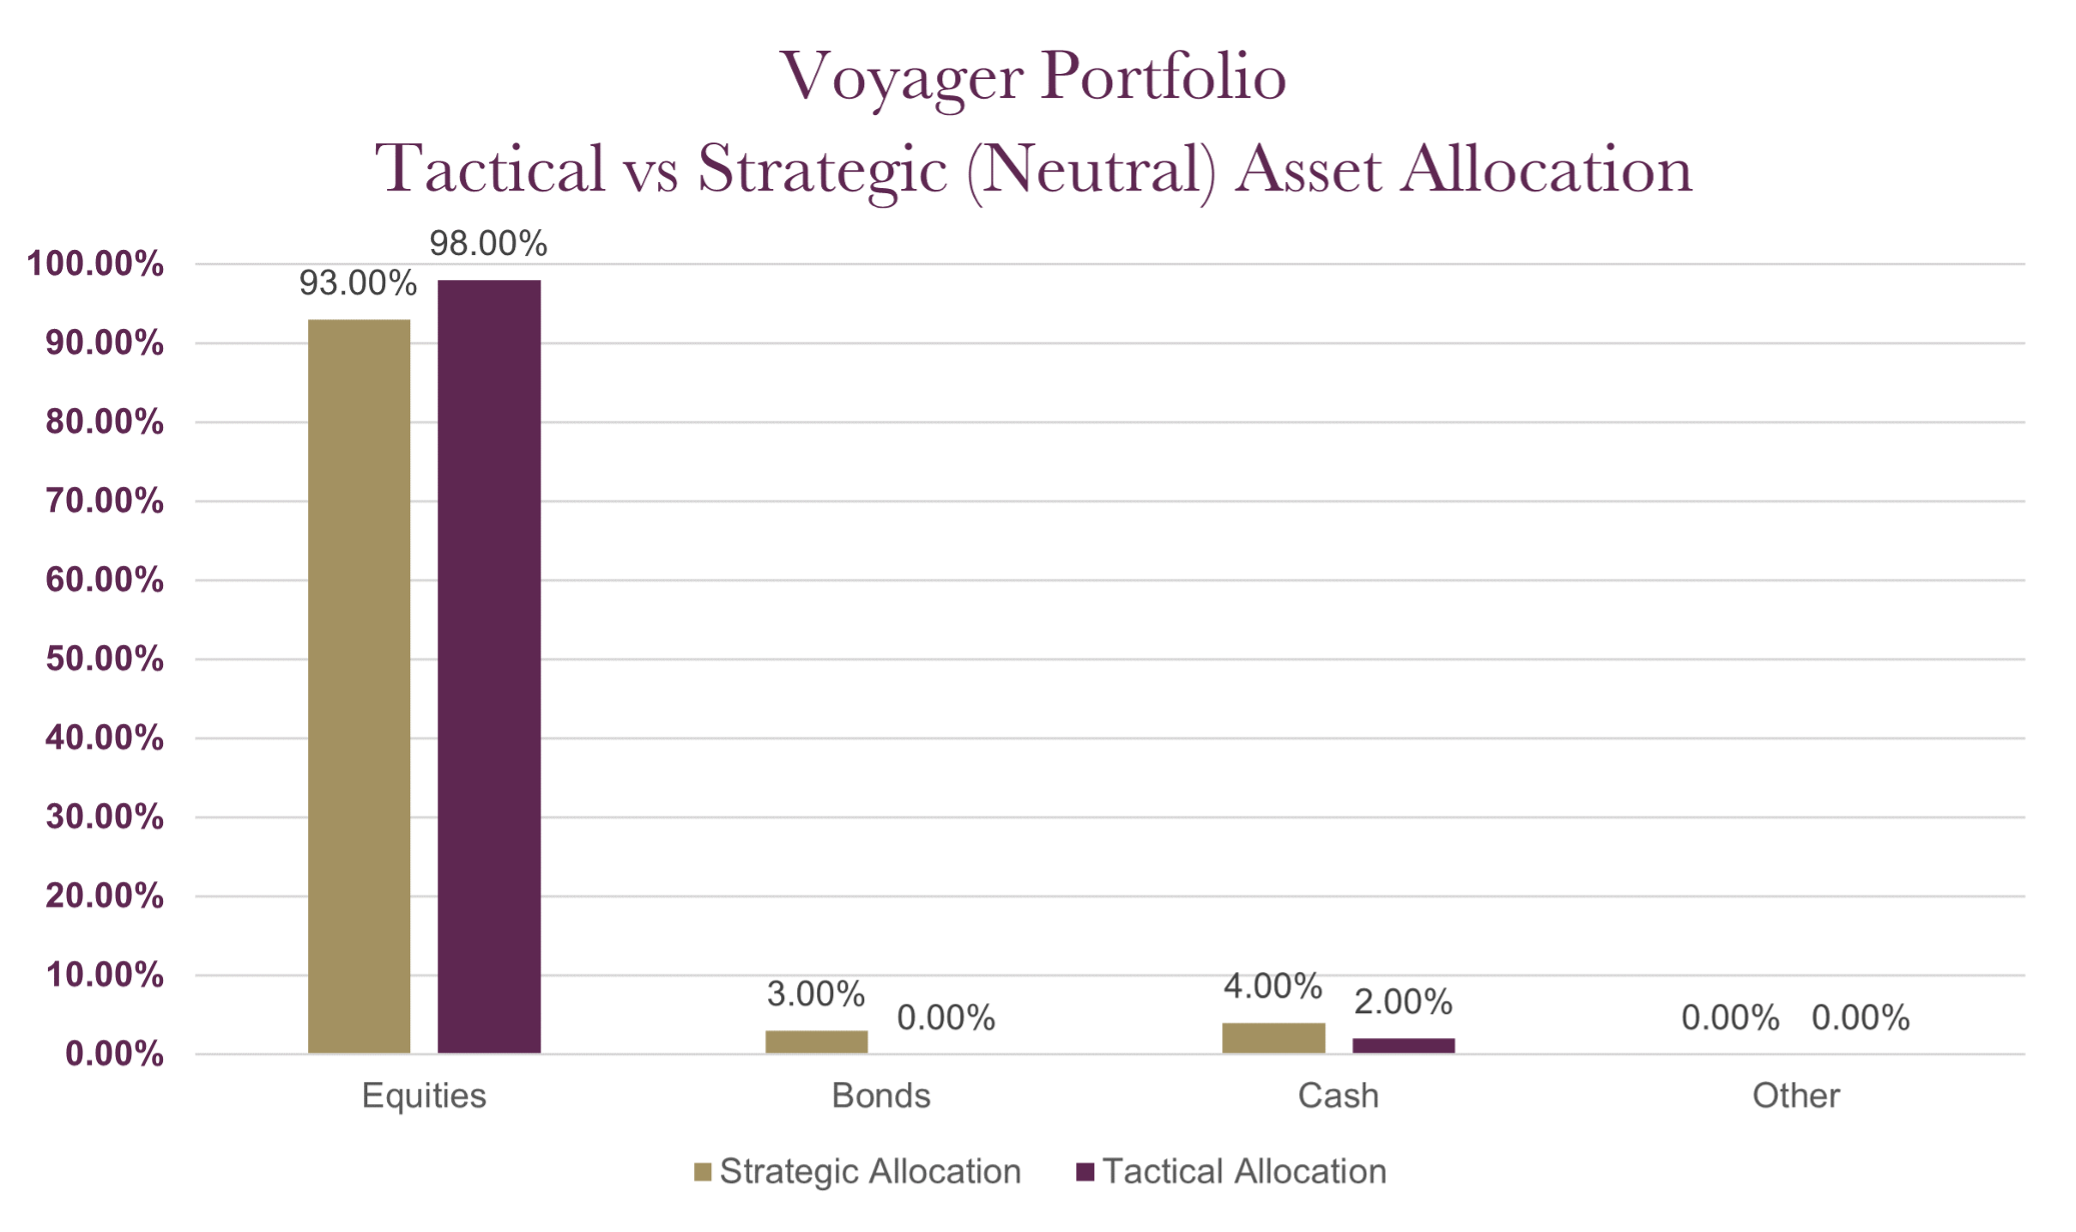
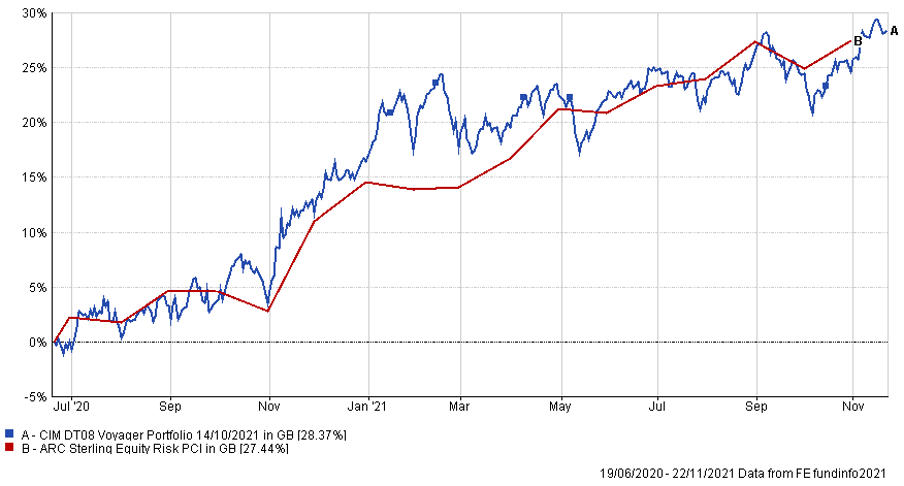
The table below shows the annualised performance to the last quarter end:
| 30/09/20 to 30/09/21 | 30/09/19 to 30/09/20 | 30/09/18 to 30/09/19 | 30/09/17 to 30/09/18 | 30/09/16 to 30/09/17 | |
| CIM DT08 Voyager Portfolio | 19.86% | ||||
| ARC Equity Risk PCI | 19.10% | -0.25% | 3.84% | 6.53% | 10.69% |
Changes to the Voyager fund & model
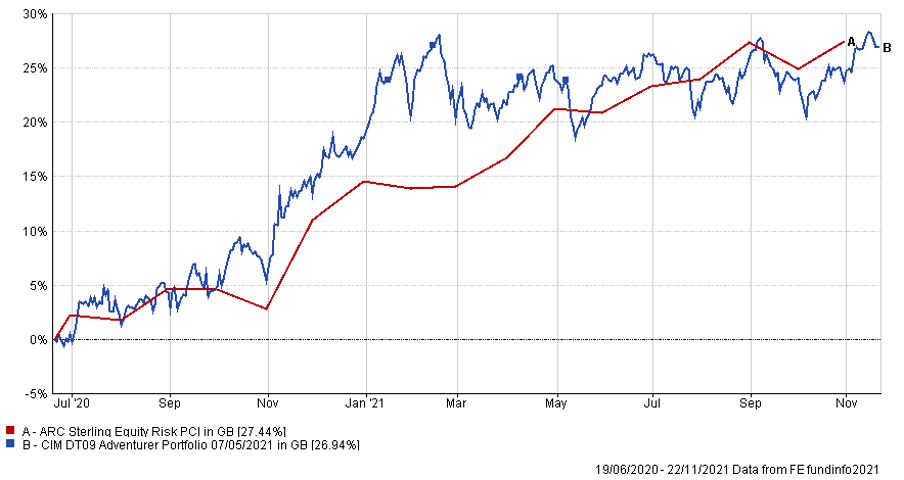
The charts below show the tactical asset allocation of the Adventurer Portfolio against the neutral/strategic asset allocation as well as the historical performance of the portfolio against a relevant benchmark(s) since the start of the available data.
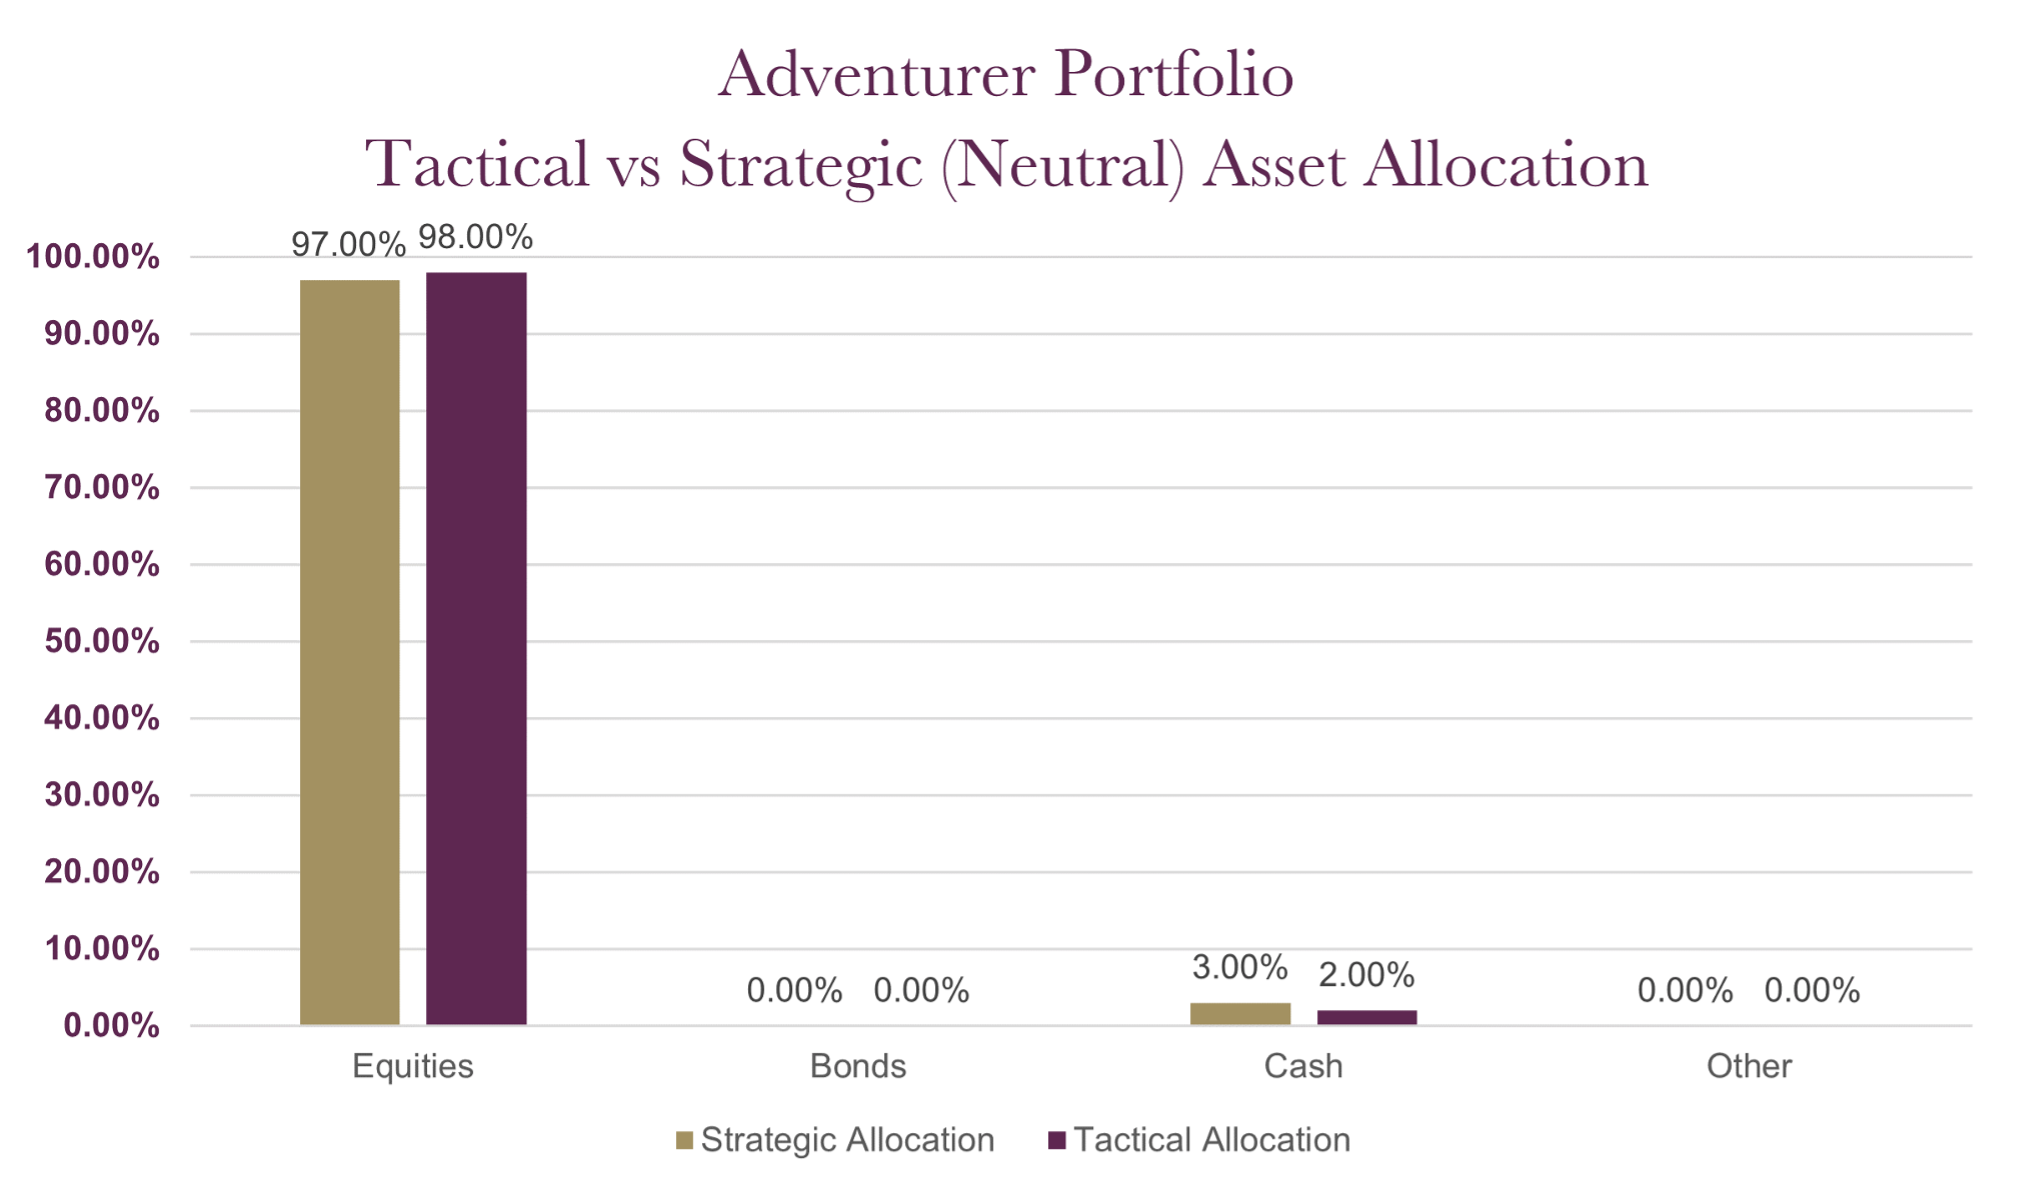
The table below shows the annualised performance to the last quarter end:
| 30/09/20 to 30/09/21 | 30/09/19 to 30/09/20 | 30/09/18 to 30/09/19 | 30/09/17 to 30/09/18 | 30/09/16 to 30/09/17 | |
| CIM DT09 Adventurer Portfolio | 18.33% | ||||
| ARC Equity Risk PCI | 19.10% | -0.25% | 3.84% | 6.53% | 10.69% |
Changes to the Adventurer model
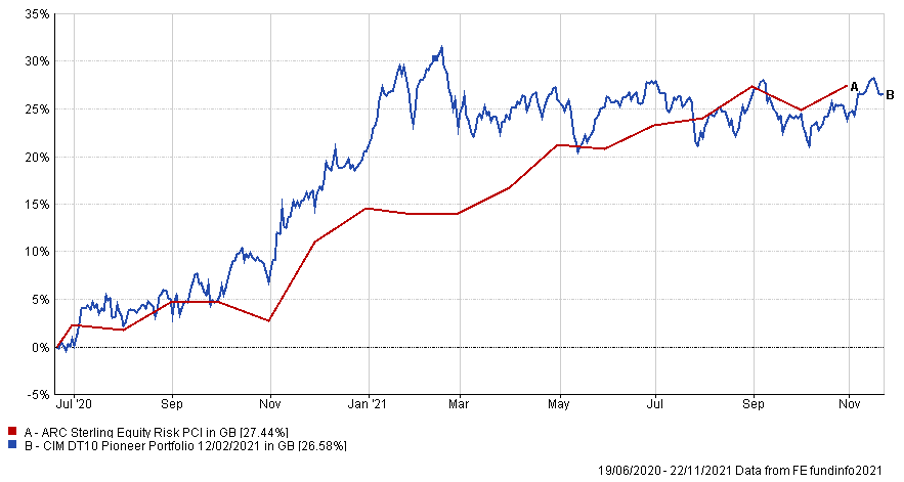
The charts below show the tactical asset allocation of the Pioneer Portfolio against the neutral/strategic asset allocation as well as the historical performance of the portfolio against a relevant benchmark(s) since the start of the available data.
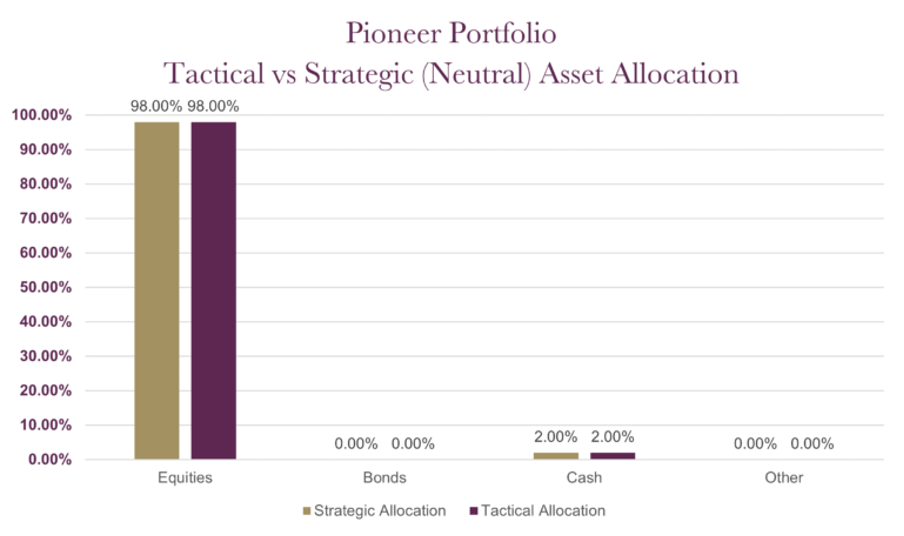
The table below shows the annualised performance to the last quarter end:
| 30/09/20 to 30/09/21 | 30/09/19 to 30/09/20 | 30/09/18 to 30/09/19 | 30/09/17 to 30/09/18 | 30/09/16 to 30/09/17 | |
| CIM DT10 Pioneer Portfolio | 18.18% | ||||
| ARC Equity Risk PCI | 19.10% | -0.25% | 3.84% | 6.53% | 10.69% |
Changes to the Pioneer model
Any investment performance figures referred to relate to past performance which is not a reliable indicator of future results and should not be the sole factor of consideration when selecting a product or strategy. The value of investments, and the income arising from them, can go down as well as up and is not guaranteed, which means that you may not get back what you invested. Unless indicated otherwise, performance figures are stated in British Pounds. Where performance figures are stated in other currencies, changes in exchange rates may also cause an investment to fluctuate in value.
If you’d like more information about this article, or any other aspect of our true lifelong financial planning, we’d be happy to hear from you. Please call +44 (0)1625 466 360 or email [email protected].
Click here to sign-up to The Clarion for regular updates.