True lifelong financial planning for the serious business of life.
True lifelong financial planning
for the serious business of life.
True lifelong financial planning for the serious business of life.
True lifelong financial planning
for the serious business of life.
Tags: Adventurer Portfolio, Defender Portfolio, Discretionary Investment Management, Explorer Portfolio, funds, investment, Meridian Portfolio, MGTS Clarion Explorer, MGTS Clarion Meridian, MGTS Clarion Prudence, MTGS Clarion Navigator, Navigator Portfolio, Pioneer Portfolio, Prudence Portfolio, Voyager Portfolio
Category:
Investment management
The Clarion Investment Committee met on the 10th November. The following notes summarise the main points of consideration in the Investment Committee discussions.
The following notes summarise the key points discussed by the investment committee at the meeting on the 10th of November. (These notes are as at the date of the Investment Committee, since which time we have had the much-anticipated Autumn Budget Statement from the UK Chancellor. The broad themes of this Statement, a programme of fiscal tightening by a combination of increased taxation and spending cuts, have been well telegraphed as being a “Balanced plan to Stability”. The implications of the tax increases and spending cuts have been factored into the committee’s investment decisions & strategy.)
Europe has stepped up imports of liquid natural gas (LNG) from Qatar, the US, Nigeria and Algeria. Pipeline supply of gas from Norway has risen while Germany has brought back idled brown coal production and pushed back the planned closure of nuclear power plants. EU production of electricity from solar and wind rose at record rates between March and September.
For a fuller version of Clarion’s Economic and Stock Market Commentary, written by Clarion Group Chairman Keith Thompson, please click here
Bonds continue to look poor value as inflation remains high and there are no apparent signs of policy tightening slowing, with the Federal Reserve and Bank of England hiking at 75 basis points in their last policy meetings. Central bank balance sheet reductions are in progress which will impact long dated bonds with additional quantities to trade and fewer buyers. The medium-term end of the yield curve trades at attractive yields with reduced impact from external factors, and the investment committee prioritise capital allocation accordingly.
US equities continue to demonstrate a disparity between the mega-cap tech stocks at the top of the major indices and the more robust domestically focused companies further down the market cap. Tech stocks continue their slow bleeding from elevated multiples and have given back their outperformance from the pandemic in the tighter financial conditions. With the dollar strong against other currencies and consumer sentiment and spending still positive, domestically focused equities in the US look appealing. The committee continue to focus on this area of the US market.
UK equities continue to trade at a discount to other developed equity markets, with many attractive companies capable of withstanding tough conditions (e.g., dividend cover ratio for the FTSE 100 is projected at over 2 for the next two years). The possibility of recession appears priced in and any surprise in economic conditions to the upside could see a sharp recovery. The committee continue to overweight UK equities on this basis.
Asia Pacific equities offer a contrarian opportunity with the divergence of central bank policy in the region compared to tightening conditions elsewhere. Short-term headwinds are evident in China’s Zero-Covid policy and the decline of the property development industry but over the longer-term valuations look attractive and ought to be supported by central bank policy and improving consumer demographics with an increasing middle class.
The committee remain positive for the prospects of emerging markets for the reasons mentioned in previous diaries namely demographics and because they are home to one of the most sought-after electronic components of the decade – the semiconductor chip. Emerging Markets are also likely to become beneficiaries of the drift away from doing business with China.
In view of the heightened level of global economic uncertainty, after careful deliberation, there was unanimous agreement to only make very minor changes to the Clarion portfolios. The key themes can be summarised below:
A new market cycle has begun with a rapid normalisation of interest rates and higher inflation expectations. Cash is unattractive as inflationary pressures are structurally long term due to falling trust amongst leading global economies. Continuing to hold a diversified portfolio of high-quality assets is important to protect and grow the value of savings over the long term.
Continuing to hold a globally diversified portfolio of high-quality assets over the longer term remains the appropriate method for allocation of investor capital.
Keith W Thompson
Clarion Group Chairman
November 2022
Creating better lives now and in the future for our clients, their families and those who are important to them.
The chart below shows the historical performance of the Defender Portfolio against a relevant benchmark since the start of the available data.
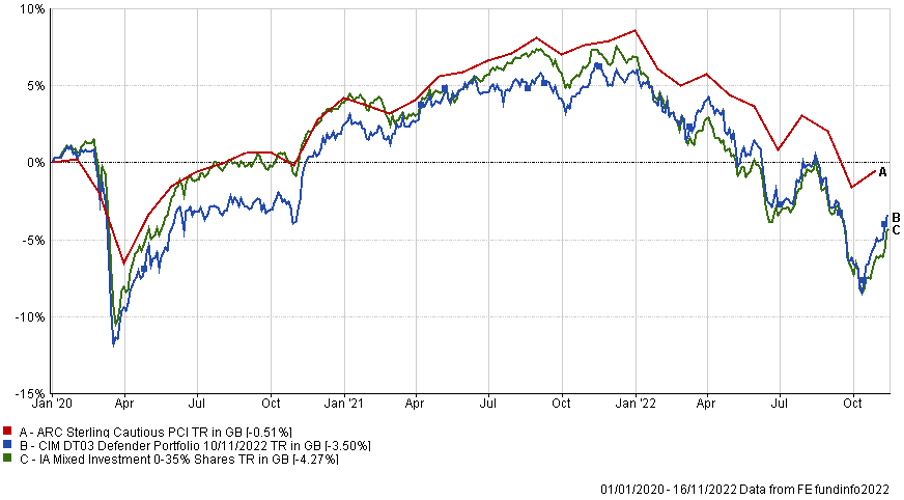
The table below shows the annualised performance to the last quarter end:
| 30/09/21 30/09/20
to to 30/09/22 30/09/21 |
|
| CIM DT03 Defender Portfolio | -9.90% 7.42% |
| ARC Sterling Cautious PCI | -10.13% 6.33% |
| IA Mixed Investment 0-35% Shares | -12.00% 6.02% |
The chart below shows the historical performance of the Prudence Portfolio against a relevant benchmark since the start of the available data.
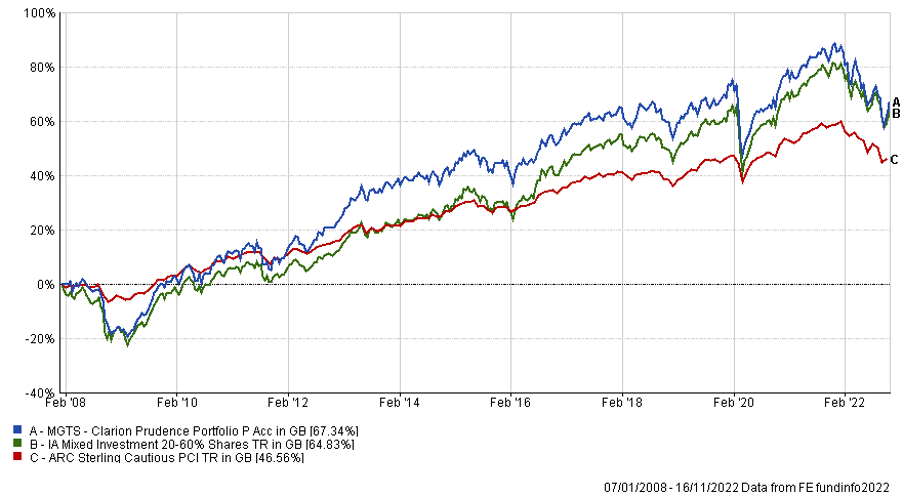
The table below shows the annualised performance to the last quarter end:
| 30/09/21 to 30/09/22 | 30/09/20 to 30/09/21 | 30/09/19 to 30/09/20 | 30/09/18 to 30/09/19 | 30/09/17 to 30/09/18 | |
| MGTS Clarion Prudence X Acc | -12.39% | 11.63% | -2.00% | 1.83% | 2.90% |
| CIM DT04 Prudence Portfolio | -12.56% | 11.66% | -1.23% | 2.54% | 2.93% |
| ARC Sterling Cautious PCI | -10.13% | 6.33% | 1.52% | 3.40% | 1.29% |
| IA Mixed Investment 20-60% Shares | -10.56% | 12.21% | -1.19% | 4.01% | 2.60% |
The chart below shows the historical performance of the Navigator Portfolio against a relevant benchmark since the start of the available data.
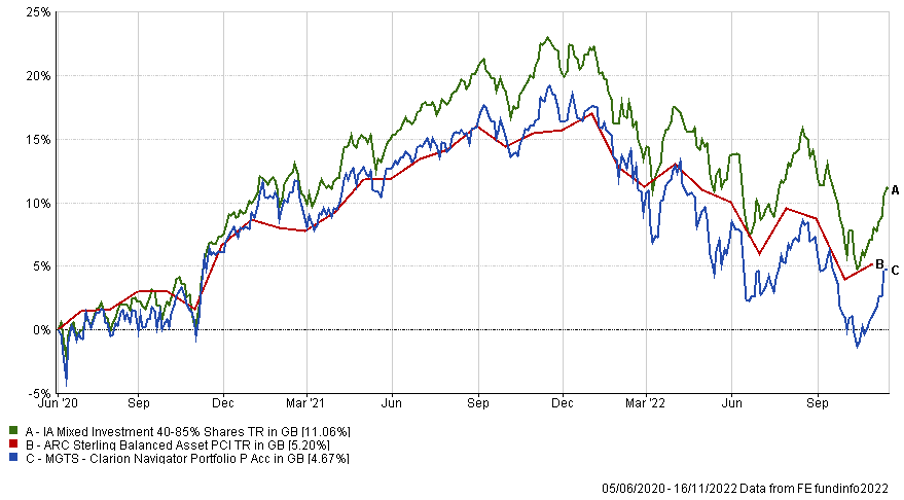
The table below shows the annualised performance to the last quarter end:
| 30/09/21
to 30/09/22 |
30/09/20
to 30/09/21 |
|
| MGTS Clarion Navigator X Acc | -12.48% | 14.17% |
| CIM DT05 Navigator Portfolio | -12.77% | 14.32% |
| IA Mixed Investment 40-85% Shares | -10.15% | 16.63% |
ARC Sterling Balanced Asset PCI -11.13% 10.93%
The chart below shows the historical performance of the Meridian Portfolio against a relevant benchmark since the start of the available data.
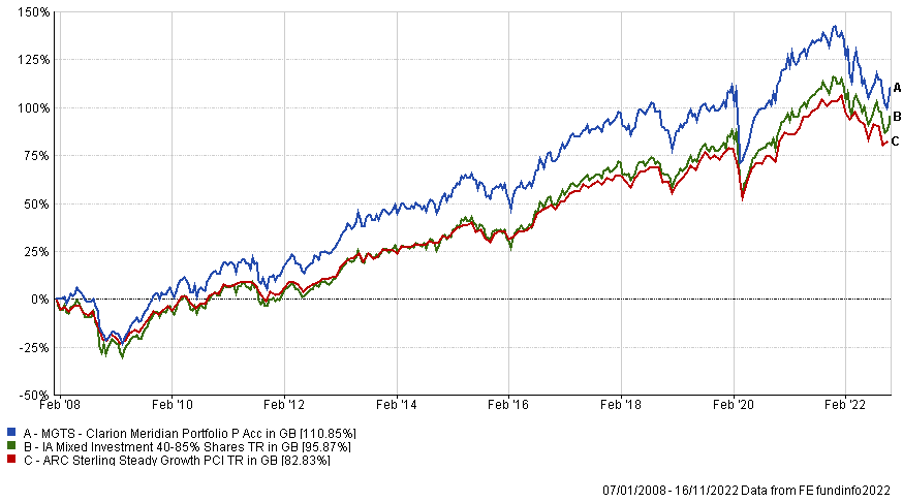
The table below shows the annualised performance to the last quarter end:
| 30/09/21 to 30/09/22 | 30/09/20 to 30/09/21 | 30/09/19 to 30/09/20 | 30/09/18 to 30/09/19 | 30/09/17 to 30/09/18 | |
| MGTS Clarion Meridian X Acc | -13.52% | 16.76% | 0.00% | 0.99% | 6.39% |
| CIM DT06 Meridian Portfolio | -14.02% | 17.08% | 0.93% | 3.36% | 5.31% |
| ARC Steady Growth PCI | -12.02% | 15.04% | -0.16% | 3.82% | 5.15% |
| IA Mixed Investment 40-85% Shares | -10.15% | 16.63% | -0.19% | 4.20% | 5.35% |
The chart below shows the historical performance of the Explorer Portfolio against a relevant benchmark since the start of the available data.
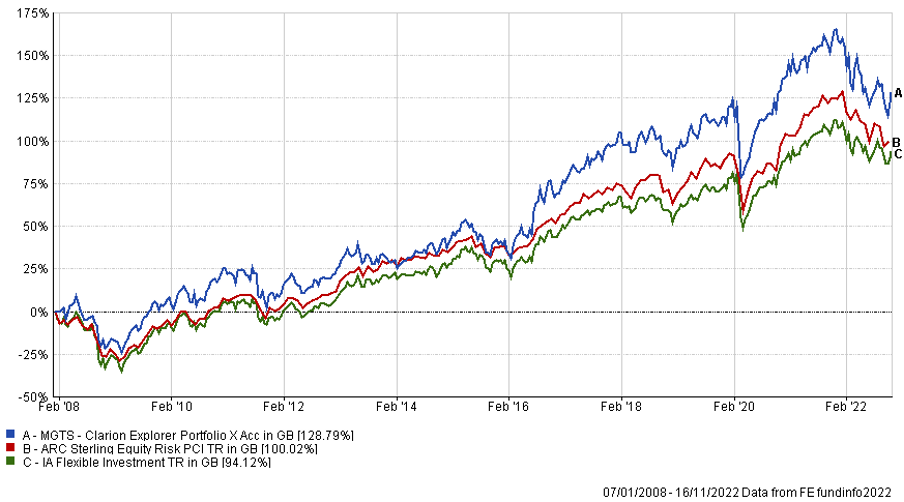
The table below shows the annualised performance to the last quarter end:
| 30/09/21 to 30/09/22 | 30/09/20 to 30/09/21 | 30/09/19 to 30/09/20 | 30/09/18 to 30/09/19 | 30/09/17 to 30/09/18 | |
| MGTS Clarion Explorer X Acc | -14.01% | 18.75% | 0.86% | 4.48% | 8.58% |
| CIM DT07 Explorer Portfolio | -14.97% | 19.03% | 1.21% | 3.97% | 9.27% |
| ARC Equity Risk PCI | -13.49% | 19.42% | -0.25% | 3.84% | 6.53% |
| IA Flexible Investment | -9.19% | 18.30% | 0.88% | 3.24% | 5.37% |
The chart below shows the historical performance of the Voyager Portfolio against a relevant benchmark since the start of the available data.
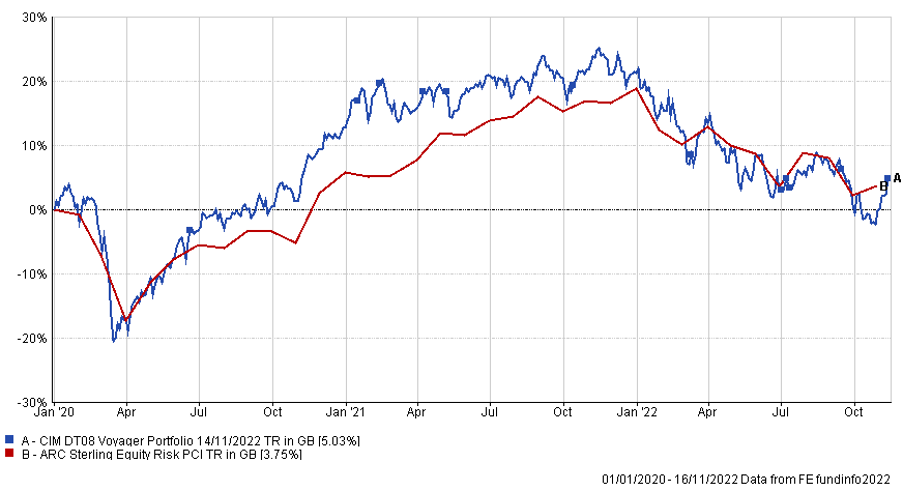
The table below shows the annualised performance to the last quarter end:
| 30/09/21
to 30/09/22 |
30/09/20
to 30/09/21 |
|||||
| CIM DT08 Voyager Portfolio | -16.47% | 19.86% | ||||
| ARC Equity Risk PCI | -13.49% | 19.42% |
The chart below shows the historical performance of the Adventurer Portfolio against a relevant benchmark since the start of the available data.
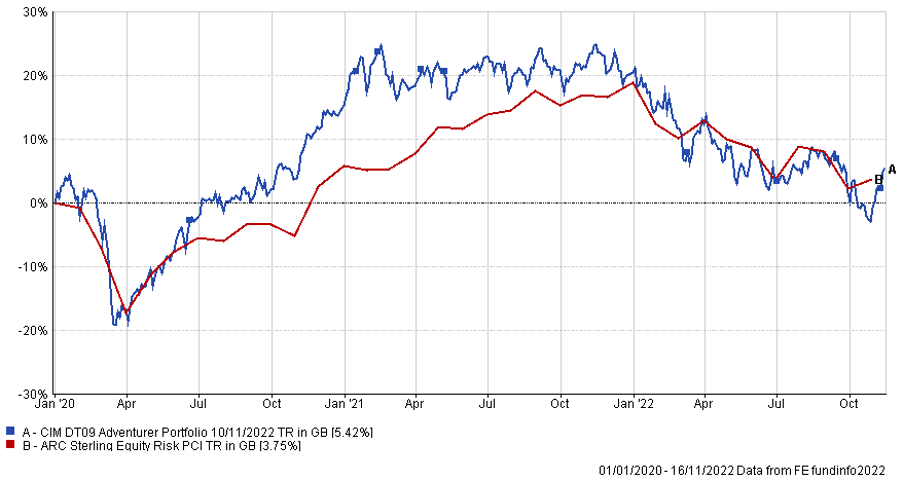
The table below shows the annualised performance to the last quarter end:
| 30/09/21
to 30/09/22 |
30/09/20
to 30/09/21 |
||||
| CIM DT09 Adventurer Portfolio | -15.98% | 18.32% | |||
| ARC Equity Risk PCI | -13.49% | 19.42% |
The chart below shows the historical performance of the Pioneer Portfolio against a relevant benchmark since the start of the available data.
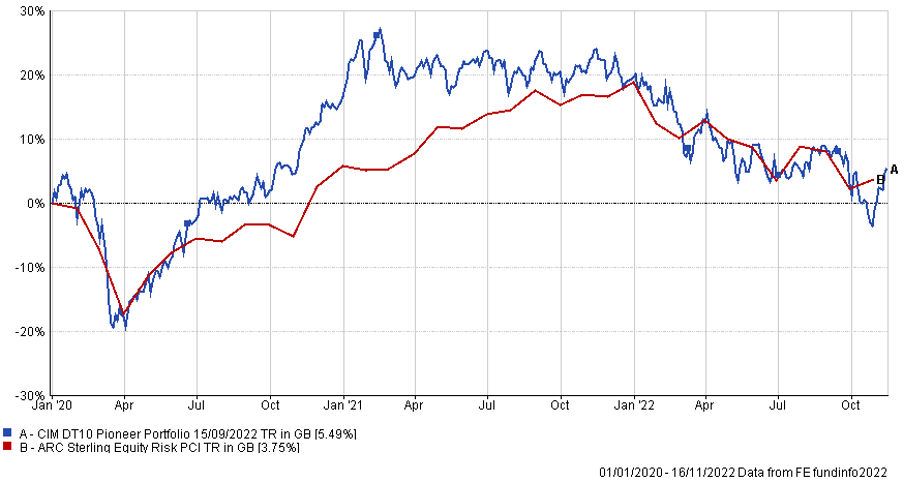
The table below shows the annualised performance to the last quarter end:
| 30/09/21
to 30/09/22 |
30/09/20
to 30/09/21 |
||||
| CIM DT10 Pioneer Portfolio | -14.63% | 18.18% | |||
| ARC Equity Risk PCI | -13.49% | 19.42% |
The content of this article does not constitute financial advice and you may wish to seek professional advice based on your individual circumstances before making any financial decisions.
Any investment performance figures referred to relate to past performance which is not a reliable indicator of future results and should not be the sole factor of consideration when selecting a product or strategy. The value of investments, and the income arising from them, can go down as well as up and is not guaranteed, which means that you may not get back what you invested. Unless indicated otherwise, performance figures are stated in British Pounds. Where performance figures are stated in other currencies, changes in exchange rates may also cause an investment to fluctuate in value.
If you’d like more information about this article, or any other aspect of our true lifelong financial planning, we’d be happy to hear from you. Please call +44 (0)1625 466 360 or email [email protected].
Click here to sign-up to The Clarion for regular updates.