True lifelong financial planning for the serious business of life.
True lifelong financial planning
for the serious business of life.
True lifelong financial planning for the serious business of life.
True lifelong financial planning
for the serious business of life.
Tags: Adventurer Portfolio, Defender Portfolio, Discretionary Investment Management, Explorer Portfolio, funds, investment, Meridian Portfolio, MGTS Clarion Explorer, MGTS Clarion Meridian, MGTS Clarion Prudence, MTGS Clarion Navigator, Navigator Portfolio, Pioneer Portfolio, Prudence Portfolio, Voyager Portfolio
Category:
Investment management
This article provides a brief overview of the topics discussed in the recent investment committee meeting and the decisions made following those discussions.
The following notes summarise the main points discussed by the Investment Committee.
The strongest IA sector performers during September were IA Japan (4.58%), IA Japanese Smaller Companies (3.48%) and IA UK Direct Property (0.55%). Japan’s equity market remained hot, heading into the upcoming election to see who will replace Yoshihide Suga, following recent historical trends of Japanese outperformance ahead of election cycles.
The US government was able to continue functioning as enough Republican senators agreed to extend funding over the short-term, passing 65-35. The challenge remains to overcome the impending fiscal cliff, with the Treasury due to run out of extraordinary reserves by the end of the year according to the most recent calculations.
Bond markets had a terrible September, with central banks shifting forward projections for interest rate rises, as inflationary pressures appear less “transitory”. Andrew Bailey, the Governor of the Bank of England, has stated the MPC is ready to raise rates at the end of this year if required. The latest Federal Reserve ‘dot plot’ shows a tie for a rate rise in 2022, considerably ahead of the 2024 projection consensus not so long ago. The yields on US 10-year treasuries, UK 10-year gilts and German bunds all rose sharply in September. As yield moves inversely to price, investors in these securities have seen losses akin to volatile equities, despite holding an ostensibly “safe” asset.
In Asia, markets were badly affected by the fallout from the Evergrande property group. The heavily indebted group saw its shares plummet over 80% through the year, eventually being suspended on the Hang Seng stock exchange, with the expectation that another group would buy part of the company. A small nominal pay-out was made to domestic bondholders, but over $80m of coupon payments are still outstanding for overseas investors. Two peer property developers, Sinic and Fantasia have also missed bond payments to investors. It is difficult to tell to what extent the imminent collapse of China’s second largest property developer will further impact markets.
The People’s Bank of China declared all cryptocurrency transactions to be illegal and banned foreign exchanges from serving Chinese customers. This followed on from earlier cryptocurrency crackdowns in the country, such as the ban on cryptocurrency mining issued in May. “Virtual currencies do not have the same legal status as legal tender… Virtual currency-related activities are illegal financial activities… Provision of services by overseas virtual currency exchanges to residents in China via the internet is also considered to be an illegal financial activity.”
Along with recent regulatory interference into the wider tech sector and banning online education for profit, overseas investors can be forgiven for wondering which area of the Chinese economy is next in line to receive a battering.
Following on from the UK’s CPI inflation hitting 3.2% year on year, further pressure across a variety of UK sectors came from a shortage of wholesale gas. The UK is a net importer and, due to a cold winter last year and covid complications, not as much has been produced worldwide. As a result, the price of wholesale gas has quadrupled. This has impacted energy suppliers, with a number of smaller companies having already gone bust, and more expected to follow in due course. The timing is particularly unfortunate for customers, who will see significant increases in bills as the regulator-imposed price cap expires in October, resulting in a £139 increase for customers paying by direct debit who do not have a price-fixed tariff.
Long-suffering airlines finally caught a break in September as the US unexpectedly announced that vaccinated travellers would be allowed to visit the country from November. This news came alongside the more anticipated notice of the UK paring back its traffic light system for overseas travel. Rolls-Royce, a good sentiment indicator for a post-Covid 19 world due to its business model of charging per hours flown for its engines, saw a big uptick on the news, along with many other airlines.
Our positional bias in short-duration credit has been a positive contributor to returns during the month, as long-dated debt has been crushed by fears over inflation proving to be more than transitory, and the escalating talk of central banks tapering and hiking interest rates. Our theme remains that central bank support has been the central pillar of the bond market capital appreciation and outperformance of tech stocks, and yields have a lot further to rise when this support is whittled away.
Our positioning in short-dated corporate bonds produces an above-inflation yield with reduced duration and credit risk, and ought to outperform in a rising yield environment.
UK equity valuations are very cheap compared to most other major stock markets. The UK is the go-to destination for anyone shopping for companies. With foreign buyers awash with cash, great bargains, and no real impediments, it is little wonder that so many well-known names are being snapped up. A frantic summer of deal-making has put 2021 on track to break merger and acquisition records as companies rush to exploit cheap financing and bumper profits.
The surge has been fuelled by a mix of low borrowing costs, trillions of dollars in the coffers of private equity groups and the return of animal spirits to corporate boardrooms. The UK market has long been one of the favoured markets, on valuation grounds, of the Clarion Investment Committee and will continue to be so for the foreseeable future.
The UK remains attractive on relative valuation grounds and, with a bias towards financials, ought to see outperformance in a rising rate environment. Even factoring in recent rallies, the UK trades at a discount not seen in c.40 years in comparison to other developed equity markets. Our overweight UK positioning is intended to capitalise on this opportunity.
Even Japan’s stock market, also favoured by the Clarion Investment Committee, burst into life recently following the much-anticipated decision by Prime Minister Yoshihide Suga not to seek re-election. Share prices have been propelled higher on optimism that the new Leader will commit to new stimulus plans. Reassuringly, share price rises can also be attributed to a strong earnings season which ushered in a slew of upgrades
The US equity market has the most clouds circling overhead and, based on valuations relative to other markets (particularly at the tech-concentrated top of the major indices), have the most to lose as market conditions change and tapering draws closer. Our underweight position is intended to mitigate this risk for our investors.
Our Asia Pacific and Emerging Markets positions are broadly underweight to China exposure, which continues to underperform as the Government intervenes heavily in regulation. This should help to insulate the portfolios from this continued fallout.
For a fuller version of Clarion’s Economic and Stock Market Commentary, written by Clarion Group Chairman Keith Thompson, please click here
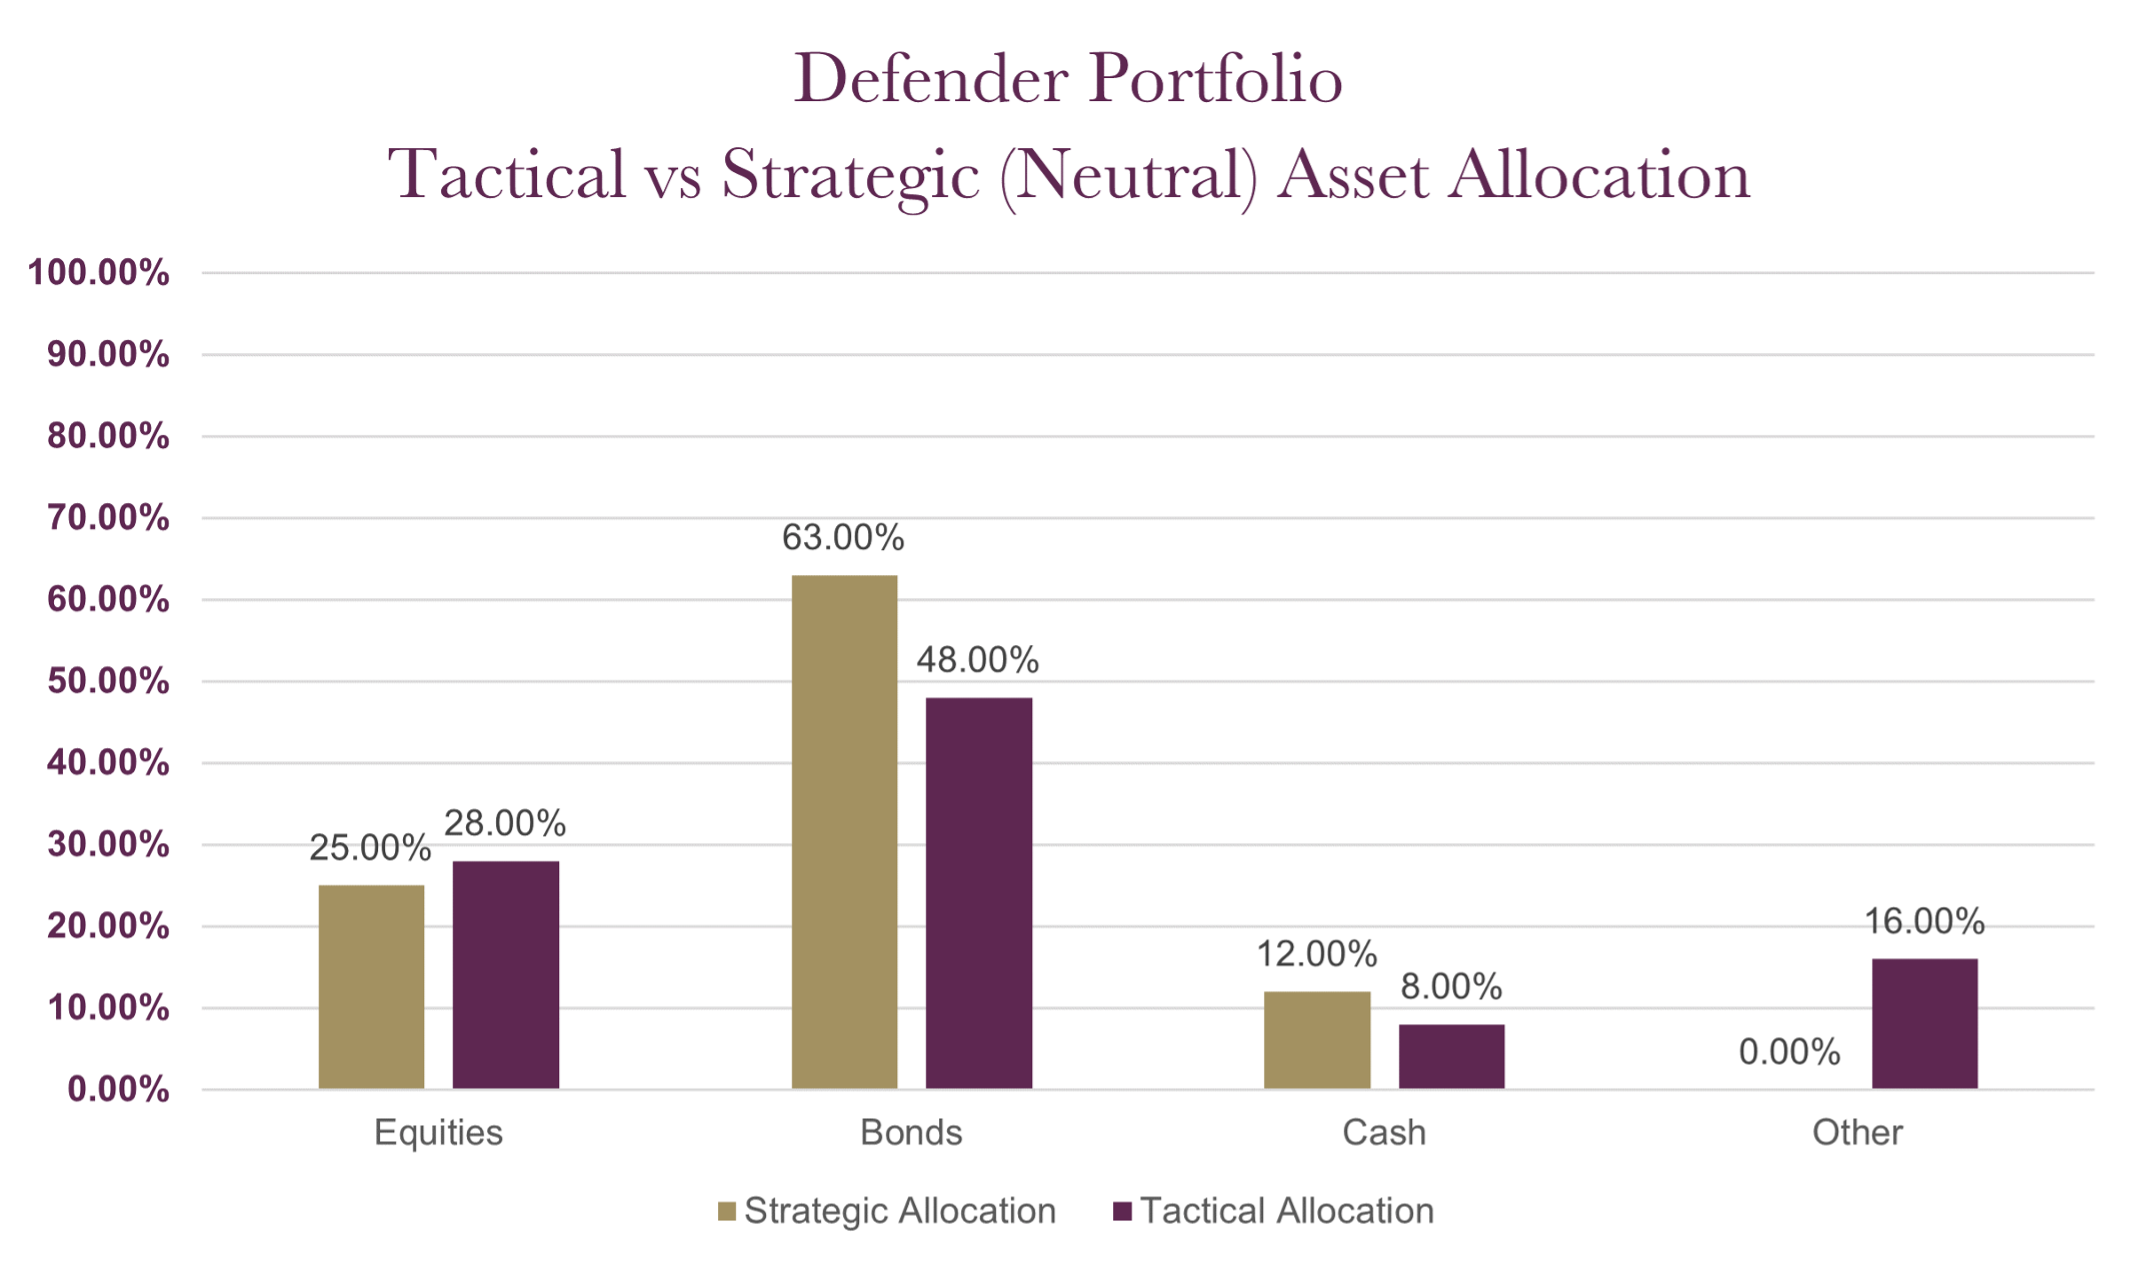
The charts below show the tactical asset allocation of the Defender Portfolio against the neutral/strategic asset allocation as well as the historical performance of the portfolio against a relevant benchmark since the start of the available data.
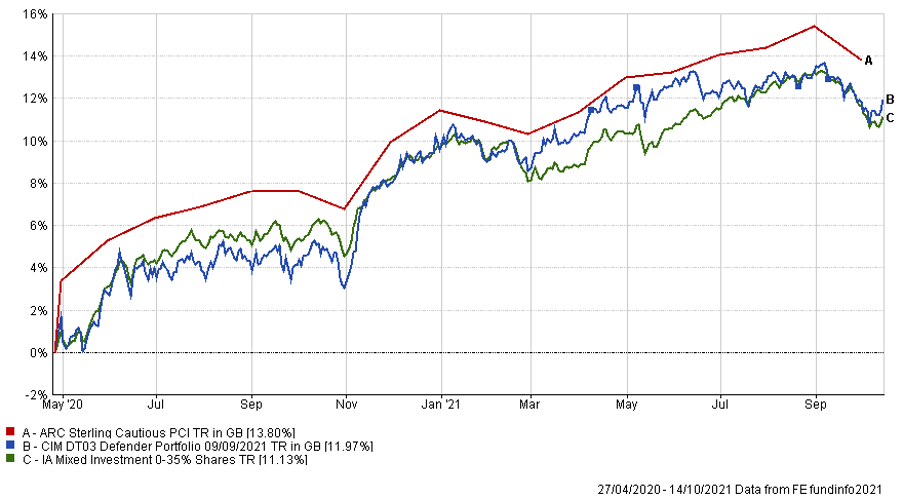
The table below shows the annualised performance to the last quarter end:
| 30/09/20 to 30/09/21 | |
| CIM DT03 Defender Portfolio | 5.69% |
| ARC Sterling Cautious PCI | 7.42% |
| IA Mixed Investment 0-35% Shares | 6.02% |
Changes to the Defender model
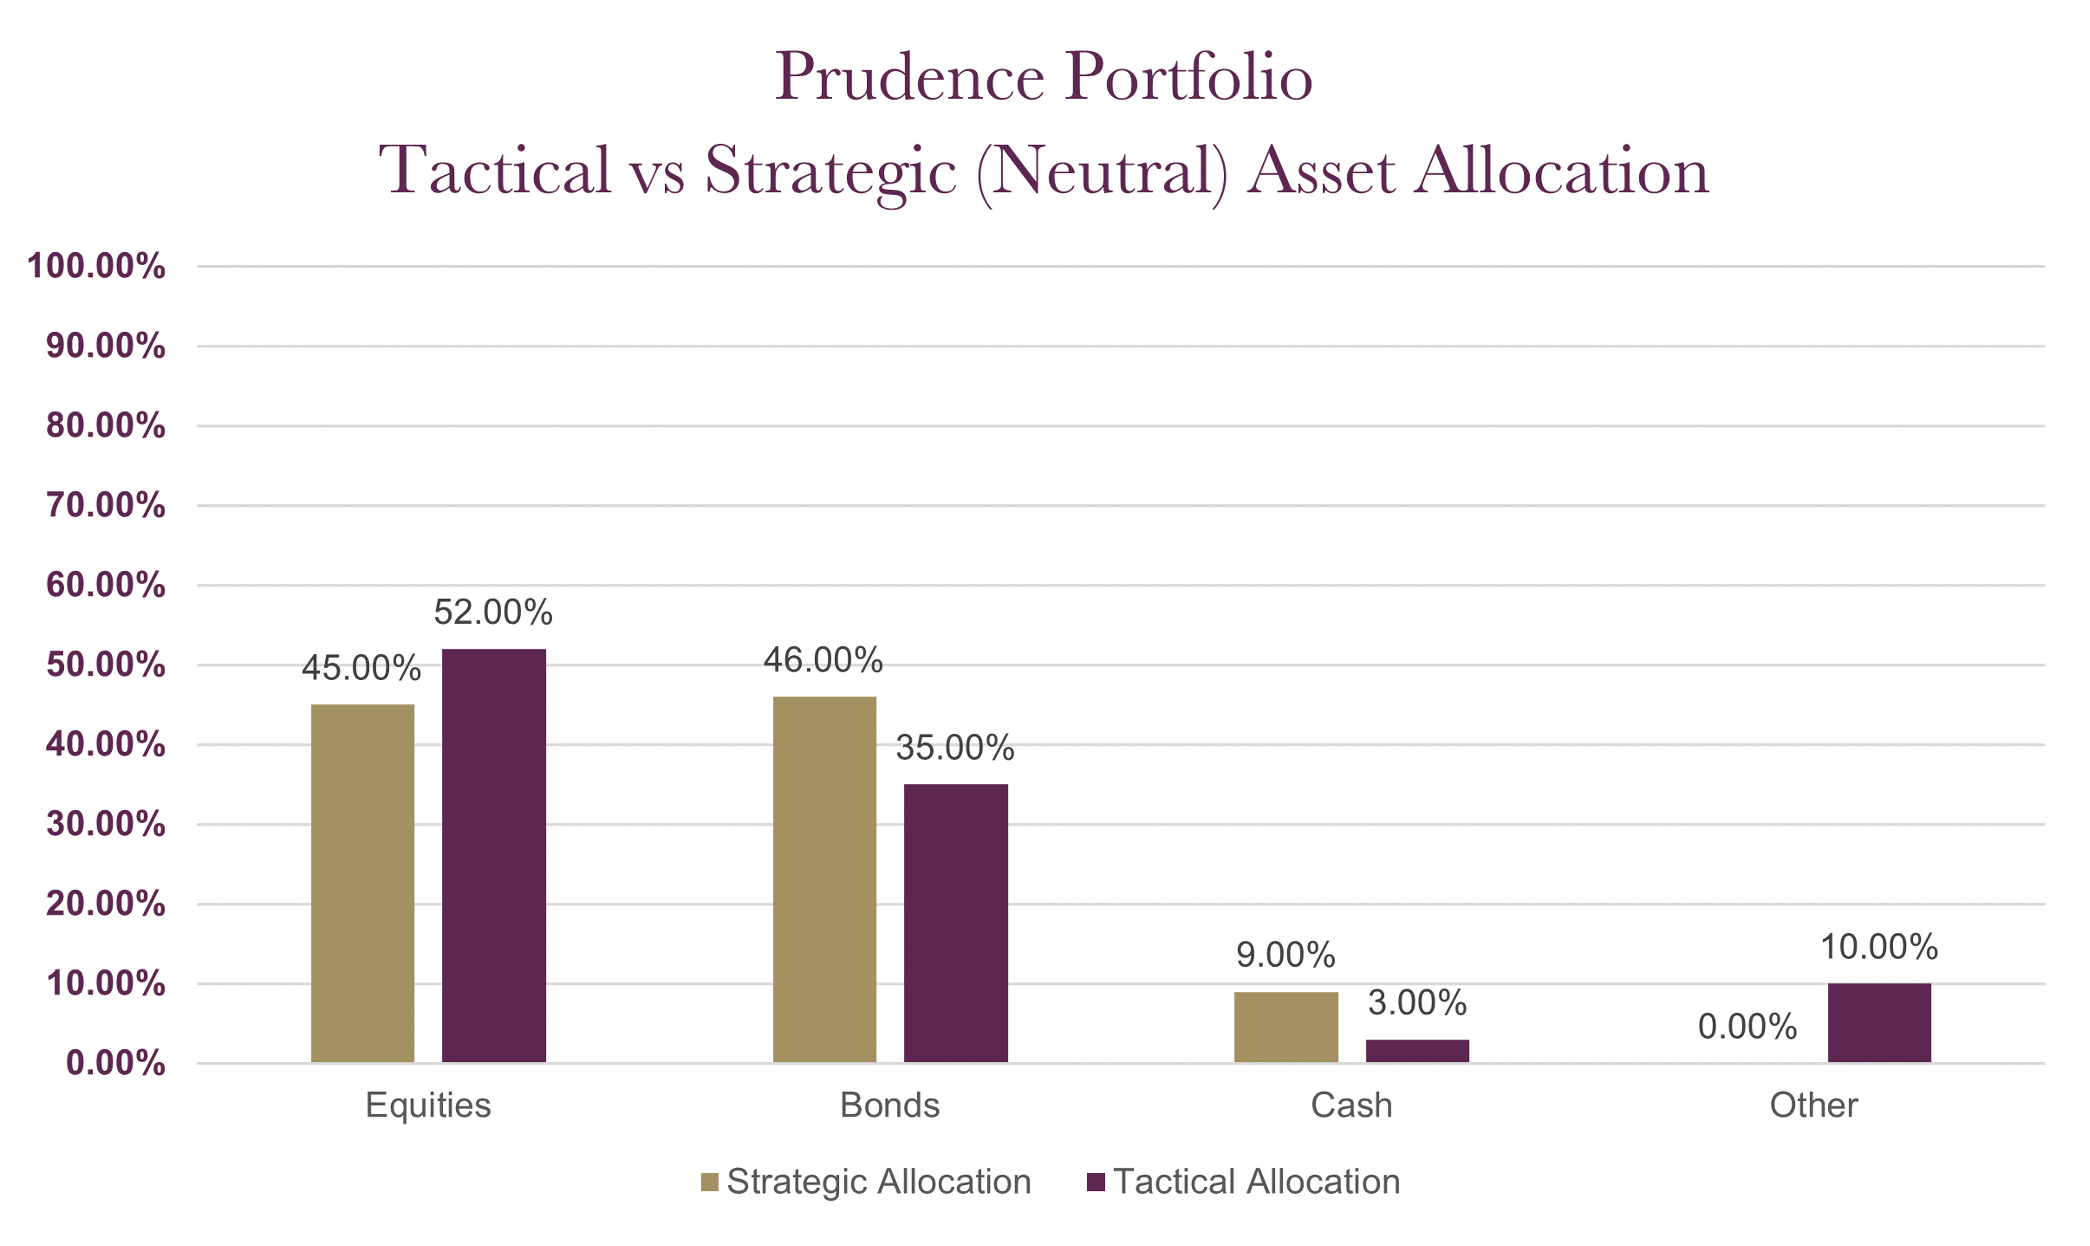
The charts below show the tactical asset allocation of the Prudence Portfolio against the neutral/strategic asset allocation as well as the historical performance of the portfolio against a relevant benchmark(s) since the start of the available data.
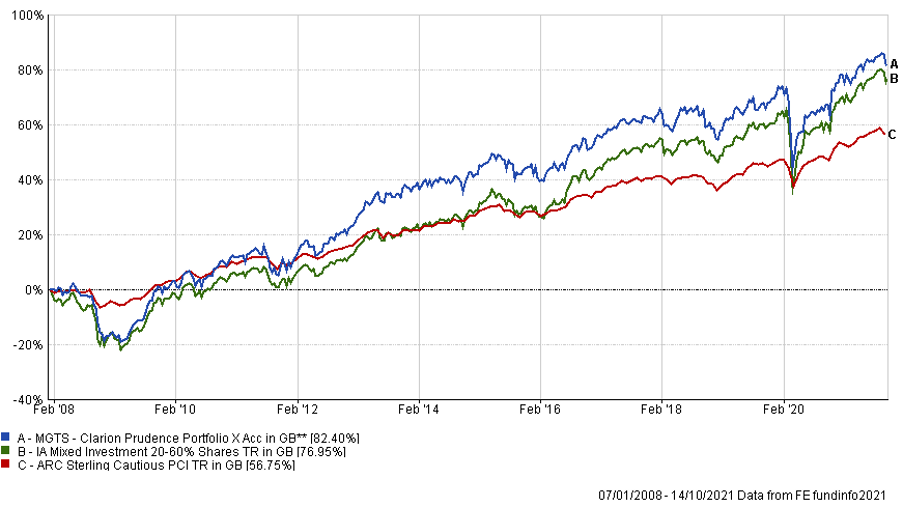
The table below shows the annualised performance to the last quarter end:
| 30/09/20 to 30/09/21 | 30/09/19 to 30/09/20 | 30/09/18 to 30/09/19 | 30/09/17 to 30/09/18 | 30/09/16 to 30/09/17 | |
| MGTS Clarion Prudence X Acc | 11.63% | -2.00% | 1.83% | 2.90% | 4.77% |
| CIM DT04 Prudence Portfolio | 11.66% | -1.23% | 2.54% | 2.93% | |
| ARC Sterling Cautious PCI | 5.69% | 1.52% | 3.40% | 1.29% | 3.86% |
| IA Mixed Investment 20-60% Shares | 12.21% | -1.19% | 4.01% | 2.60% | 6.15% |
Changes to the Prudence fund & model
The charts below show the tactical asset allocation of the Navigator Portfolio against the neutral/strategic asset allocation as well as the historical performance of the portfolio against a relevant benchmark(s) since the start of the available data.
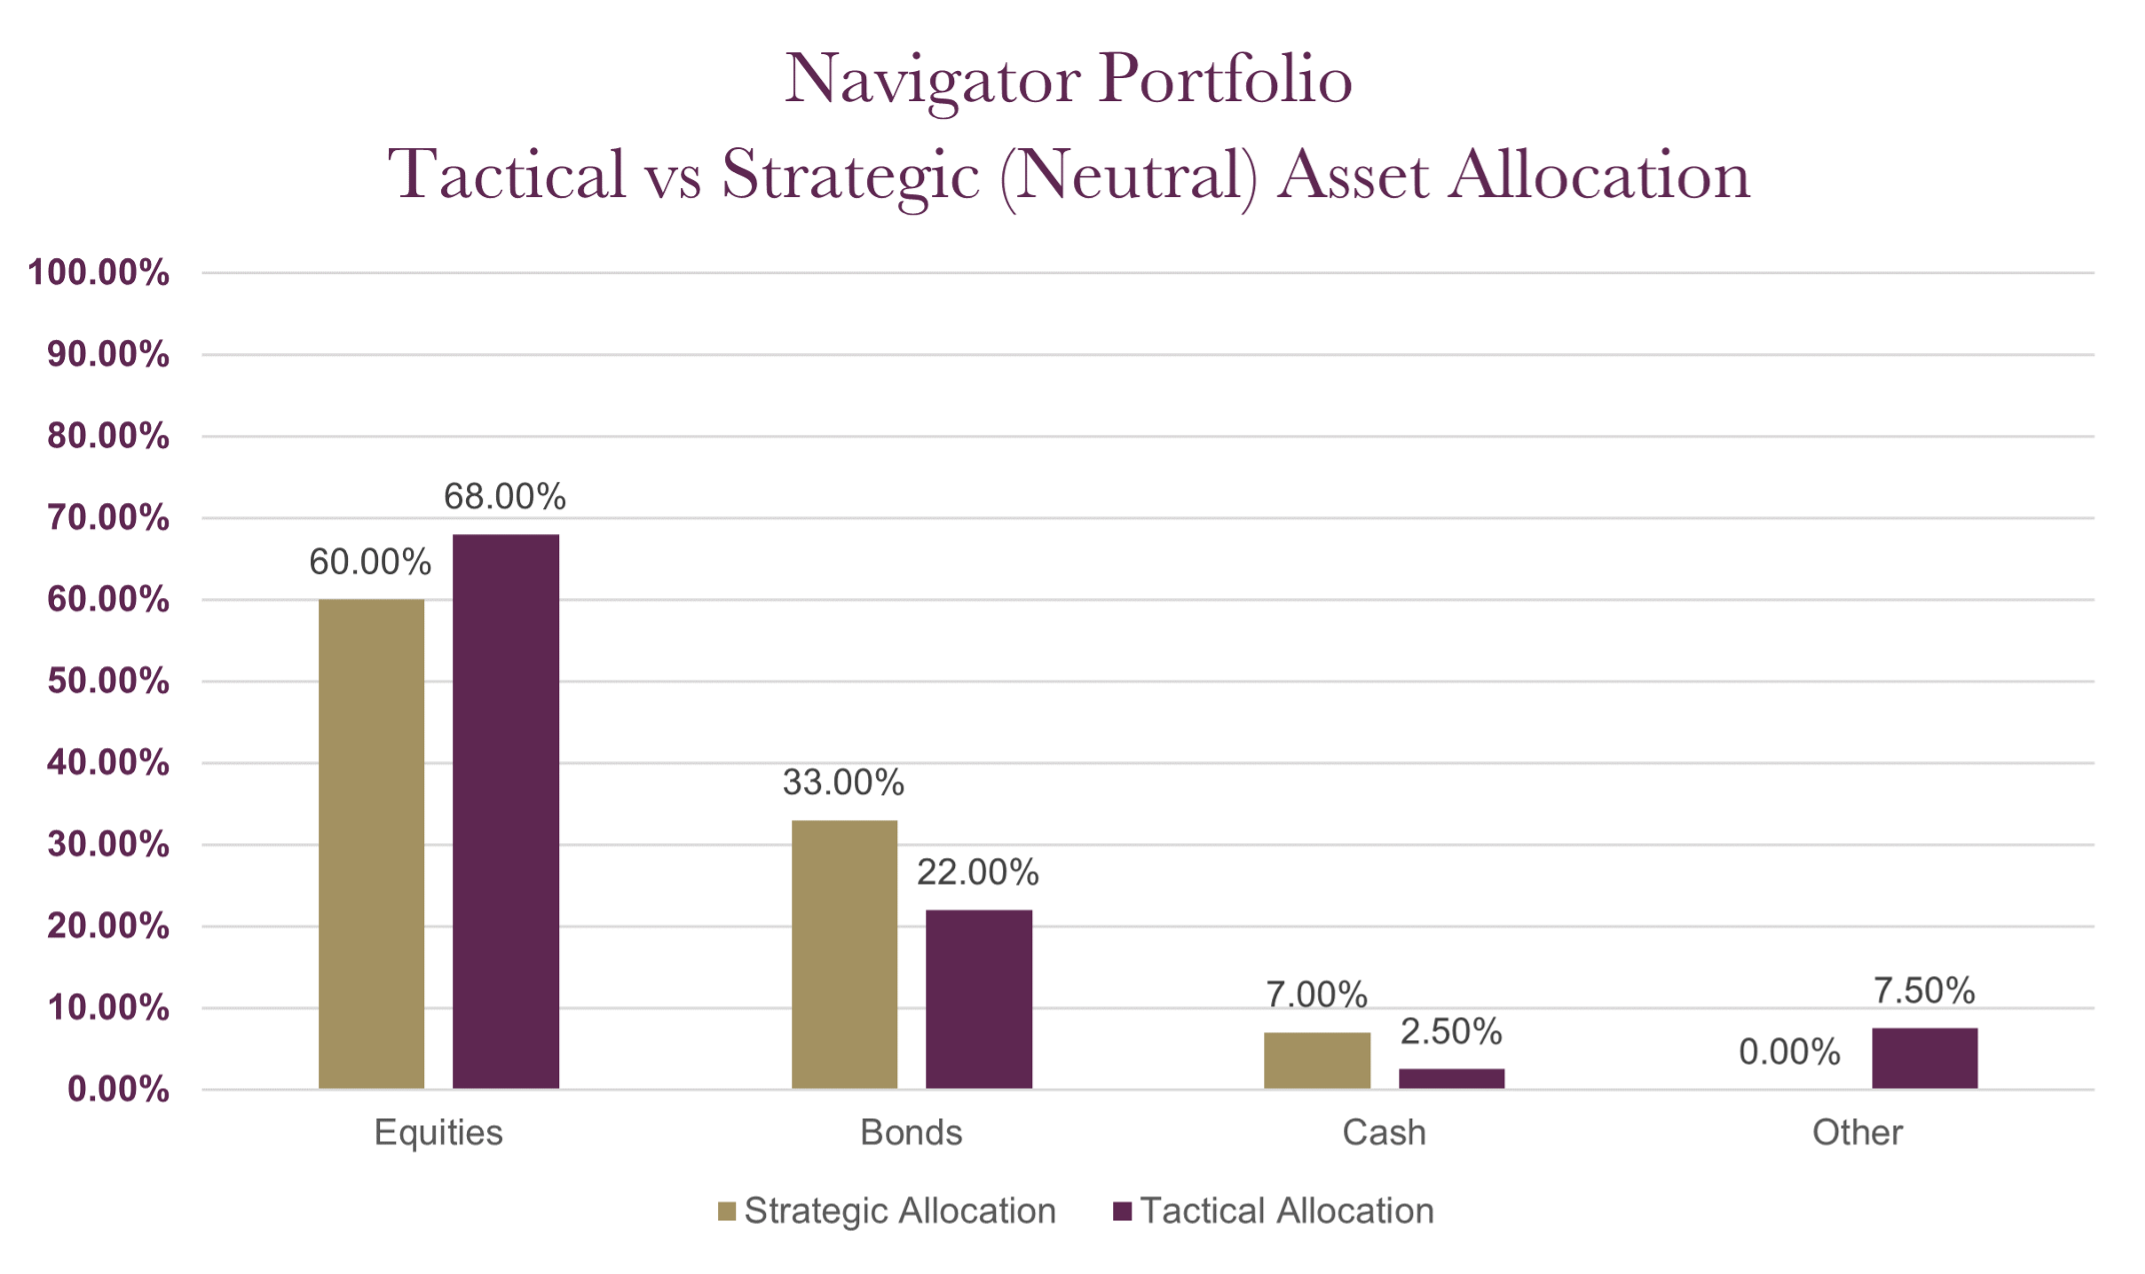
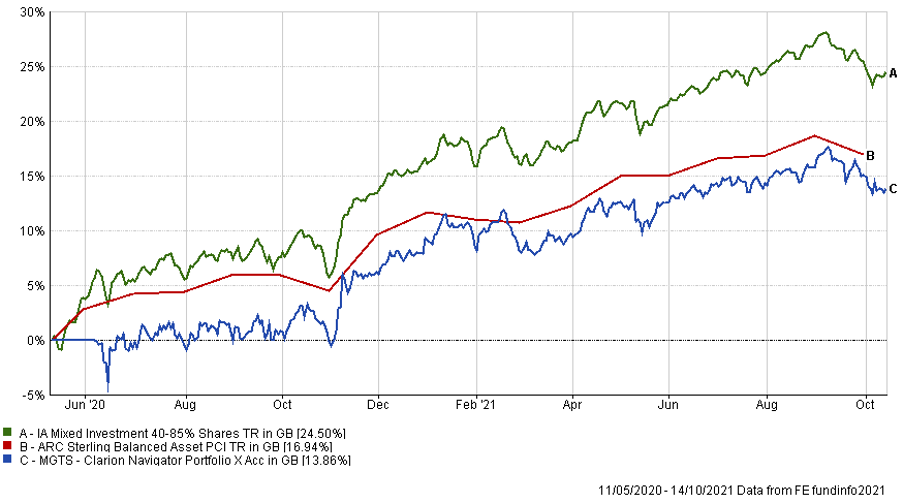
The table below shows the annualised performance to the last quarter end:
| 30/09/20 to 30/09/21 | |
| MGTS Clarion Navigator X Acc | 14.17% |
| CIM DT05 Navigator Portfolio | 14.32% |
| IA Mixed Investment 40-85% Shares | 16.63% |
Changes to the Navigator fund & model
The charts below show the tactical asset allocation of the Meridian Portfolio against the neutral/strategic asset allocation as well as the historical performance of the portfolio against a relevant benchmark(s) since the start of the available data.
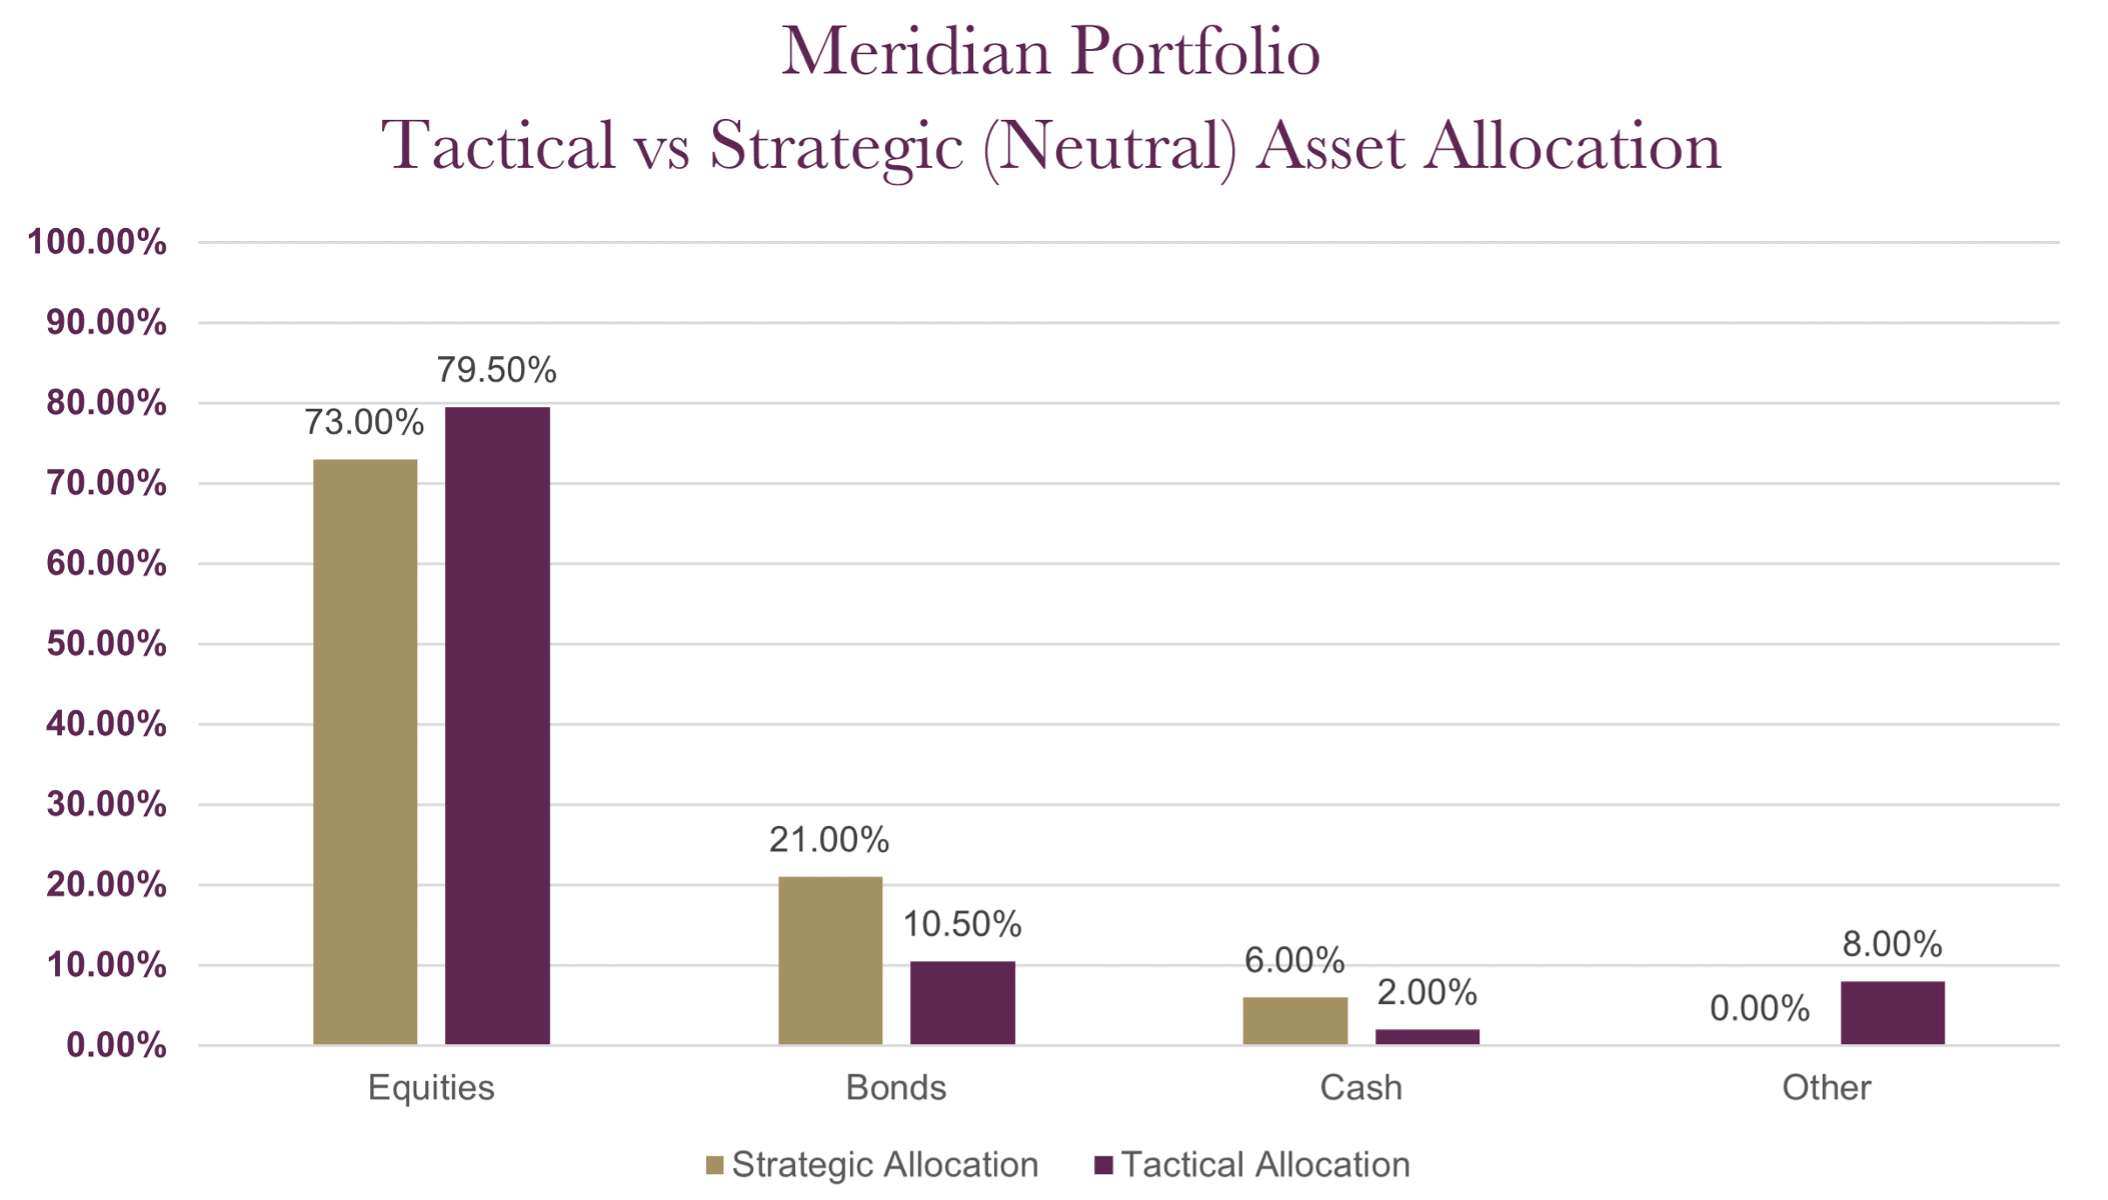
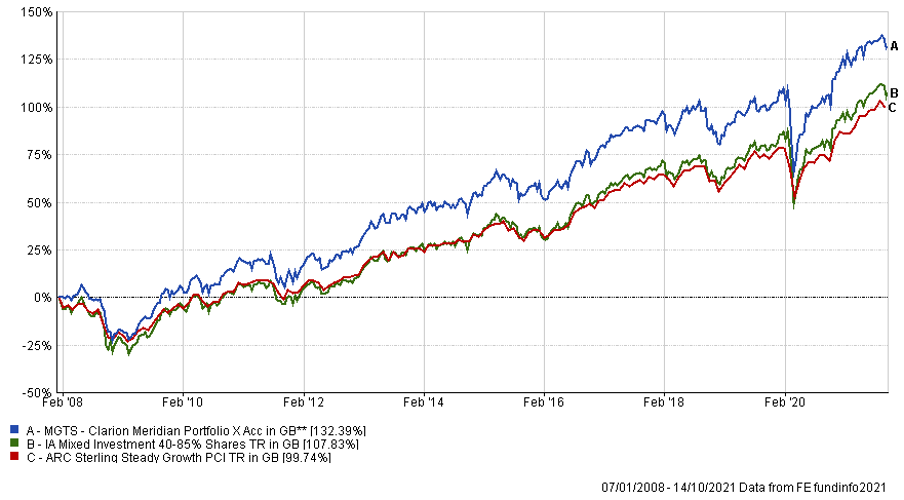
The table below shows the annualised performance to the last quarter end:
| 30/09/20 to 30/09/21 | 30/09/19 to 30/09/20 | 30/09/18 to 30/09/19 | 30/09/17 to 30/09/18 | 30/09/16 to 30/09/17 | |
| MGTS Clarion Meridian X Acc | 16.76% | 0.00% | 0.99% | 6.39% | 8.49% |
| CIM DT06 Meridian Portfolio | 17.08% | 0.93% | 3.36% | 5.31% | |
| ARC Steady Growth PCI | 14.43% | -0.16% | 3.82% | 5.15% | 8.67% |
| IA Mixed Investment 40-85% Shares | 16.63% | -0.19% | 4.20% | 5.35% | 9.09% |
Changes to the Meridian fund & model
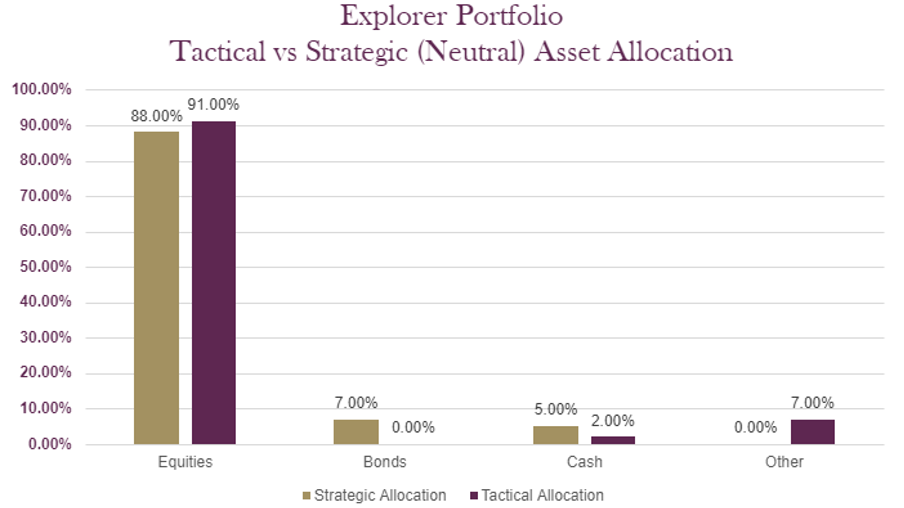
The charts below show the tactical asset allocation of the Explorer Portfolio against the neutral/strategic asset allocation as well as the historical performance of the portfolio against a relevant benchmark(s) since the start of the available data.
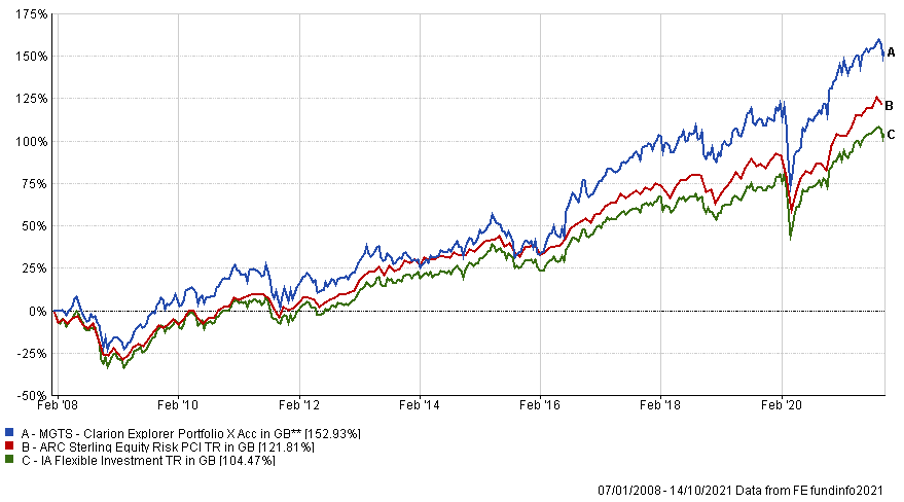
The table below shows the annualised performance to the last quarter end:
| 30/09/20 to 30/09/21 | 30/09/19 to 30/09/20 | 30/09/18 to 30/09/19 | 30/09/17 to 30/09/18 | 30/09/16 to 30/09/17 | |
| MGTS Clarion Explorer X Acc | 18.75% | 0.86% | 4.48% | 8.58% | 10.86% |
| CIM DT07 Explorer Portfolio | 19.03% | 1.21% | 3.97% | 9.27% | |
| ARC Equity Risk PCI | 19.10% | -0.25% | 3.84% | 6.53% | 10.69% |
| IA Flexible Investment | 18.30% | 0.88% | 3.24% | 5.37% | 10.53% |
Changes to the Explorer fund & model
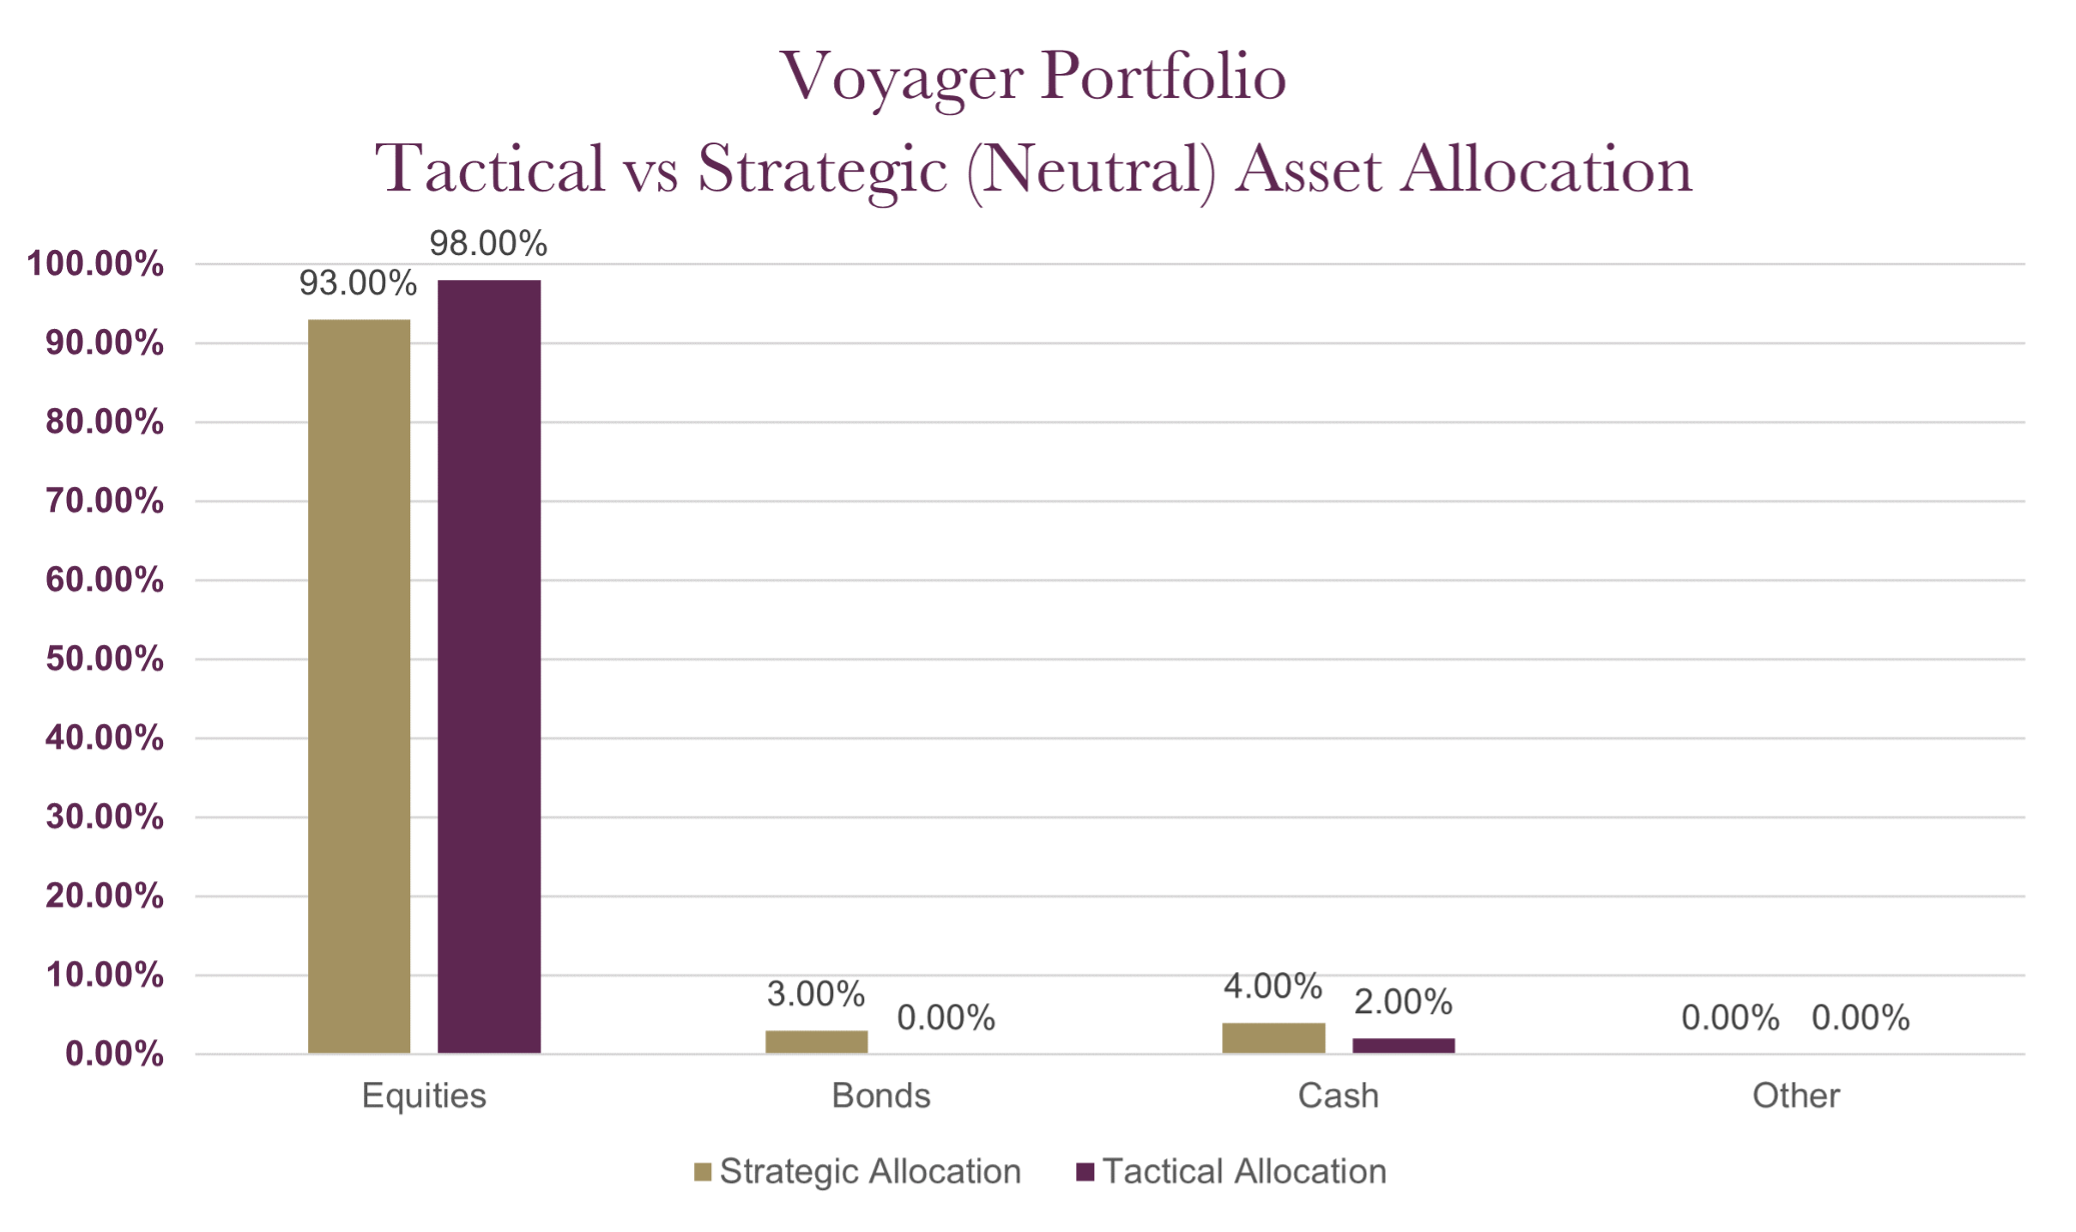
The charts below show the tactical asset allocation of the Voyager Portfolio against the neutral/strategic asset allocation as well as the historical performance of the portfolio against a relevant benchmark(s) since the start of the available data.
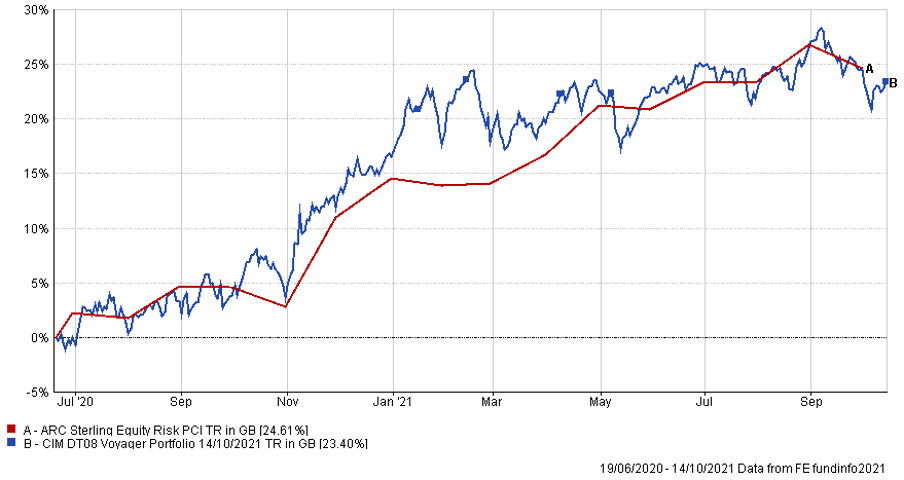
The table below shows the annualised performance to the last quarter end:
| 30/09/20 to 30/09/21 | 30/09/19 to 30/09/20 | 30/09/18 to 30/09/19 | 30/09/17 to 30/09/18 | 30/09/16 to 30/09/17 | |
| CIM DT08 Voyager Portfolio | 19.86% | ||||
| ARC Equity Risk PCI | 19.10% | -0.25% | 3.84% | 6.53% | 10.69% |
Changes to the Voyager fund & model
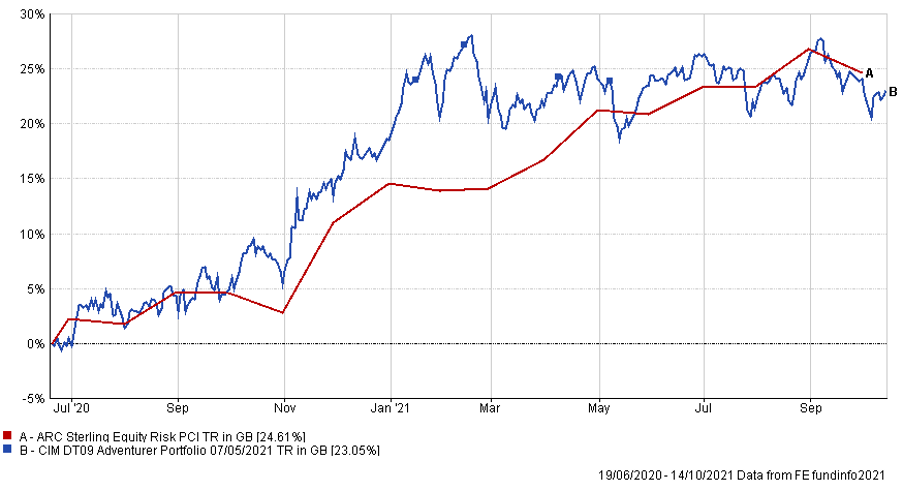
The charts below show the tactical asset allocation of the Adventurer Portfolio against the neutral/strategic asset allocation as well as the historical performance of the portfolio against a relevant benchmark(s) since the start of the available data.
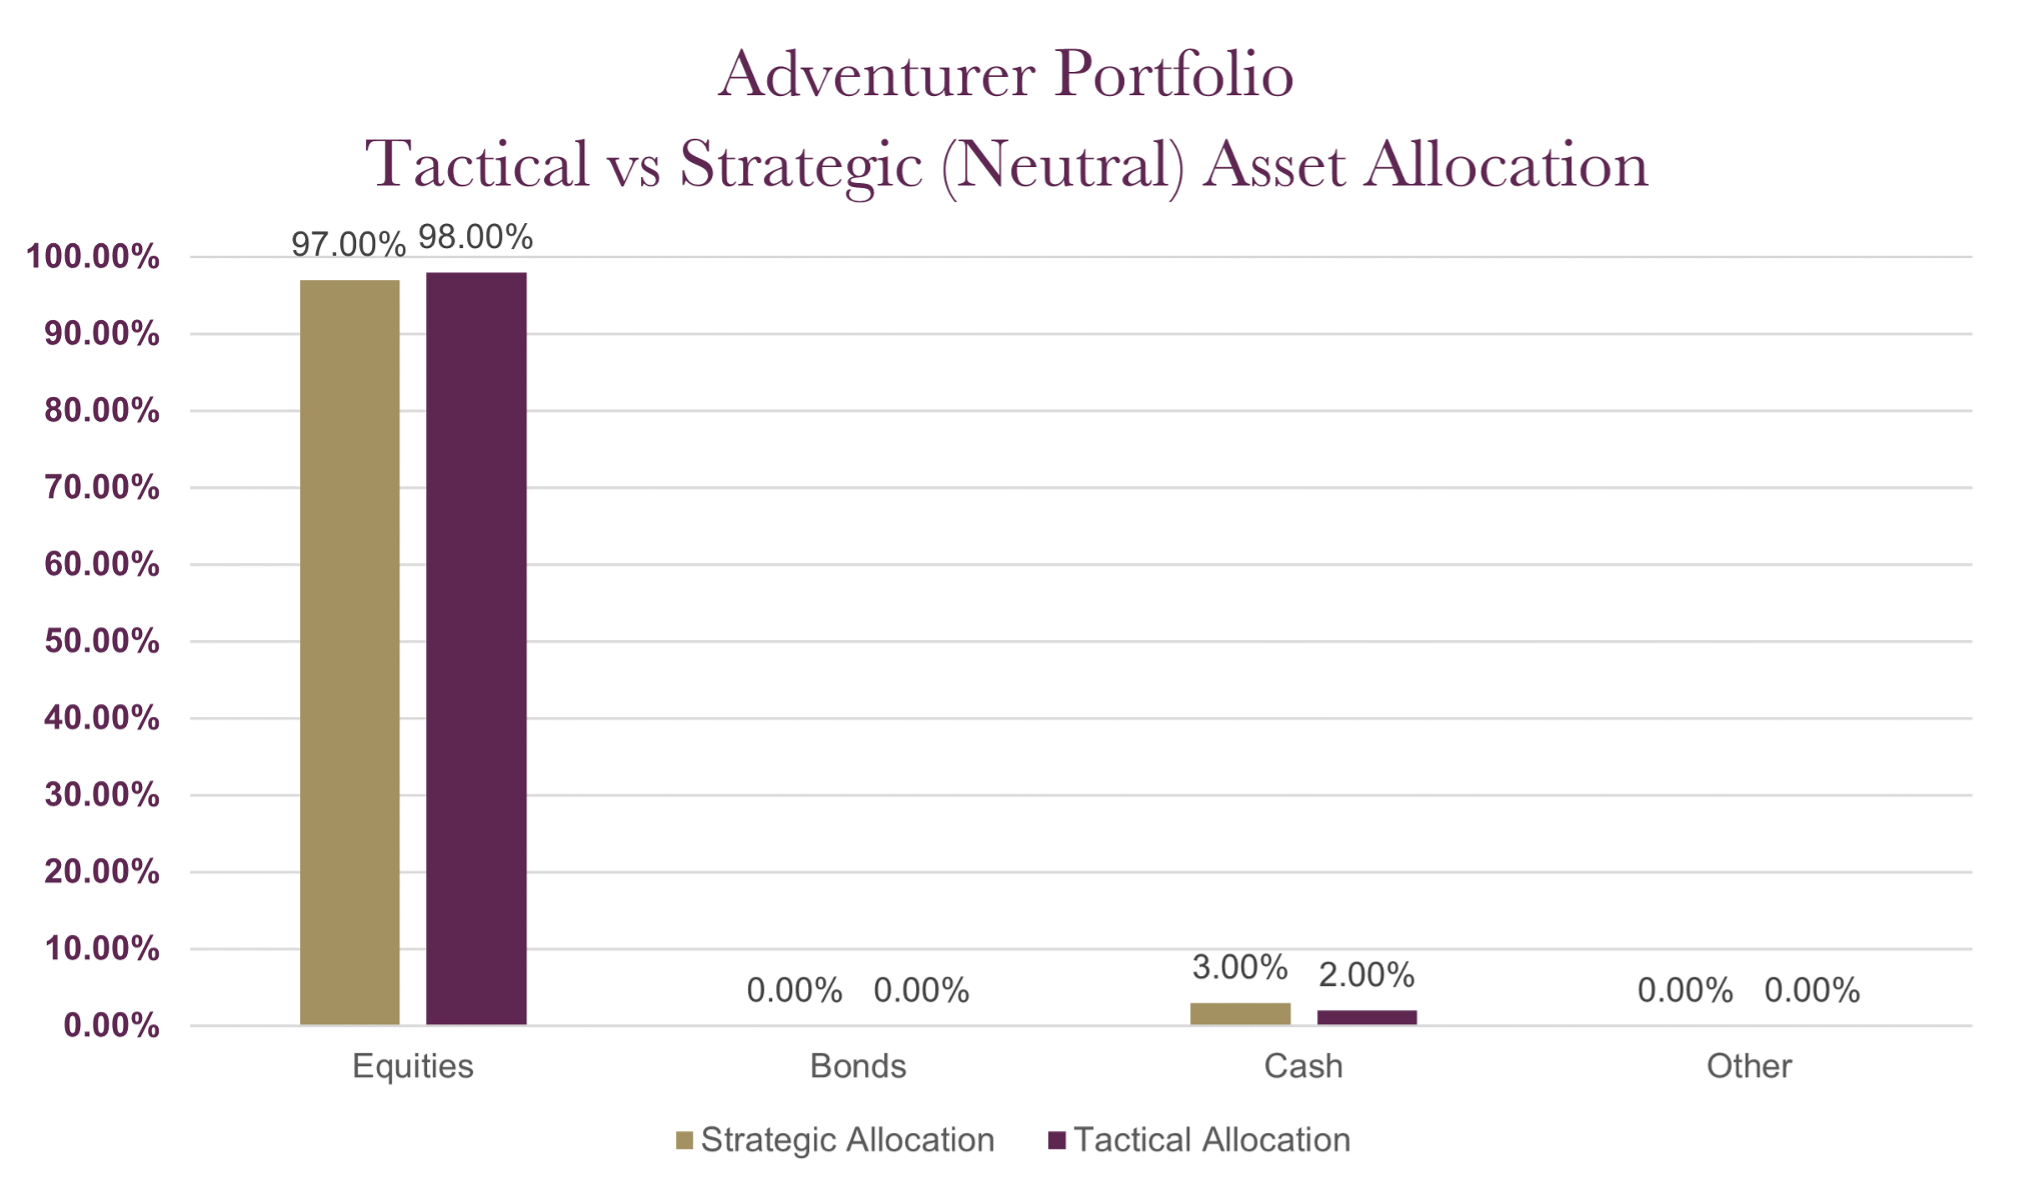
The table below shows the annualised performance to the last quarter end:
| 30/09/20 to 30/09/21 | 30/09/19 to 30/09/20 | 30/09/18 to 30/09/19 | 30/09/17 to 30/09/18 | 30/09/16 to 30/09/17 | |
| CIM DT09 Adventurer Portfolio | 18.33% | ||||
| ARC Equity Risk PCI | 19.10% | -0.25% | 3.84% | 6.53% | 10.69% |
Changes to the Adventurer model
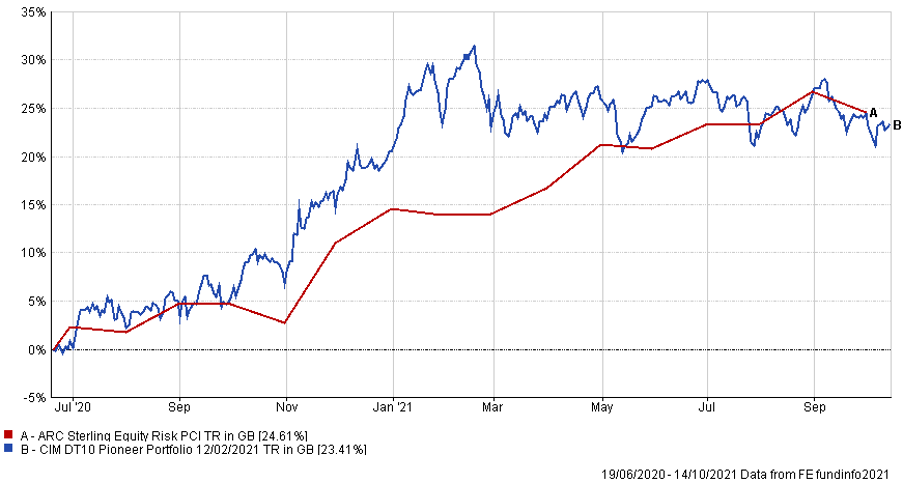
The charts below show the tactical asset allocation of the Pioneer Portfolio against the neutral/strategic asset allocation as well as the historical performance of the portfolio against a relevant benchmark(s) since the start of the available data.
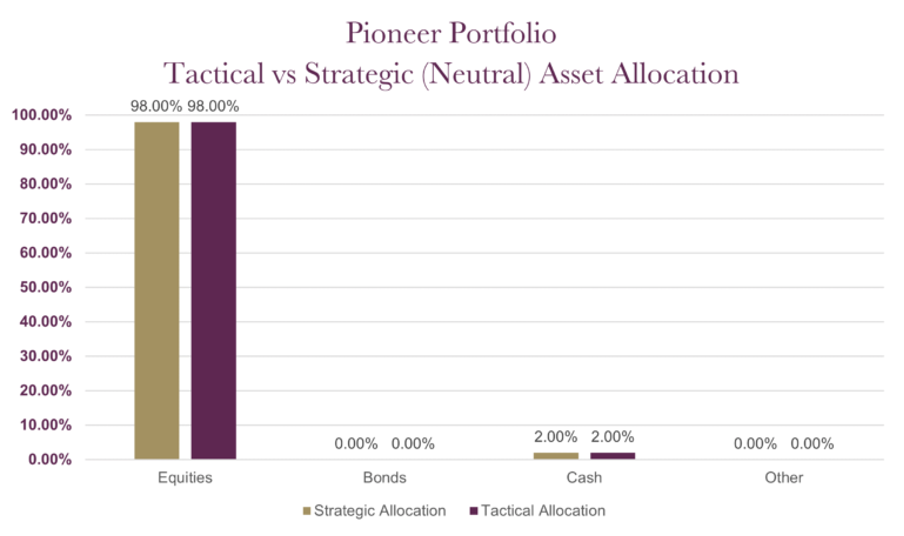
The table below shows the annualised performance to the last quarter end:
| 30/09/20 to 30/09/21 | 30/09/19 to 30/09/20 | 30/09/18 to 30/09/19 | 30/09/17 to 30/09/18 | 30/09/16 to 30/09/17 | |
| CIM DT10 Pioneer Portfolio | 18.18% | ||||
| ARC Equity Risk PCI | 19.10% | -0.25% | 3.84% | 6.53% | 10.69% |
Changes to the Pioneer model
Any investment performance figures referred to relate to past performance which is not a reliable indicator of future results and should not be the sole factor of consideration when selecting a product or strategy. The value of investments, and the income arising from them, can go down as well as up and is not guaranteed, which means that you may not get back what you invested. Unless indicated otherwise, performance figures are stated in British Pounds. Where performance figures are stated in other currencies, changes in exchange rates may also cause an investment to fluctuate in value.
If you’d like more information about this article, or any other aspect of our true lifelong financial planning, we’d be happy to hear from you. Please call +44 (0)1625 466 360 or email [email protected].
Click here to sign-up to The Clarion for regular updates.