Tags: Adventurer Portfolio, Defender Portfolio, Discretionary Investment Management, Explorer Portfolio, funds, investment, Meridian Portfolio, MGTS Clarion Explorer, MGTS Clarion Meridian, MGTS Clarion Prudence, MTGS Clarion Navigator, Navigator Portfolio, Pioneer Portfolio, Prudence Portfolio, Voyager Portfolio
Category:
Investment management
The Clarion Investment Committee met on Monday 17th October. The following notes summarise the main points of consideration in the investment Committee discussions.
(These notes are as at the date of the Investment Committee meeting on 17th October since which time the Prime Minister, Liz Truss, has resigned and we now have a new PM. This development was fully anticipated by the Committee and was factored into our investment decisions/strategy.)
UK markets remain volatile as the government sought to shore up its position following the calamitous response to the fiscal statement or “mini-budget”. Kwasi Kwarteng was sacrificed by Liz Truss, and his replacement as Chancellor was Jeremy Hunt, a moderate figure within the party and broadly regarded as a safe pair of hands in terms of ministerial experience. What followed was a humbling cascade of U-turns as Hunt reversed all the major components of the proposed fiscal plan.
Corporation tax will rise as planned to 25% and the basic rate of income tax will remain at 20%, meaning the only proposed policies to survive are the reversal of a rise in National Insurance and the increase in the stamp duty allowance for home purchases. Even the energy price freeze did not survive in toto, with the proposal to cap average domestic energy prices at £2,500 per annum no longer guaranteed for two years, but instead guaranteed until April 2023 and reviewed at that point.
While monumentally ugly from a political credibility perspective, the intervention of the new Chancellor did make a notable difference in the markets. 30-year gilt yields fell by over 40 basis points to c.4.37%, and sterling strengthened by over 3% against the dollar. Future interest rate expectations also plummeted from above 6% to below 5.25% in May next year.
The Bank of England had caused concern in its plans to call a halt to its emergency bond purchase programme. While this has been achieved without bond yields rising, the BoE continues to supply liquidity via a short-term lending facility to help embattled pension funds which need to make sales to offset liabilities. The impact of the government’s U-turn has also allowed the proposed selling down of gilts from the balance sheet by the BoE to be reinstated in November, having previously been suspended in the market turmoil.
Inflation continues to grind upwards in developed economies despite tighter financial conditions. The UK saw CPI pass 10% YoY once again in September, and core CPI which strips out volatile elements such as energy continues to rise. A similar story was seen in the US, where headline inflation came in at 8.3% YoY ahead of consensus expectations, and core inflation continues to rise
We have seen a dramatic change in US interest rate expectations over the last couple of months. Rates are now expected to peak over 100bps higher than eight weeks ago and are expected to come down much more slowly.
The reason for this is a combination of more hawkish comments from the US Fed, strong jobs data and above all persistent inflation. Core goods and services inflation is higher in the US but in contrast to the UK and Europe, energy inflation is much lower.
Markets, asset allocators and macro funds all feel like they have been waiting all year for core CPI in the US to roll over and allow the Fed to pivot.
Although delayed for the time being it feels that in time this will come – the prices of lots of things are now falling sharply – freight rates, used car prices, timber, steel, copper. Ditto money supply….in time these should feed through to a decline in inflation and in turn expectations that the Fed will pause on the tightening cycle. When it does, we believe this will be a significant catalyst for an increase in risk appetite, as well as most likely a weakening of the dollar. Exactly when this will happen is hard to say, but it feels like it should come through within the next six months. Currently, the bond market is pricing in that interest rate rises in the US will be largely done by early 2023.
Regarding UK fiscal policy, the question is what happens next?
UK interest rate expectations are currently bouncing all over the place, but it is difficult to envisage interest rates at over 5% by Easter 2023 as are priced in by the current forward curve. As things calm down at the long end of the curve, the short end will look less aggressive.
Even so the recent political turmoil will likely lead to interest rates being higher than they would have been due to loss of confidence in the UK Government whilst there will be some cyclical damage to the economy in terms of lower confidence and a slowdown that we can already see in the housing market. It feels inevitable that if mortgage rates settle at 5% or above, house prices will have to fall in nominal terms. There will also be a significant squeeze on consumer cash flows for some households as they come off higher rates.
But set against this:
In the very near term, some political stability and in turn reduced volatility in the bond and mortgage markets are likely to have the biggest impact on corporate and consumer confidence and in turn spending.
Oil – the decision by OPEC + cartel to cut oil production by 2m barrels per day, was significant, as it showed that the Saudis viewed the floor price that they were willing to defend as being around $90 a barrel. Looking ahead the oil market is likely to remain very tight given still growing demand and very little investment.
Gas – the sabotage of the Nordstream pipelines has brought an end to the debate about whether or not Russia would turn the gas taps back on to Northern Europe. Russia is now clearly going backwards in the war in Ukraine so aside from a removal of Putin, it feels unlikely that there will be any de-escalation soon. This leaves analysts focused on European supply and demand for this winter. Whilst it is early days, the news on both is currently reasonably positive.
For a fuller version of Clarion’s Economic and Stock Market Commentary, written by Clarion Group Chairman Keith Thompson, please click here
Strategy
Bonds have seen severe volatility since the fiscal statement, and reinforce the warnings given in previous diaries that the risk of long-dated bonds is much greater than traditional finance interpretation. The BoE’s plan for gilt sales in the imminent future is also explicitly intending to sell bonds through 3–20-year residual maturities, which will leave short-duration gilts free from direct impact:
For Q4 2022, these gilt sales operations will be distributed evenly across the short and medium maturity sectors only. These sectors are defined as: gilts with a residual maturity of between 3-7 years (short), and those with a residual maturity of between 7-20 years (medium). The maturity split of gilt sales for subsequent quarters will be considered ahead of Q1 2023.
The managers continue to overweight short-duration bonds which are less impacted by financial conditions while still offering attractive yields.
UK equities remain undervalued, and the risk of recession has been very much priced into mid and small cap companies. Large cap equities remain propped up by weak sterling with many of these companies’ deriving revenue in dollars. There is substantial opportunity for upward re-rating from this point if political stability can be achieved along with an improvement in sentiment.
US equities, particularly mega-caps, continue to struggle as inflation prints surprise above expectations despite the aggressive rate hiking cycle instigated by the Federal Reserve. Consumer sentiment and spending power remain high in the top four quintiles of the populace and the labour market is still tight, and many companies will likely continue to do well. The Committee continue to allocate capital to the wider US equity market and avoid extensive exposure to the top of the S&P 500 and growth style companies.
Asia Pacific equities offer a contrarian option with lower inflationary pressure and loose monetary policy. Valuations in the region are not excessive and the increasing demographic trend towards a burgeoning middle class bodes well for future growth in the region. Seeing through the short-term noise of Covid challenges and potential political risk, the Committee continue to allocate capital in the region with a long-term bullish outlook in mind.
As mentioned in previous Diaries we remain positive for the prospects of emerging markets for demographic reason and because they are home to one of the most sought-after electronic components of the decade – the semiconductor chip. Also, companies in this region are likely to become beneficiaries of the drift away from doing business with Chinese Companies.
We avoid investments with a single country remit investing into China, India, Russia, and Brazil.
In view of the heightened level of global economic uncertainty, after careful deliberation, there was unanimous agreement to only make very minor changes to the Clarion portfolios. The key themes can be summarised below:
A new market cycle has begun with a rapid normalisation of interest rates and higher inflation expectations. Cash is unattractive as inflationary pressures are structurally long term due to falling trust amongst leading global economies. Identifying ‘quality’ assets is important to protect and grow the value of savings over the long term. Continuing to hold diversified high-quality assets over the longer term remains the appropriate method for allocation of investor capital.
Keith W Thompson
Clarion Group Chairman
October 2022
Creating better lives now and in the future for our clients, their families and those who are important to them.
The chart below shows the historical performance of the Defender Portfolio against a relevant benchmark since the start of the available data.
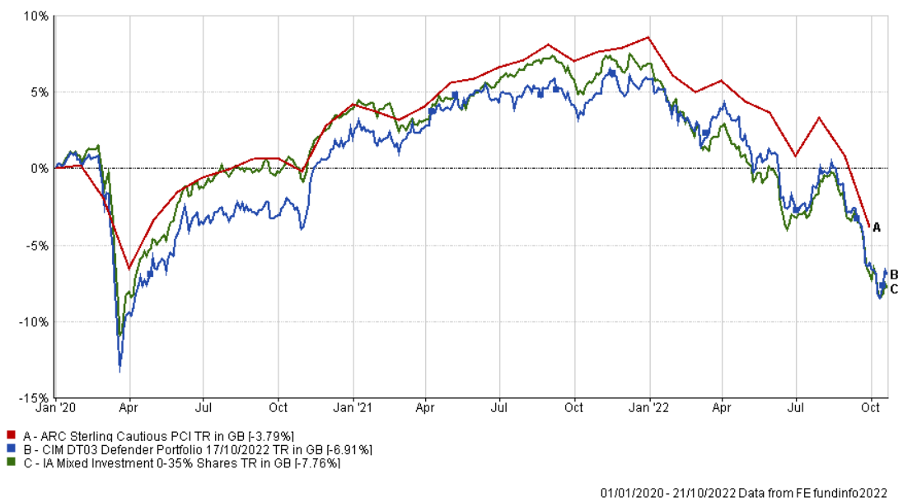
The table below shows the annualised performance to the last quarter end:
| 30/09/21 30/09/20
to to 30/09/22 30/09/21 |
|
| CIM DT03 Defender Portfolio | -9.90% 7.42% |
| ARC Sterling Cautious PCI | -10.13% 6.33% |
| IA Mixed Investment 0-35% Shares | -12.00% 6.02% |
The chart below shows the historical performance of the Prudence Portfolio against a relevant benchmark since the start of the available data.
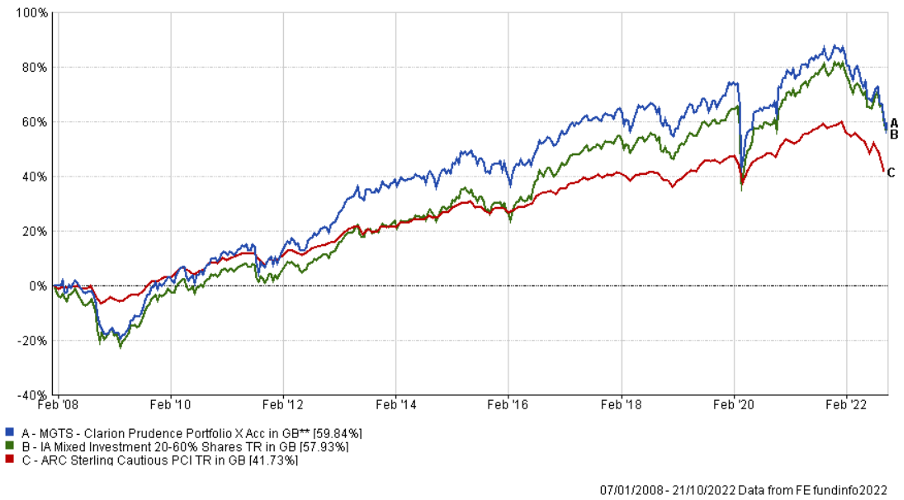
The table below shows the annualised performance to the last quarter end:
| 30/09/21 to 30/09/22 | 30/09/20 to 30/09/21 | 30/09/19 to 30/09/20 | 30/09/18 to 30/09/19 | 30/09/17 to 30/09/18 | |
| MGTS Clarion Prudence X Acc | -12.39% | 11.63% | -2.00% | 1.83% | 2.90% |
| CIM DT04 Prudence Portfolio | -12.56% | 11.66% | -1.23% | 2.54% | 2.93% |
| ARC Sterling Cautious PCI | -10.13% | 6.33% | 1.52% | 3.40% | 1.29% |
| IA Mixed Investment 20-60% Shares | -10.56% | 12.21% | -1.19% | 4.01% | 2.60% |
The chart below shows the historical performance of the Navigator Portfolio against a relevant benchmark since the start of the available data.
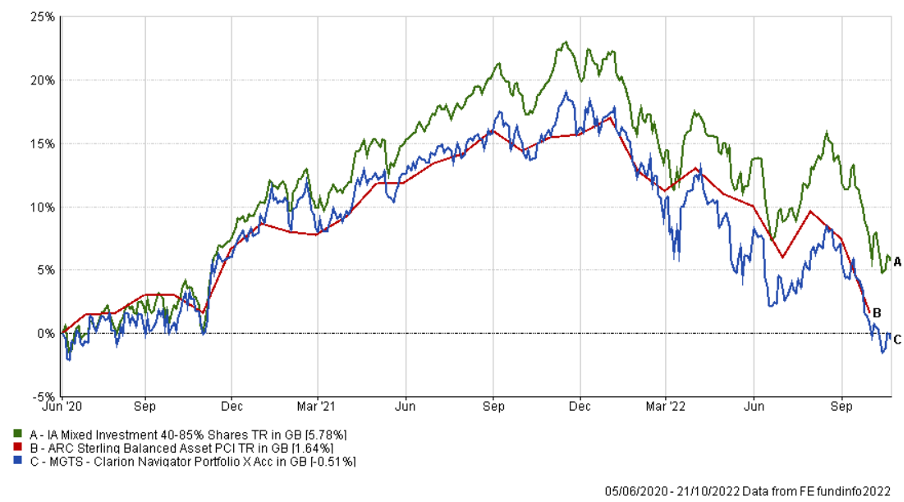
The table below shows the annualised performance to the last quarter end:
| 30/09/21
to 30/09/22 |
30/09/20
to 30/09/21 |
|
| MGTS Clarion Navigator X Acc | -12.48% | 14.17% |
| CIM DT05 Navigator Portfolio | -12.77% | 14.32% |
| IA Mixed Investment 40-85% Shares | -10.15% | 16.63% |
ARC Sterling Balanced Asset PCI -11.13% 10.93%
The chart below shows the historical performance of the Meridian Portfolio against a relevant benchmark since the start of the available data.
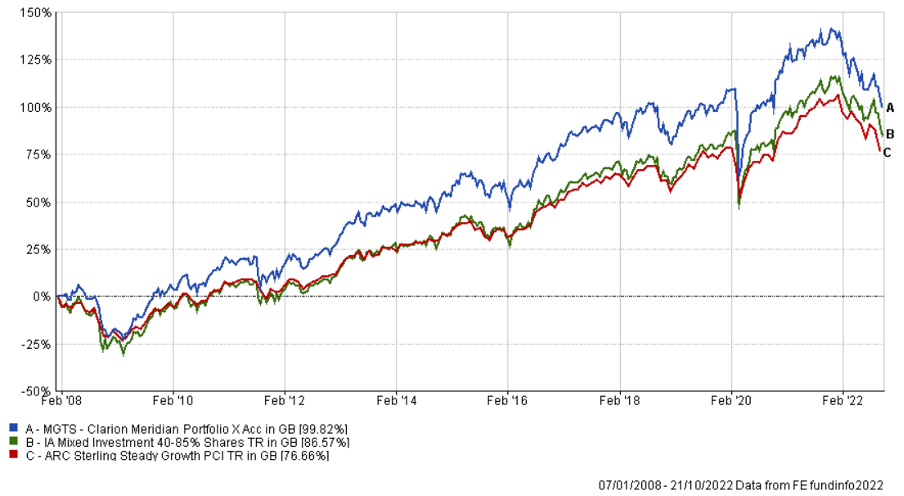
The table below shows the annualised performance to the last quarter end:
| 30/09/21 to 30/09/22 | 30/09/20 to 30/09/21 | 30/09/19 to 30/09/20 | 30/09/18 to 30/09/19 | 30/09/17 to 30/09/18 | |
| MGTS Clarion Meridian X Acc | -13.52% | 16.76% | 0.00% | 0.99% | 6.39% |
| CIM DT06 Meridian Portfolio | -14.02% | 17.08% | 0.93% | 3.36% | 5.31% |
| ARC Steady Growth PCI | -12.02% | 15.04% | -0.16% | 3.82% | 5.15% |
| IA Mixed Investment 40-85% Shares | -10.15% | 16.63% | -0.19% | 4.20% | 5.35% |
The chart below shows the historical performance of the Explorer Portfolio against a relevant benchmark since the start of the available data.
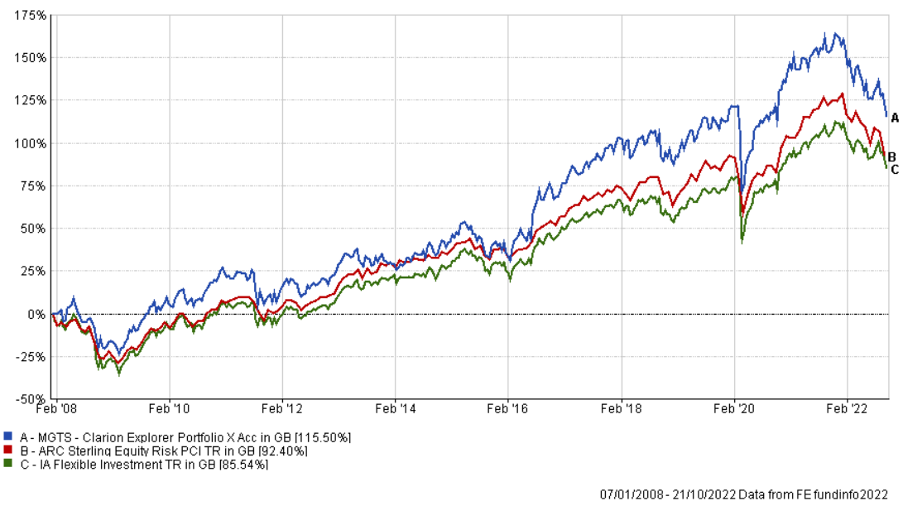
The table below shows the annualised performance to the last quarter end:
| 30/09/21 to 30/09/22 | 30/09/20 to 30/09/21 | 30/09/19 to 30/09/20 | 30/09/18 to 30/09/19 | 30/09/17 to 30/09/18 | |
| MGTS Clarion Explorer X Acc | -14.01% | 18.75% | 0.86% | 4.48% | 8.58% |
| CIM DT07 Explorer Portfolio | -14.97% | 19.03% | 1.21% | 3.97% | 9.27% |
| ARC Equity Risk PCI | -13.49% | 19.42% | -0.25% | 3.84% | 6.53% |
| IA Flexible Investment | -9.19% | 18.30% | 0.88% | 3.24% | 5.37% |
The chart below shows the historical performance of the Voyager Portfolio against a relevant benchmark since the start of the available data.
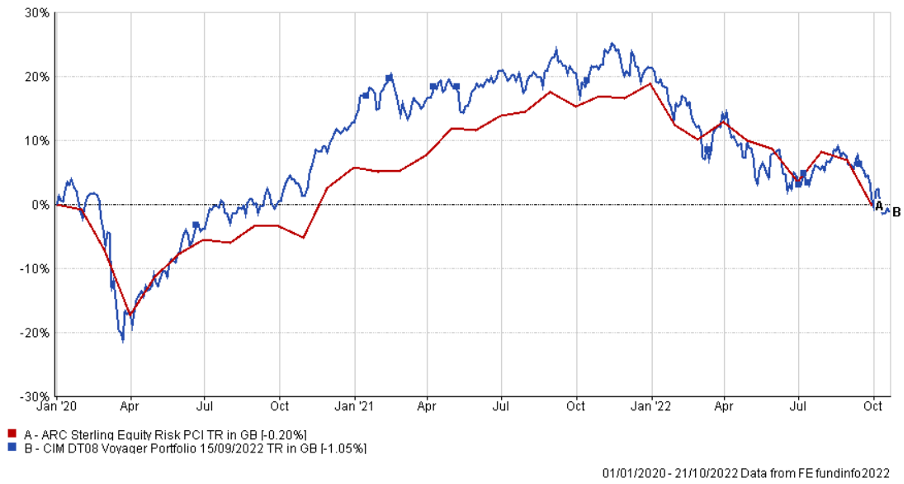
The table below shows the annualised performance to the last quarter end:
| 30/09/21
to 30/09/22 |
30/09/20
to 30/09/21 |
|||||
| CIM DT08 Voyager Portfolio | -16.47% | 19.86% | ||||
| ARC Equity Risk PCI | -13.49% | 19.42% |
The chart below shows the historical performance of the Adventurer Portfolio against a relevant benchmark since the start of the available data.
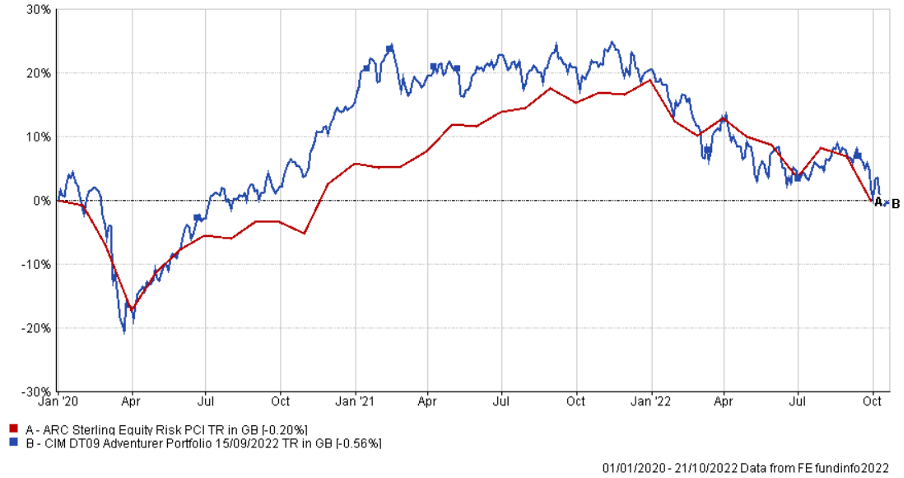
The table below shows the annualised performance to the last quarter end:
| 30/09/21
to 30/09/22 |
30/09/20
to 30/09/21 |
||||
| CIM DT09 Adventurer Portfolio | -15.98% | 18.32% | |||
| ARC Equity Risk PCI | -13.49% | 19.42% |
The chart below shows the historical performance of the Pioneer Portfolio against a relevant benchmark since the start of the available data.
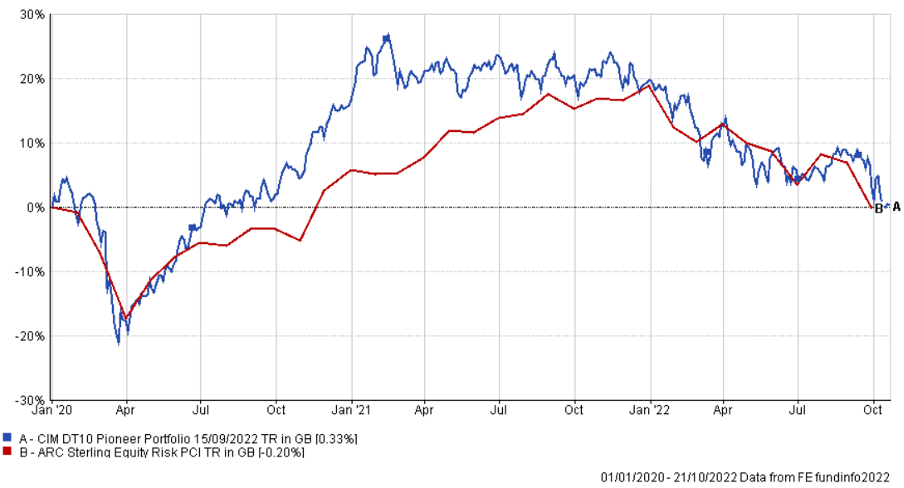
The table below shows the annualised performance to the last quarter end:
| 30/09/21
to 30/09/22 |
30/09/20
to 30/09/21 |
||||
| CIM DT10 Pioneer Portfolio | -14.63% | 18.18% | |||
| ARC Equity Risk PCI | -13.49% | 19.42% |
The content of this article does not constitute financial advice and you may wish to seek professional advice based on your individual circumstances before making any financial decisions.
Any investment performance figures referred to relate to past performance which is not a reliable indicator of future results and should not be the sole factor of consideration when selecting a product or strategy. The value of investments, and the income arising from them, can go down as well as up and is not guaranteed, which means that you may not get back what you invested. Unless indicated otherwise, performance figures are stated in British Pounds. Where performance figures are stated in other currencies, changes in exchange rates may also cause an investment to fluctuate in value.
If you’d like more information about this article, or any other aspect of our true lifelong financial planning, we’d be happy to hear from you. Please call +44 (0)1625 466 360 or email [email protected].
Click here to sign-up to The Clarion for regular updates.