The Clarion Investment Committee met on 23 October 2024. The following notes summarise the main points of consideration in the Investment Committee discussions but have been updated to include commentary on recent events and the wider implications for financial markets.
Economic, Political and Business Snapshot
Economics
- The US economy added 254,000 jobs in September and the unemployment rate dipped to 4.1%, beating expectations and bucking the recent trend of a slowdown in the labour market.
- UK inflation fell to 1.7% in the year to September, the lowest rate since April 2021. Markets now expect the Bank to announce two rate cuts before the end of the year.
- China announced a near-doubling of credit support for some housing projects to $562 billion, the latest in a number of interventions by the Chinese government aiming to boost growth.
- Early estimates of activity in October from surveys of purchasing managers suggest an acceleration in growth in the US, continuing contraction in the euro area and continuing but slightly slower growth in the UK.
- Manufacturing activity continued to lag behind services activity with a fall in activity in the US and the euro area and slowing growth in the UK.
- The International Monetary Fund said that “the global battle against inflation has largely been won” and called for a “triple pivot” on global economic policy – cuts to interest rates, lower public borrowing and reforms to boost growth.
- The UK government published an impact assessment that showed its Employment Rights Bill is expected to cost businesses at least £0.9 billion and no more than £5 billion a year.
- Sentiment in the UK manufacturing sector fell in October at the fastest pace in two years, according to the Confederation of British Industry.
- UK consumer confidence ticked down in October following a larger fall the previous month.
- UK car production fell 20.6% in September compared with the same month last year, as factories reduced production of existing models to readjust for new zero-emission vehicles, according to the Society of Motor Manufacturers and Traders.
- New car registrations in the EU fell 6.1% in September compared with the same month last year, highlighting the ongoing pressures in the sector.
- Gold prices reached a fresh record of $2,748.38 per troy ounce, amid geopolitical uncertainties and falling global interest rates.
- The Bank of Canada lowered interest rates by 0.5 percentage points to 3.75%, its fourth consecutive cut amid inflation rates currently below the bank’s 2% target.
- Listed Chinese companies have bought back over $33 billion of their shares so far in 2024, a record high.
Business
- Car manufacturer General Motors increased its investment in a US lithium mine by 45% to $945 million as part of a joint venture with Lithium Americas in a bid to ensure future supplies used in the production of electric vehicles.
- UK revenue of car manufacturer Tesla fell in 2023, the first annual fall in 10 years.
- The UK government said that it will “crack down on spiralling costs” of car insurance by creating a new cross-department taskforce.
- HSBC announced an overhaul of its structure that included creating separate business units in the UK and Hong Kong.
- Aerospace company Boeing’s latest pay offer was rejected by its 33,000 striking workers.
- Returns of UK online retail orders are expected to reach £27 billion this year, according to analysis by Retail Economics, with “serial returners” contributing approximately 25% to total returns.
- UK music exports rose to record levels of £775 million in 2023, according to figures from trade body BPI.
- Heathrow Airport saw record passenger numbers of 30.7 million between June and September this year, attributable to the Olympic games and large music concerts taking place over the summer.
- The UK government proposed legislation to modernise data laws, claiming it would unlock “the secure and effective use of data for the public interest”.
- Troubled UK utility Thames Water is seeking an additional £3 billion in financing from creditors as it warned it could run short on cash by Christmas.
Global and political developments
- Israel launched a major air strike against Iranian missile manufacturing and air defence sites.
- Iran’s leader Ali Khamenei said the attack should not be “exaggerated or downplayed”, which was widely interpreted as meaning that Iran does not plan an immediate response.
- Former US president Donald Trump overtook vice president Kamala Harris for the first time since August in The Economist’s forecast of the US presidential election winner. The Economist forecast that Trump now has a 53% chance of winning, compared to 47% for Harris.
- The Polymarket betting website put the probability of a Trump win at 65%
* Ms Harris remains ahead of Mr Trump in the national opinion polls, although her lead has narrowed since September.
- Japan’s ruling coalition led by the Liberal Democratic Party has lost its parliamentary majority in a surprise outcome that creates significant political uncertainty
- India and China reached an agreement on patrolling their shared border in a bid to ease previous tensions on the issue.
- The US confirmed that North Korean soldiers entered Russian territory, amid fears that North Korean soldiers will support Russia in fighting in Ukraine.
- Turkey launched air strikes into Northern Iraq and Syria following an attack at a Turkish aerospace company which killed five people.
- Ukrainian president Volodymyr Zelenskyy called for Ukrainian membership of NATO as part of his “victory plan” against Russia.
- Canada expelled six Indian diplomats amid tensions regarding the killing of a Sikh separatist in Vancouver last year. India responded by asking six Canadian diplomats to leave the country.
Please click here to access the October Economic and Stock Market Commentary written by Clarion Group Chairman, Keith Thompson.
Commentary & Strategy
- The Investment Committee are maintaining their tactical position of being underweight US stocks and overweight Asia & Emerging Markets and broadly neutral on the UK, Europe and Japan.
- The Investment Committee have become increasingly cautious on the outlook for the US economy, concerned by unsustainably low consumer savings rates as well as by high levels of personal debt. The US government has its own debt issues too. It will need to tackle its fiscal deficit at some stage, providing a further drag on economic growth.
- Inflation is expected to persist and whilst it is likely to dip below 2% in the next few months, the long-term average is expected to be around the 3% level due to wage inflation. Historical high energy costs soon “fall out” of the inflation calculations and services inflation is still high.
- The interest rate cutting cycle has begun and is expected to create optimism into 2025, but a higher interest rate and higher inflation environment will become the new norm.
- US big tech and large cap stocks are likely to underperform because of the current unsustainable high valuations. Faith in AI diminished as costs higher and revenue pushed into the future. Liquidity has been the most significant driver of returns to date but there remains a downside risk to high PE stocks.
- Chinese economy is stagnant but recent announcements of fiscal and monetary stimulus may provide relief.
- It will take a full economic cycle for the inflationary effects of printing money after the global financial crisis and Covid to dissipate.
- After extensive research a number of changes to the underlying funds were agreed. The funds reflect the recent changes to the benchmark allocations as outlined in last month’s diary. Broadly the changes result in a significant reduction in UK and US investments, zero property exposure, country-specific fixed interest exposure being replaced by global funds, an increased exposure to the Far East, Emerging Markets, Japan and Europe and the introduction of Global Infrastructure as a new asset class.
- The new funds are Royal London Short Duration Gilts, Dimensional Global Core Fixed Income, L&G Global Infrastructure Index Fund, Dimensional Global Short Date Bond Fund, Abrdn Global Government Bond Tracker, PGIM Global High Yield Bond Hedged Fund. The Funds to be sold are iShares Overseas Corporate Bond Fund, iShares Targeted Real Estate, Vanguard FTSE All Share, Royal London Sterling Credit Fund.
- Since December 2023, there has been a tilt towards evidence-based factor investing, which involves a disciplined approach backed up by significant amounts of Nobel Prize-winning economic research. Factor investing involves trusting the market but tilting the investment choice towards smaller companies, value companies (those trading at a discount) and profitable companies. The evidence shows that over the long term, these types of investments outperform the typical index tracking and actively managed funds.
- Clarion is accessing these factor-based investments through Dimensional Fund Advisors. At the present time Dimensional are the only investment manager in the UK which offer this type of investment. Since inclusion, investment performance has been impressive, costs have decreased, and it is likely that we will look to introduce more factor-based funds into the portfolios as and when appropriate.
The Clarion funds are well positioned to take advantage of the latest economic conditions and performance year to date has been as follows:
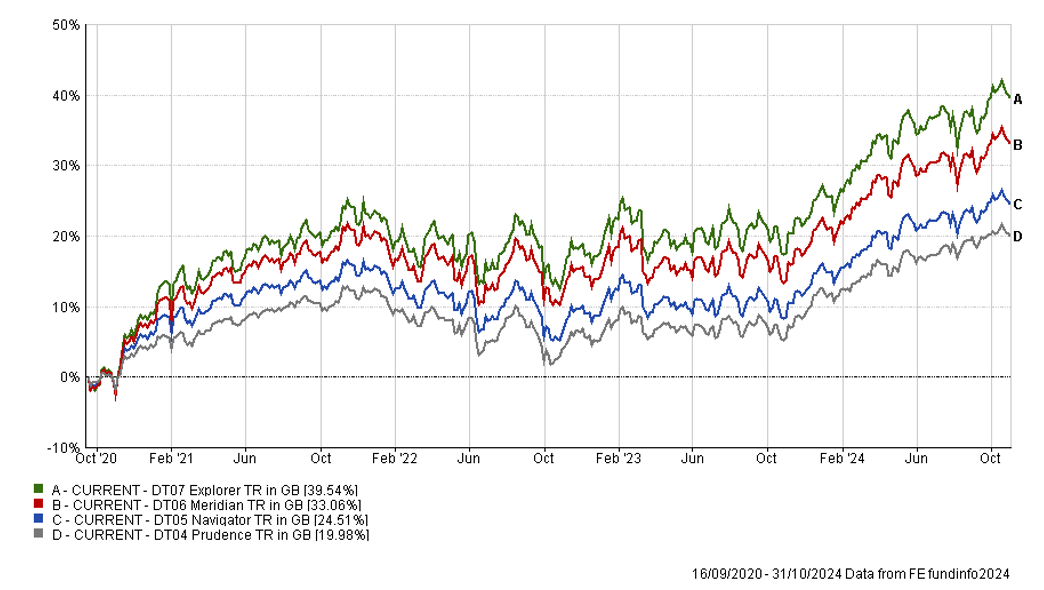
- Explorer has returned 9.72% against the RTMA Risk 5 Growth sector average of 9.42% and the IA Flexible sector average of 7.59%
- Meridian has returned 8.76% against the RTMA Risk 5 Growth sector average of 9.42% and the IA Mixed Investment 40-85% Shares sector average of 7.64%
- Navigator has returned 7.63% against the RTMA Risk 4 Balanced sector average of 7.30% and the IA Mixed Investment 40-85% Shares sector average of 7.64%
- Prudence has returned 5.54% against the RTMA Risk 3 Moderate sector average of 5.58% and the IA Mixed Investment 20-60% Shares sector average of 5.51%
The performance of the CURRENT portfolios back tested since the start of the available data in September 2020 is shown in the chart below. This is assuming that we made the recent changes at that time, and then adopted the buy and hold approach favoured when using evidence-based factor investing.
Clarion Funds & Discretionary Portfolios:
Defender Managed Portfolio
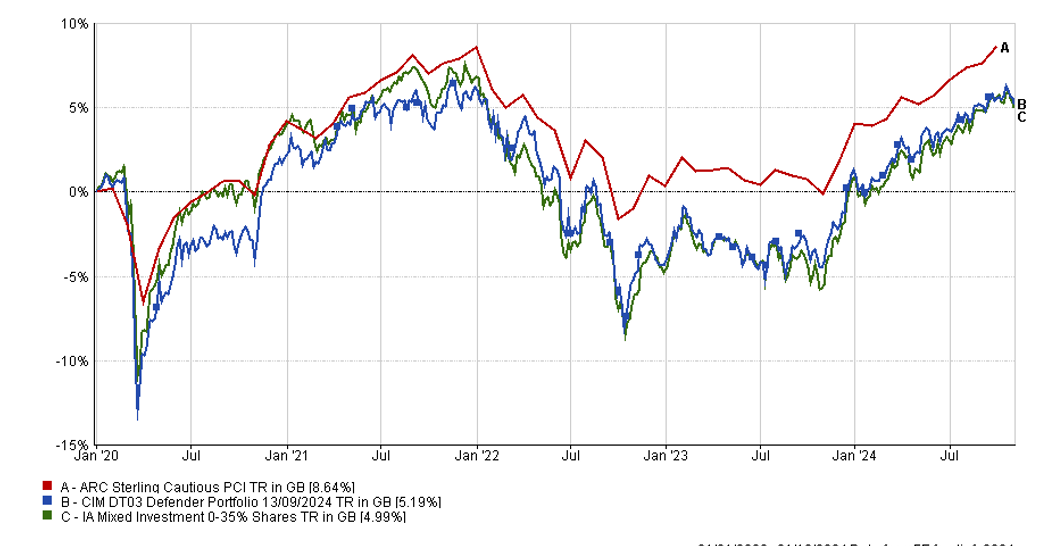
The chart below shows the historical performance of the Defender Portfolio against a relevant benchmark since the start of the available data.
The table below shows the annualised performance to the last quarter end:

Changes to the Defender Portfolio
- Cash was reduced from 10.50% to 10.00%
- Royal London Short Term Money Market was increased from 9.00% to 10.00%
- abrdn Short Dated Global Corporate Bond Tracker was reduced from 10.50% to 7.50%
- iShares ESG Overseas Corporate Bond Index was removed from the portfolio (10.50% to 0.00%)
- iShares MSCI Target UK Real Estate was removed from the portfolio (2.00% to 0.00%)
- ARC Time Social Long Income was removed from the portfolio (1.50% to 0.00%)
- Artemis Corporate Bond was reduced from 4.20% to 3.00%
- Fidelity Short Dated Corporate Bond was reduced from 5.60% to 4.00%
- Royal London Sterling Credit was reduced from 4.20% to 3.00%
- Dimensional UK Core Equity was increased from 2.25% to 2.50%
- Dimensional UK Small Companies was reduced from 1.35% to 1.25%
- Dimensional UK Value was reduced from 2.25% to 1.25%
- Vanguard FTSE UK All Share Index was removed from the portfolio (3.15% to 0.00%)
- Dimensional US Core Equity was reduced from 5.00% to 3.50%
- Dimensional US Small Companies was reduced from 2.50% to 1.75%
- Fidelity Index US P was reduced from 2.50% to 1.75%
- iShares $ TIPS was reduced from 8.00% to 7.00%
- Dimensional Global Core Fixed Income was added to the portfolio (7.50%)
- Dimensional Global Short Dated Bond was added to the portfolio (7.00%)
- Abrdn Global Government Bond Tracker was added to the portfolio (7.00%)
- L&G Global Listed Infrastructure was added to the portfolio (7.00%)
Prudence Fund & Managed Portfolio
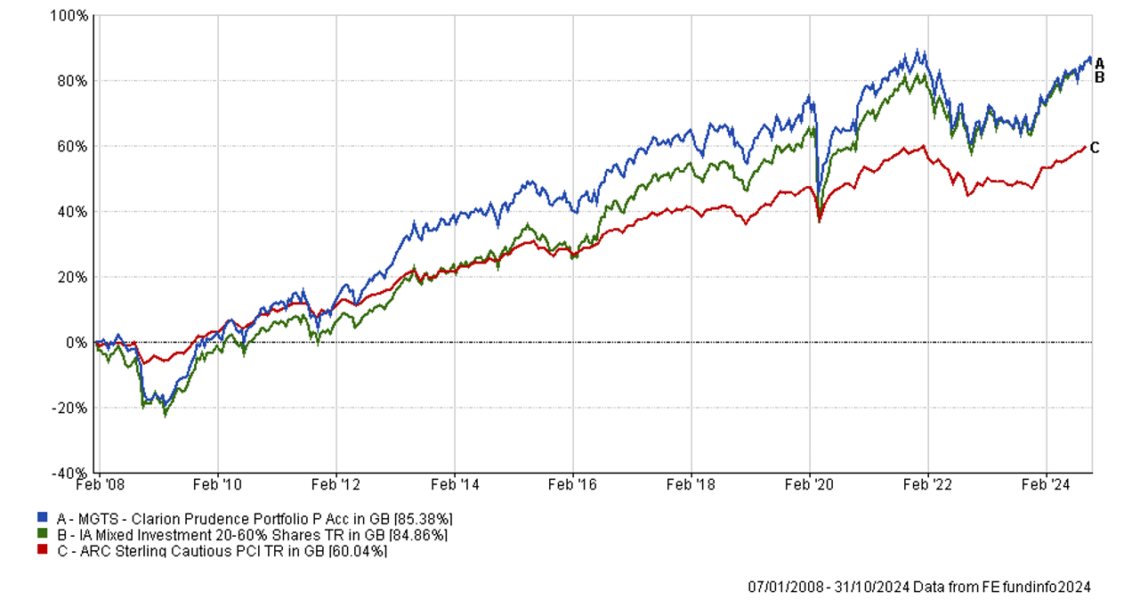
The chart below shows the historical performance of the Prudence Portfolio against a relevant benchmark since the start of the available data.
The table below shows the annualised performance to the last quarter end:

Changes to the Prudence Fund & Portfolio
- Cash was reduced from 3.50% to 2.00%
- Royal London Short Term Money Market was reduced from 8.00% to 6.00%
- iShares UK Gilts 0-5Yr was increased from 5.00% to 7.00%
- Abrdn Short Dated Global Corporate Bond Tracker was reduced from 7.00% to 6.50%
- iShares ESG Overseas Corporate Bond Index was removed from the portfolio (7.00% to 0.00%)
- iShares MSCI Target UK Real Estate was removed from the portfolio (2.00% to 0.00%)
- ARC Time Social Long Income was removed from the portfolio (1.50% to 0.00%)
- Artemis Corporate Bond was reduced from 4.80% to 3.00%
- Fidelity Short Dated Corporate Bond was reduced from 6.40% to 4.00%
- Royal London Sterling Credit was reduced from 4.80% to 3.00%
- Dimensional UK Core Equity was increased from 3.00% to 3.50%
- Dimensional UK Small Companies was reduced from 1.80% to 1.75%
- Dimensional UK Value was reduced from 3.00% to 1.75%
- Vanguard FTSE UK All Share Index was removed from the portfolio (4.20% to 0.00%)
- Dimensional US Core Equity was reduced from 7.50% to 6.50%
- Dimensional US Small Companies was reduced from 3.75% to 3.25%
- Fidelity Index US P was reduced from 3.75% to 3.25%
- Dimensional Global Core Fixed Income was added to the portfolio (6.50%)
- Dimensional Global Short Dated Bond was added to the portfolio (5.50%)
- Abrdn Global Government Bond Tracker was added to the portfolio (5.50%)
- L&G Global Listed Infrastructure was added to the portfolio (8.00%)
Navigator Fund & Managed Portfolio
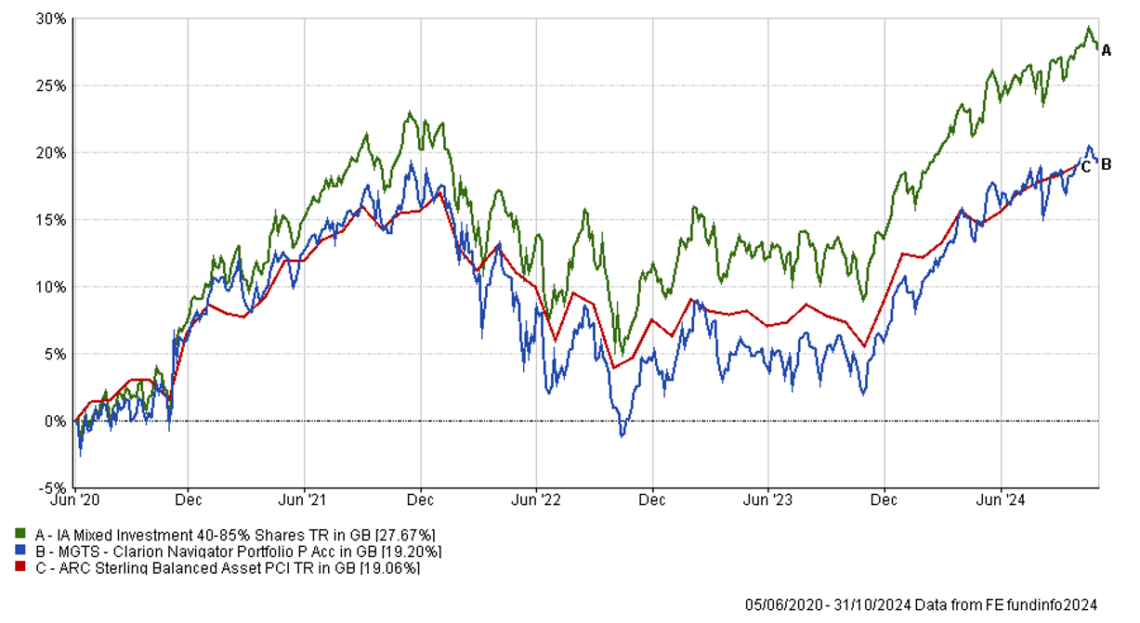
The chart below shows the historical performance of the Navigator Portfolio against a relevant benchmark since the start of the available data.
The table below shows the annualised performance to the last quarter end:

Changes to the Navigator Fund & Portfolio
- Cash was reduced from 3.50% to 2.00%
- Royal London Short Term Money Market was reduced from 5.00% to 2.00%
- Abrdn Asia Pacific Equity Enhanced Index was reduced from 4.00% to 3.00%
- Dimensional Emerging Markets Core Equity was increased from 4.00% to 6.00%
- iShares UK Gilts 0-5Yr was increased from 3.00% to 7.00%
- iShares ESG Overseas Corporate Bond Index was removed from the portfolio (4.50% to 0.00%)
- iShares MSCI Target UK Real Estate was removed from the portfolio (2.00% to 0.00%)
- ARC Time Social Long Income was removed from the portfolio (1.50% to 0.00%)
- Fidelity Short Dated Corporate Bond was reduced from 4.00% to 3.00%
- Royal London Sterling Credit was removed from the portfolio (3.00% to 0.00%)
- Dimensional UK Core Equity was reduced from 5.25% to 3.50%
- Dimensional UK Small Companies was reduced from 3.15% to 1.75%
- Dimensional UK Value was reduced from 5.25% to 1.75%
- Vanguard FTSE UK All Share Index was removed from the portfolio (7.35% to 0.00%)
- Dimensional US Core Equity was reduced from 10.00% to 6.50%
- Dimensional US Small Companies was reduced from 5.50% to 3.25%
- Fidelity Index US P was reduced from 6.50% to 3.25%
- iShares $ TIPS was increased from 3.00% to 4.00%
- Baillie Gifford Pacific was added to the portfolio (3.00%)
- Schroder Asian Income was added to the portfolio (2.00%)
- Schroder Institutional Pacific was added to the portfolio (2.00%)
- Dimensional Emerging Markets Targeted Value was added to the portfolio (2.00%)
- JPM Emerging Markets Income was added to the portfolio (2.00%)
- Dimensional Global Core Fixed Income was added to the portfolio (4.50%)
- Dimensional Global Short Dated Bond was added to the portfolio (5.00%)
- Abrdn Global Government Bond Tracker was added to the portfolio (5.00%)
- L&G Global Listed Infrastructure was added to the portfolio (8.00%)
Meridian Fund & Managed Portfolio
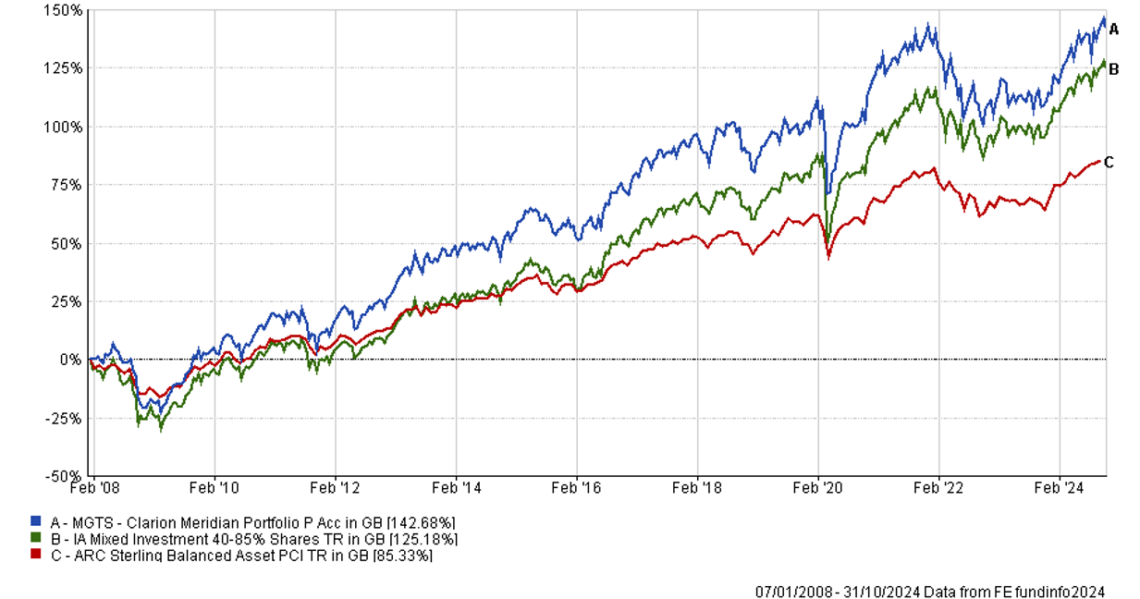
The chart below shows the historical performance of the Meridian Portfolio against a relevant benchmark since the start of the available data.
The table below shows the annualised performance to the last quarter end:

Changes to the Meridian Fund & Portfolio
- Cash was reduced from 3.50% to 2.00%
- Royal London Short Term Money Market was removed from the portfolio (2.00% to 0.00%)
- Abrdn Asia Pacific Equity Enhanced Index was increased from 3.00% to 3.90%
- Baillie Gifford Pacific was increased from 3.00% to 3.90%
- Schroder Asian Income was increased from 2.00% to 2.60%
- Schroder Institutional Pacific was increased from 2.00% to 2.60%
- Dimensional Emerging Markets Core Equity was increased from 6.00% to 7.80%
- Dimensional Emerging Markets Targeted Value was increased from 2.00% to 2.60%
- JPM Emerging Markets Income was increased from 2.00% to 2.60%
- Dimensional European Value was increased from 2.40% to 2.80%
- HSBC European Index was increased from 3.60% to 4.20%
- abrdn Short Dated Global Corporate Bond Tracker was increased from 3.50% to 4.50%
- iShares ESG Overseas Corporate Bond Index was removed from the portfolio (3.50% to 0.00%)
- iShares MSCI Target UK Real Estate was removed from the portfolio (2.00% to 0.00%)
- ARC Time Social Long Income was removed from the portfolio (1.50% to 0.00%)
- Artemis Corporate Bond was removed from the portfolio (2.40% to 0.00%)
- Fidelity Short Dated Corporate Bond was removed from the portfolio (3.20% to 0.00%)
- Royal London Sterling Credit was removed from the portfolio (2.40% to 0.00%)
- Dimensional UK Core Equity was reduced from 5.50% to 4.00%
- Dimensional UK Small Companies was reduced from 3.30% to 2.00%
- Dimensional UK Value was reduced from 5.50% to 2.00%
- Vanguard FTSE UK All Share Index was removed from the portfolio (7.70% to 0.00%)
- Dimensional US Small Companies was reduced from 5.50% to 5.00%
- Fidelity Index US P was reduced from 6.50% to 5.00%
- Dimensional Global Core Fixed Income was added to the portfolio (4.50%)
- iShares UK Gilts 0-5Yr was added to the portfolio (3.00%)
- Dimensional Global Short Dated Bond was added to the portfolio (4.50%)
- Abrdn Global Government Bond Tracker was added to the portfolio (4.50%)
- L&G Global Listed Infrastructure was added to the portfolio (9.00%)
Explorer Fund & Managed Portfolio
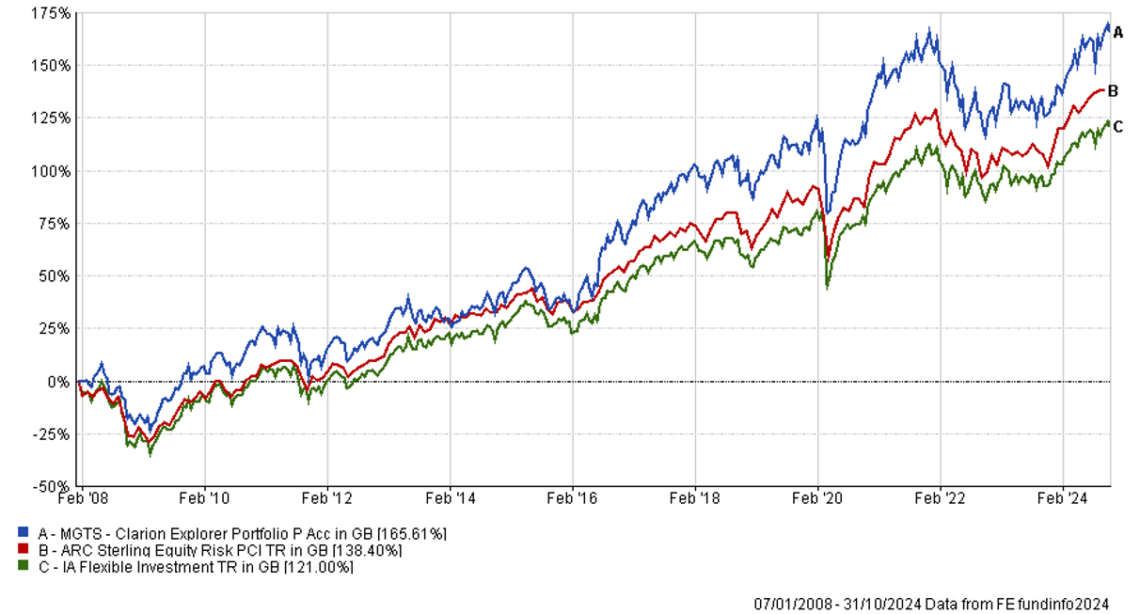
The chart below shows the historical performance of the Explorer Portfolio against a relevant benchmark since the start of the available data.
The table below shows the annualised performance to the last quarter end:

Changes to the Explorer Fund & Portfolio
- Cash was reduced from 3.50% to 2.00%
- Abrdn Asia Pacific Equity Enhanced Index was increased from 3.30% to 5.10%
- Baillie Gifford Pacific was increased from 3.30% to 5.10%
- Schroder Asian Income was increased from 2.20% to 3.40%
- Schroder Institutional Pacific was increased from 2.20% to 3.40%
- Dimensional Emerging Markets Core Equity was increased from 6.60 to 10.00%
- Dimensional Emerging Markets Targeted Value was increased from 2.20% to 4.00%
- JPM Emerging Markets Income was increased from 2.20% to 4.00%
- Dimensional European Value was increased from 2.40% to 2.80%
- HSBC European Index was increased from 3.60% to 4.20%
- iShares ESG Overseas Corporate Bond Index was removed from the portfolio (3.00% to 0.00%)
- iShares Japan Equity Index was increased from 6.00% to 8.00%
- iShares MSCI Target UK Real Estate was removed from the portfolio (2.00% to 0.00%)
- ARC Time Social Long Income was removed from the portfolio (1.50% to 0.00%)
- Dimensional UK Core Equity was reduced from 7.75% to 4.00%
- Dimensional UK Small Companies was reduced from 4.65% to 2.00%
- Dimensional UK Value was reduced from 7.75% to 2.00%
- Vanguard FTSE UK All Share Index was removed from the portfolio (10.85% to 0.00%)
- Dimensional US Small Companies was reduced from 6.25% to 5.00%
- Fidelity Index US P was reduced from 8.75% to 5.00%
- PGIM Global High Yield Bond Hedged was added to the portfolio (5.00%)
- Dimensional Global Core Fixed Income was added to the portfolio (3.00%)
- Abrdn Short Dated Global Corporate Bond Tracker was added to the portfolio (3.00%)
- L&G Global Listed Infrastructure was added to the portfolio (9.00%)
Voyager Managed Portfolio
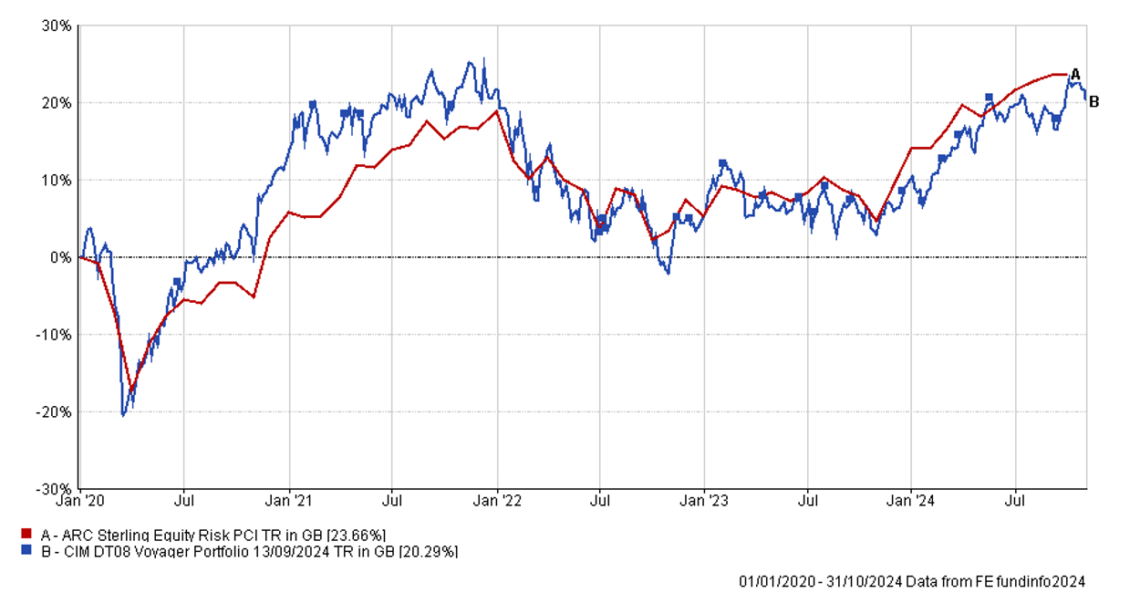
The chart below shows the historical performance of the Voyager Portfolio against a relevant benchmark since the start of the available data.
The table below shows the annualised performance to the last quarter end:

Changes to the Voyager Portfolio
- Cash was reduced from 3.50% to 2.00%
- Dimensional European Value was increased from 2.40% to 2.80%
- HSBC European Index was increased from 3.60% to 4.20%
- iShares ESG Overseas Corporate Bond Index was removed from the portfolio (3.00% to 0.00%)
- iShares Japan Equity Index was increased from 6.00% to 8.00%
- iShares MSCI Target UK Real Estate was removed from the portfolio (2.00% to 0.00%)
- ARC Time Social Long Income was removed from the portfolio (1.50% to 0.00%)
- Dimensional UK Core Equity was increased from 3.50% to 4.00%
- Dimensional UK Small Companies was reduced from 2.10% to 2.00%
- Dimensional UK Value was reduced from 3.50% to 2.00%
- Vanguard FTSE UK All Share Index was removed from the portfolio (4.90% to 0.00%)
- Dimensional US Core Equity was increased from 6.00% to 10.00%
- Dimensional US Small Companies was increased from 3.00% to 5.00%
- Fidelity Index US P was increased from 3.00% to 5.00%
- PGIM Global High Yield Bond Hedged was added to the portfolio (5.00%)
Adventurer Managed Portfolio
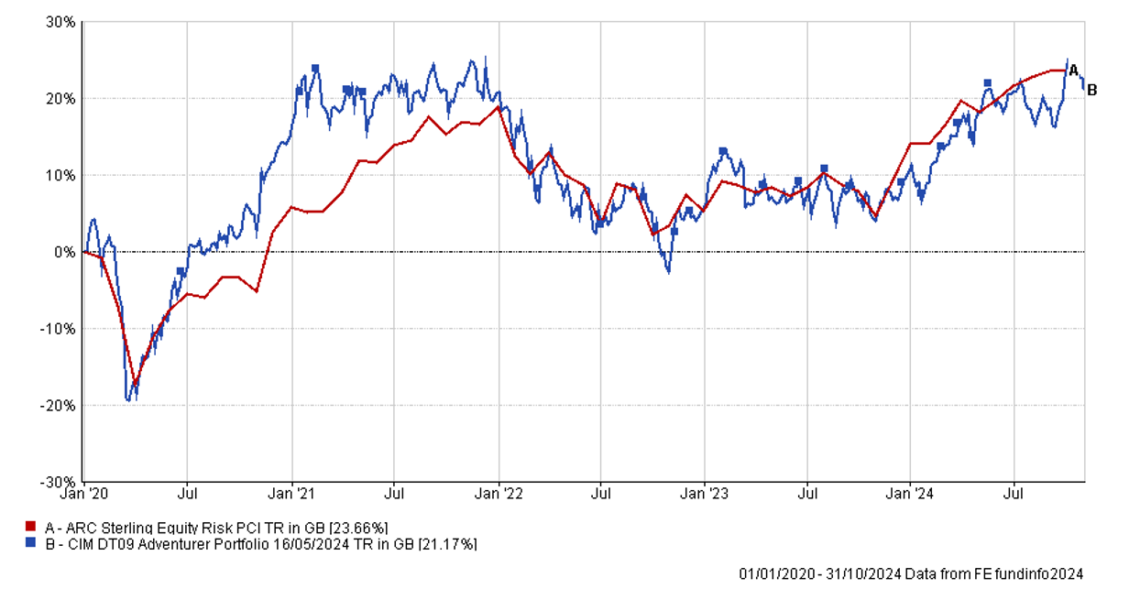
The chart below shows the historical performance of the Adventurer Portfolio against a relevant benchmark since the start of the available data.
The table below shows the annualised performance to the last quarter end:

Changes to the Adventurer Portfolio
- Abrdn Asia Pacific Equity Enhanced Index was increased from 7.80% to 8.10%
- Baillie Gifford Pacific was increased from 7.80% to 8.10%
- Schroder Asian Income was increased from 5.20% to 5.40%
- Schroder Institutional Pacific was increased from 5.20% to 5.40%
- Dimensional Emerging Markets Core Equity was increased from 8.40% to 9.00%
- Dimensional Emerging Markets Targeted Value was increased from 8.40% to 8.50%
- JPM Emerging Markets Income was increased from 8.40% to 8.50%
- Invesco Global Emerging Markets was increased from 8.40% to 8.50%
- Dimensional European Value was increased 2.40% to 2.80%
- HSBC European Index was increased from 3.60% to 4.20%
- Dimensional UK Core Equity was removed from the portfolio (2.50% to 0.00%)
- Dimensional UK Small Companies was removed from the portfolio (1.50% to 0.00%)
- Dimensional UK Value was removed from the portfolio (2.50% to 0.00%)
- Vanguard FTSE UK All Share Index was removed from the portfolio (3.50% to 0.00%)
- Dimensional US Core Equity was increased from 4.00% TO 7.50%
- Dimensional US Small Companies was increased from 2.00% to 3.75%
- Fidelity Index US P was increased from 2.00% to 3.75%
Pioneer Managed Portfolio
The chart below shows the historical performance of the Pioneer Portfolio against a relevant benchmark since the start of the available data.
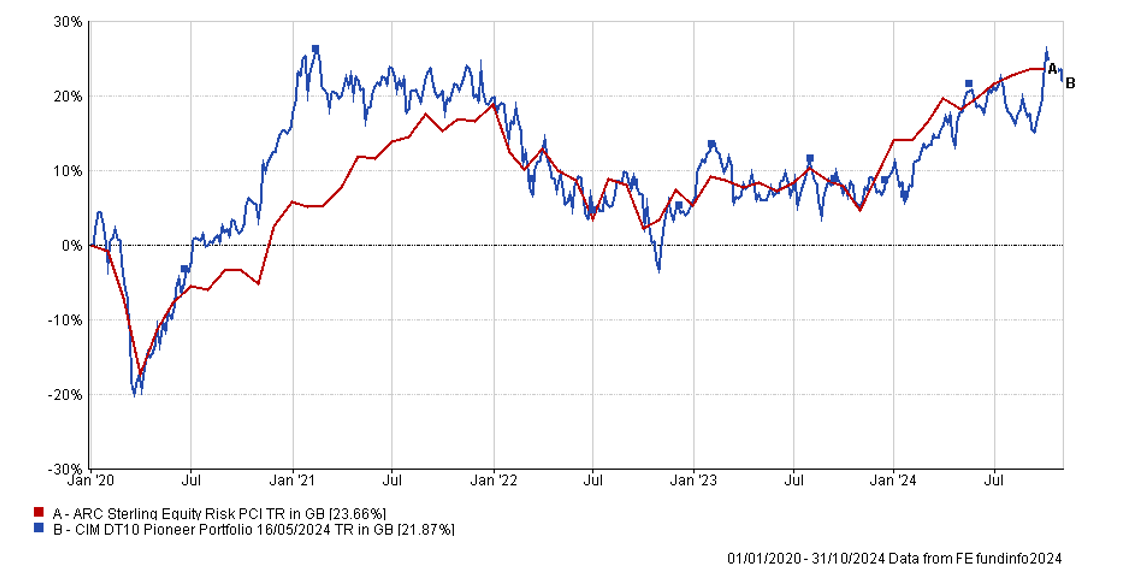
The table below shows the annualised performance to the last quarter end:

Changes to the Pioneer Portfolio
- Abrdn Asia Pacific Equity Enhanced Index was increased from 7.80% to 8.10%
- Baillie Gifford Pacific was increased from 7.80% to 8.10%
- Schroder Asian Income was increased from 5.20% to 5.40%
- Schroder Institutional Pacific was increased from 5.20% to 5.40%
- Fidelity Index Emerging Markets was reduced from 7.00% to 6.50%
- iShares Emerging Markets Equity Index was reduced from 7.00% to 6.50%
- Invesco Global Emerging Markets was increased from 8.40% to 8.50%
- Dimensional US Small Companies was reduced from 4.00% to 2.00%
- Fidelity Index US P was added to the portfolio (2.00%)
Holding a globally diversified portfolio of high-quality assets is important to provide resilience and grow the value of savings over the long term and remains the appropriate method for allocation of investor capital. Cash is unattractive as inflationary pressures, although moderating, look to be structurally long term.
Keith W Thompson
Clarion Group Chairman
October 2024
Risk Warnings
Any investment performance figures referred to relate to past performance which is not a reliable indicator of future results and should not be the sole factor of consideration when selecting a product or strategy. The value of investments, and the income arising from them, can go down as well as up and is not guaranteed, which means that you may not get back what you invested. Unless indicated otherwise, performance figures are stated in British Pounds. Where performance figures are stated in other currencies, changes in exchange rates may also cause an investment to fluctuate in value.
The content of this article does not constitute financial advice, and you may wish to seek professional advice based on your individual circumstances before making any financial decisions.


