True lifelong financial planning for the serious business of life.
True lifelong financial planning
for the serious business of life.
True lifelong financial planning for the serious business of life.
True lifelong financial planning
for the serious business of life.
Tags: Adventurer Portfolio, Defender Portfolio, Discretionary Investment Management, Explorer Portfolio, funds, investment, Meridian Portfolio, MGTS Clarion Explorer, MGTS Clarion Meridian, MGTS Clarion Prudence, MTGS Clarion Navigator, Navigator Portfolio, Pioneer Portfolio, Prudence Portfolio, Voyager Portfolio
Category:
Investment management
This article provides a brief overview of the topics discussed in the recent Investment Committee meeting and the decisions made following those discussions.
The following notes summarise the main points discussed by the Investment Committee.
Investors with a long-term view have historically grown their portfolios more successfully than those with a short-term objective. However, the recent popularity of cryptocurrency investing and short term trading via the Robinhood platform has seen a detachment from this theme with some investors intent on chasing a quick reward without appreciating the risks of this short term strategy.
While the speed and ferocity of China’s crackdown on tech stocks have surprised many investors, increased regulation was to be expected, and this is likely to be the direction of travel for the tech sector globally.
The US is viewed as one of the most stable markets but is dominated by the tech sector; with valuations and adjusted P/E ratios of US tech stocks higher than those in other areas, increased regulation in this sector could see valuations fall even further.
High index exposure to US tech stocks means that active managers are more likely to outperform in market falls and when re-balancing occurs.
South Korea has become the first country to pass a bill that will end Apple and Google’s control overpayments on their app stores, setting a precedent for other countries to follow.
When stocks regarded as ‘growth’ grow too large, they often become value stocks as earnings and valuations adjust to a stable growth phase; companies such as Microsoft are more like modern day utilities than tech stocks.
Bond yields are at record low levels, requiring more and more asset purchasing by central banks to maintain yields at these levels.
Bond yields have risen as the market anticipates the withdrawal of QE, but growth stocks have continued to perform strongly. Recent PMI readings have fallen due to fears surrounding the Delta variant but are expected to rise again which may revive the stock market rotation to value.
The Covid vaccination programme has accelerated worldwide, but the press has not captured this, leading to a less positive market perception.
The end of restrictions in the UK is a test case for global economies; if the UK navigates the winter without further lockdowns, this could set a precedent for the rest of the world.
The risk to bond markets as talk of tapering heats up is palpable. In 2013, treasury yields jumped as the Fed announced that, in the future, the volume of bond purchases would reduce. The scale of central bank intervention is now much greater than in the financial crisis, and the risk of capital loss on bonds, particularly at the long end of the yield curve, far outweighs the benefits of owning them. Our short-dated corporate bond positions ought to outperform in a rising yield environment and, where we are obliged to invest in the bond space, short-dated bonds are our clear preference.
The UK remains at a steep discount compared to other developed equity markets, with many attractive companies trading at reduced earnings ratios. With a wide uptake of the available vaccines, the UK has the chance to emerge from the pandemic ahead of most other economies, which ought to see relative outperformance against other markets. Our overweight position in UK equities is due to these factors.
In Asia, our selection is broadly underweight to China, which has helped to insulate the portfolios from the recent regulatory fallout that has impacted tech stocks.
The elevated state of the US equity market, driven by a narrow tranche of tech stocks at the top of the major indices, is cause for concern. Companies such as Microsoft and Alphabet may well be able to continue growing, but the risk to shareholders is whether or not these companies can justify their earnings multiples so far into the future. There is evident risk of market correction if and when these ratios look unsustainable and, if borrowing costs rise, these stocks could suffer. Our US underweight positioning is on this basis.
For a fuller version of Clarion’s Economic and Stock Market Commentary, written by Clarion Group Chairman Keith Thompson, please click here
The charts below show the tactical asset allocation of the Defender Portfolio against the neutral/strategic asset allocation as well as the historical performance of the portfolio against a relevant benchmark since the start of the available data.
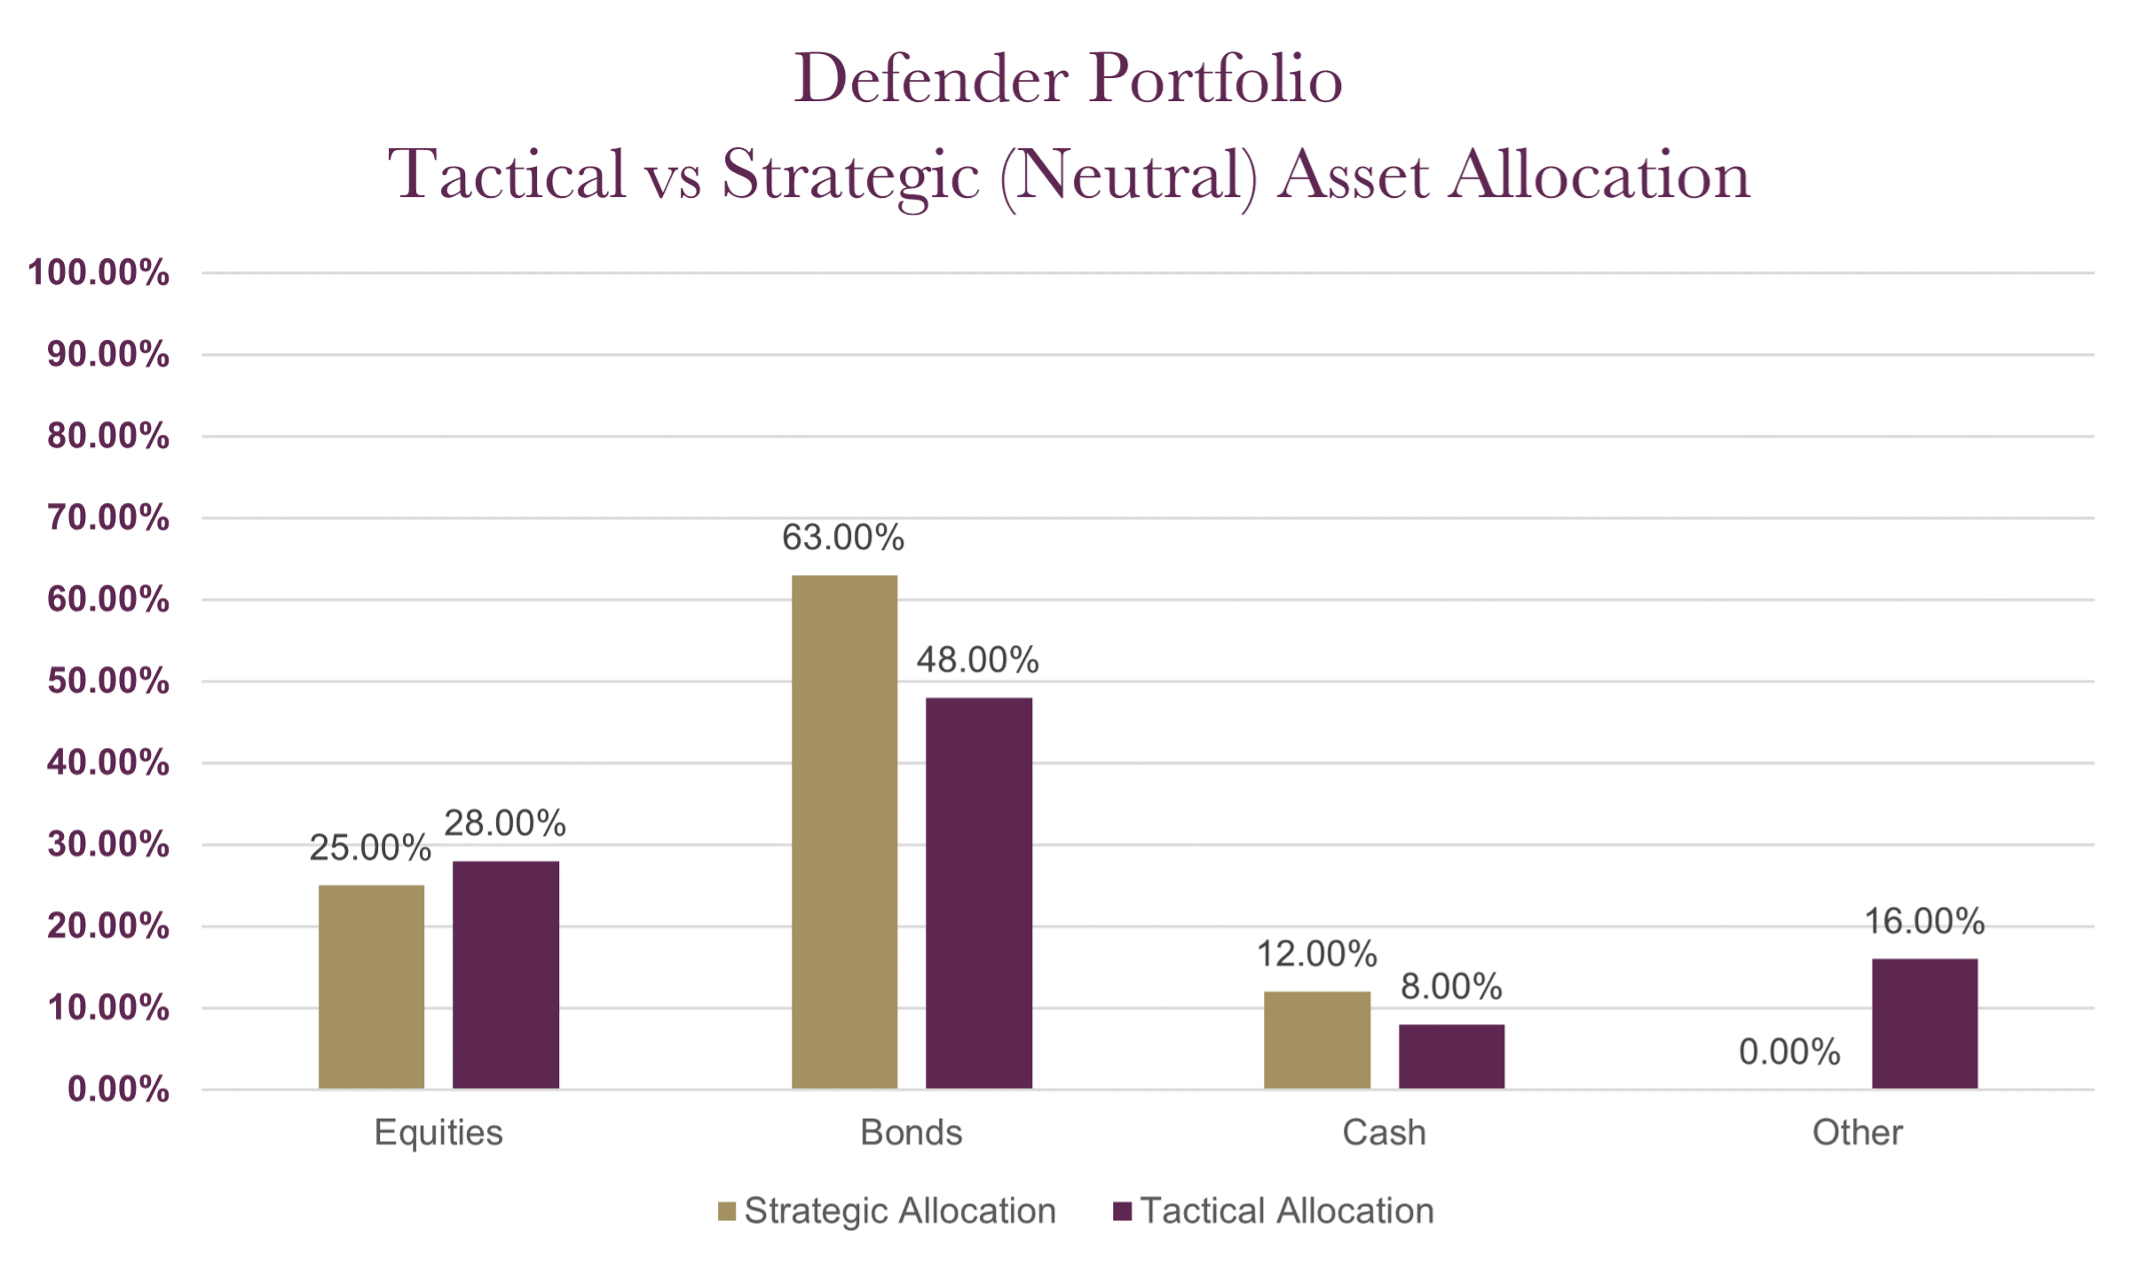
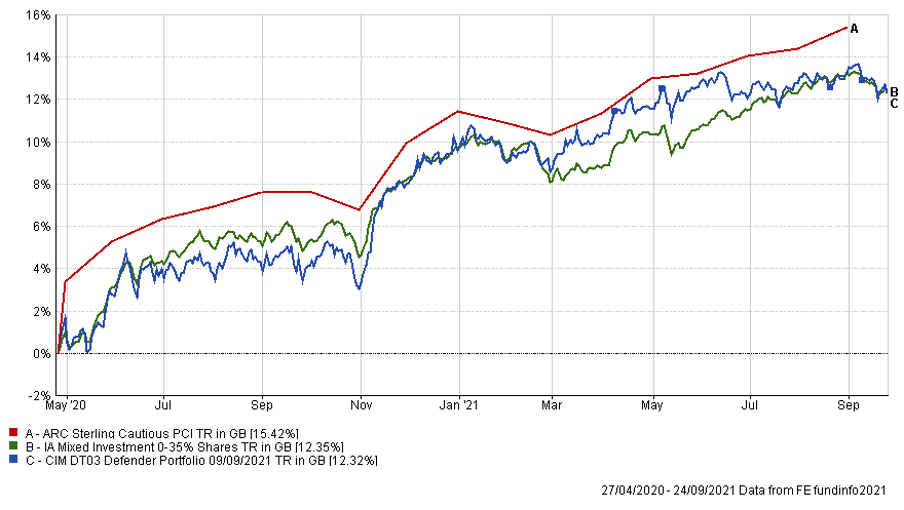
The table below shows the annualised performance to the last quarter end:
| 30/06/20 to 30/06/21 | |
| CIM DT03 Defender Portfolio | 7.35% |
| ARC Sterling Cautious PCI | 7.13% |
| IA Mixed Investment 0-35% Shares | 6.64% |
Changes to the Defender model
The charts below show the tactical asset allocation of the Prudence Portfolio against the neutral/strategic asset allocation as well as the historical performance of the portfolio against a relevant benchmark(s) since the start of the available data.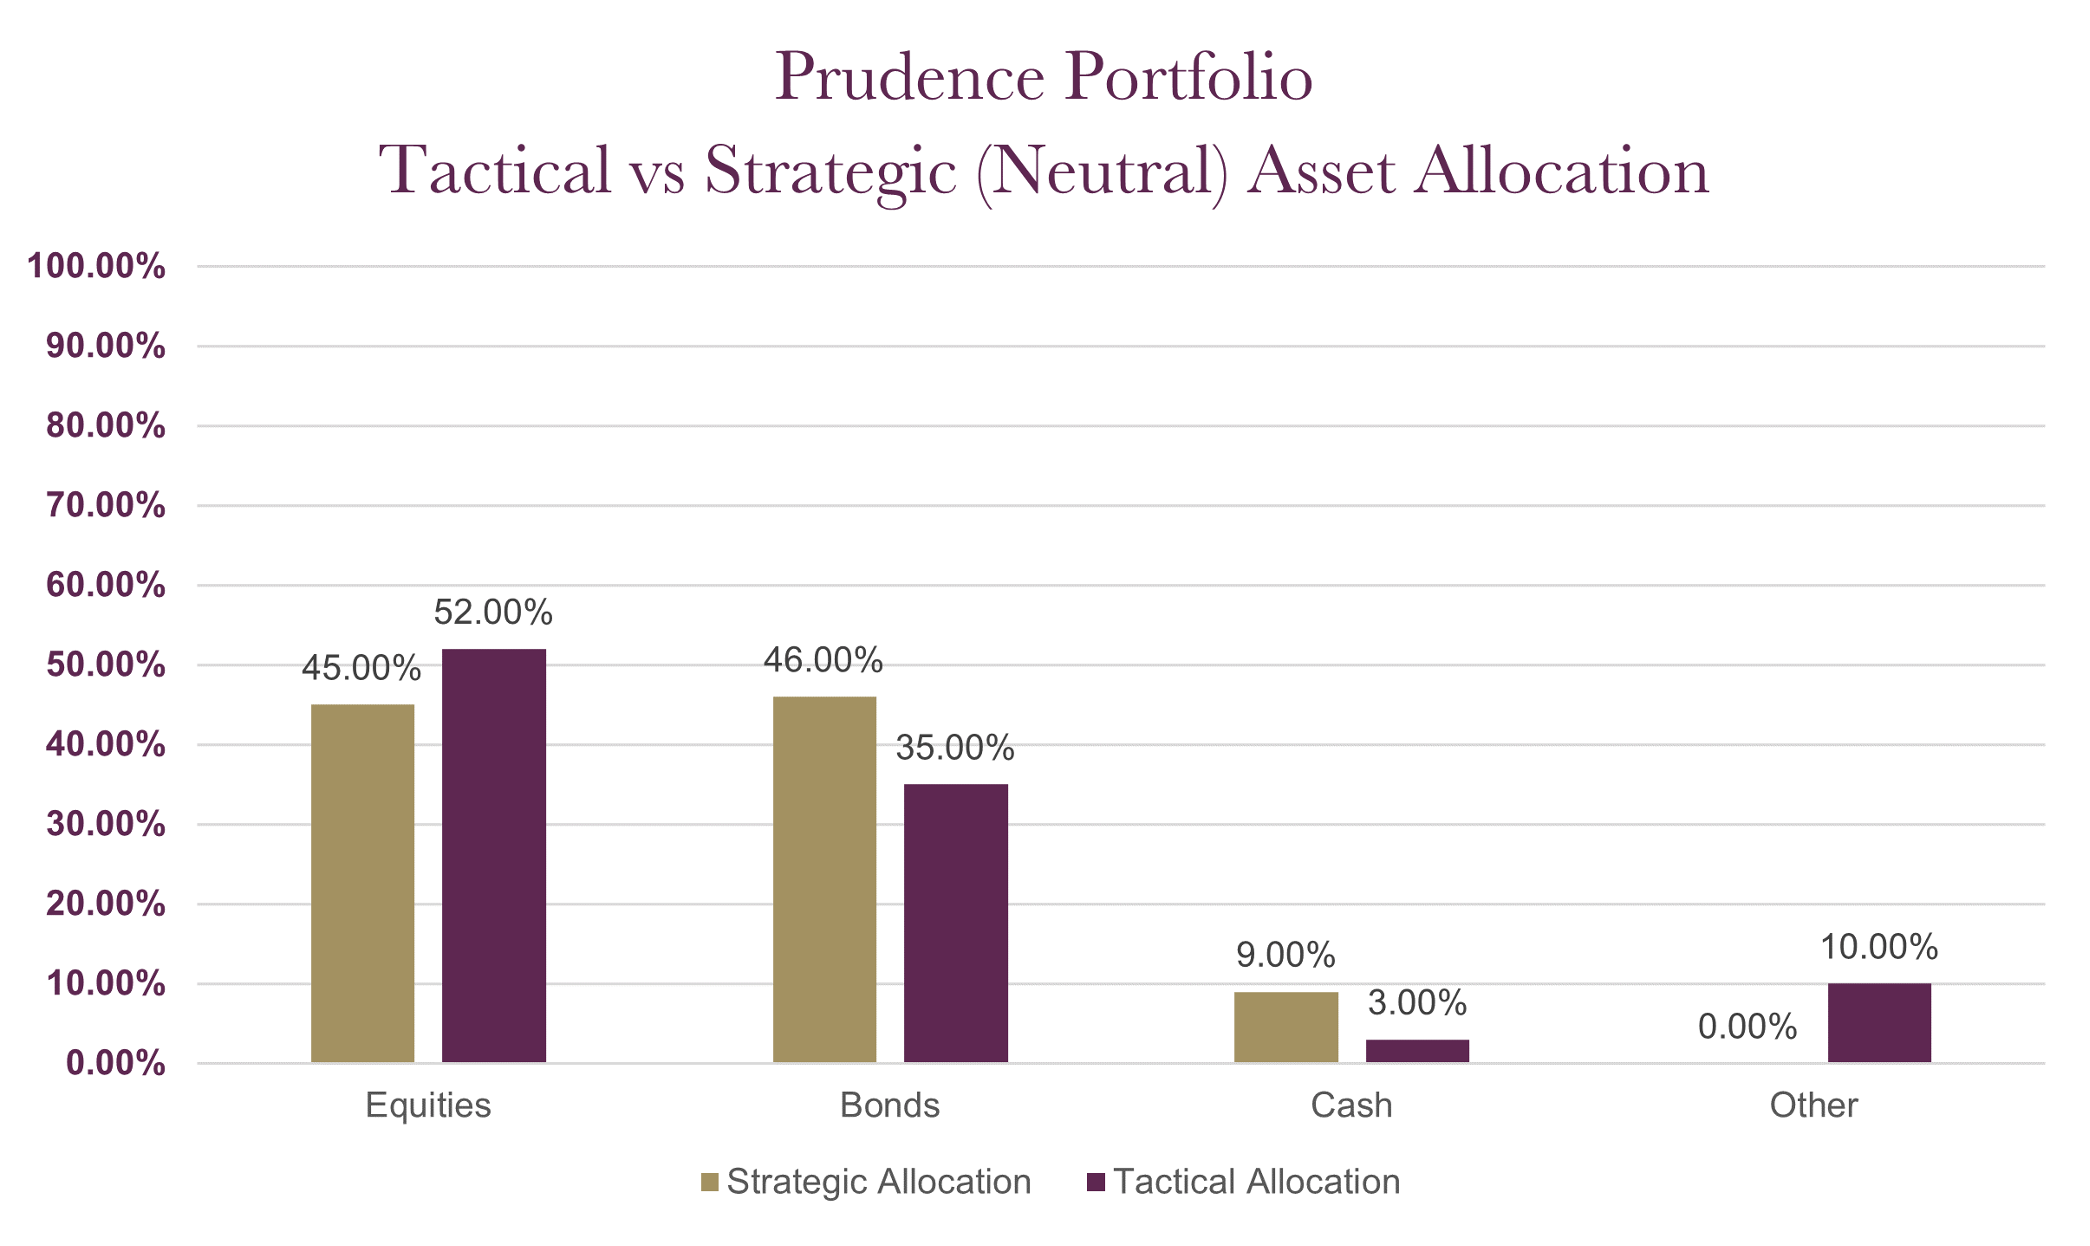
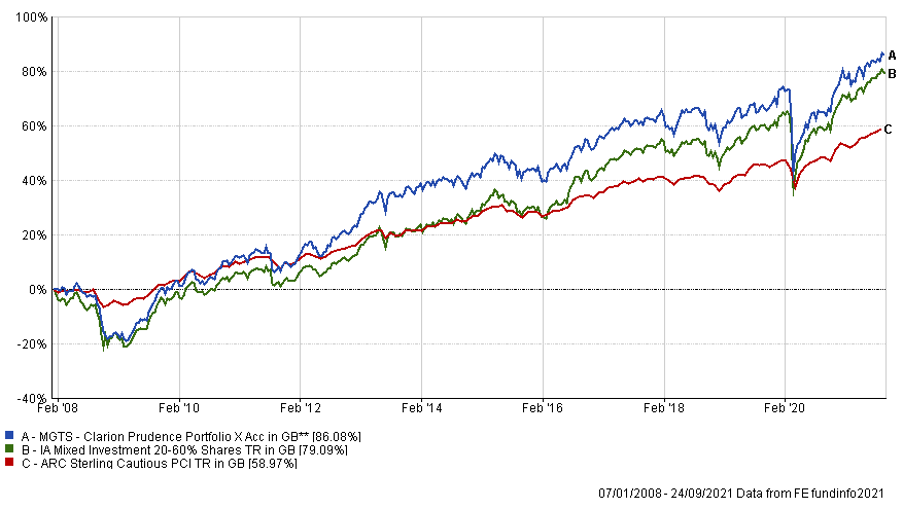
The table below shows the annualised performance to the last quarter end:
| 30/06/20 to 30/06/21 | 30/06/19 to 30/06/20 | 30/06/18 to 30/06/19 | 30/06/17 to 30/06/18 | 30/06/16 to 30/06/17 | |
| MGTS Clarion Prudence X Acc | 12.32% | -1.60% | 0.69% | 2.35% | 11.44% |
| CIM DT04 Prudence Portfolio | 12.26% | -1.71% | 0.88% | 3.02% | |
| ARC Sterling Cautious PCI | 7.13% | 1.66% | 2.37% | 1.41% | 6.53% |
| IA Mixed Investment 20-60% Shares | 12.10% | -1.30% | 0.69% | 1.83% | 11.19% |
Changes to the Prudence fund & model
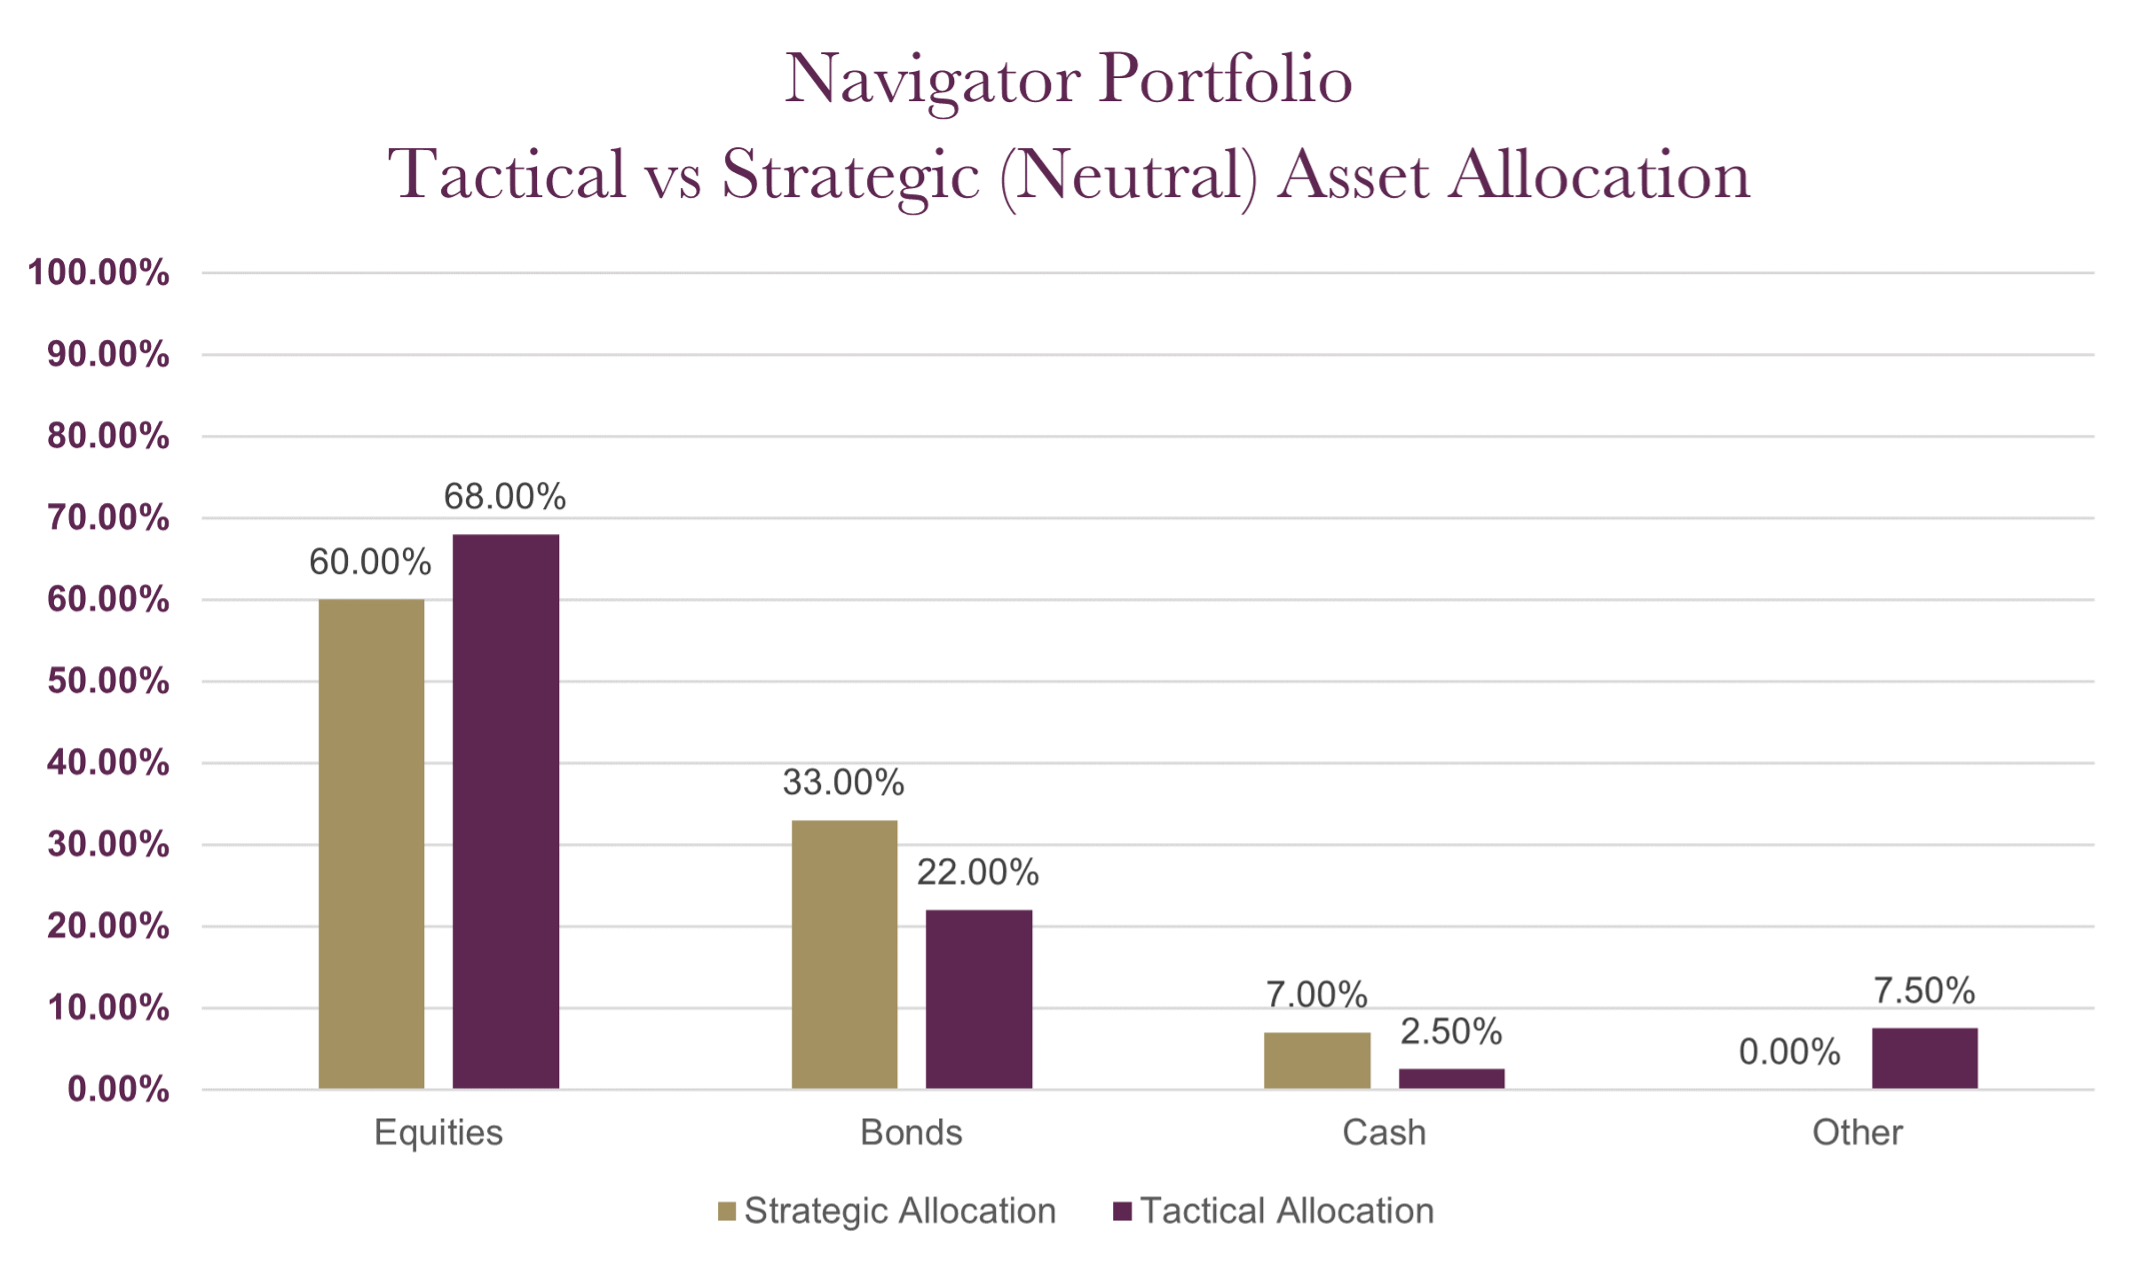
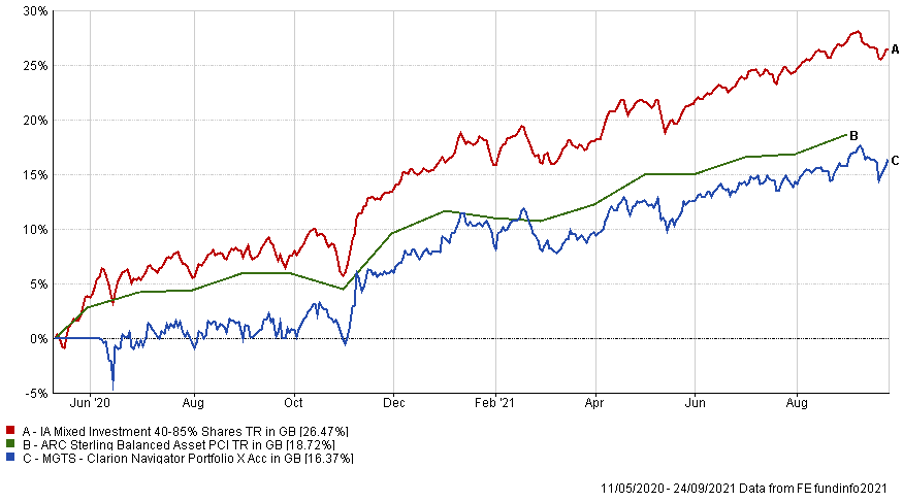
The charts below show the tactical asset allocation of the Navigator Portfolio against the neutral/strategic asset allocation as well as the historical performance of the portfolio against a relevant benchmark(s) since the start of the available data.
The table below shows the annualised performance to the last quarter end:
| 30/06/20 to 30/06/21 | |
| MGTS Clarion Navigator X Acc | 15.12% |
| CIM DT05 Navigator Portfolio | 16.14% |
| IA Mixed Investment 40-85% Shares | 17.29% |
Changes to the Navigator fund & model
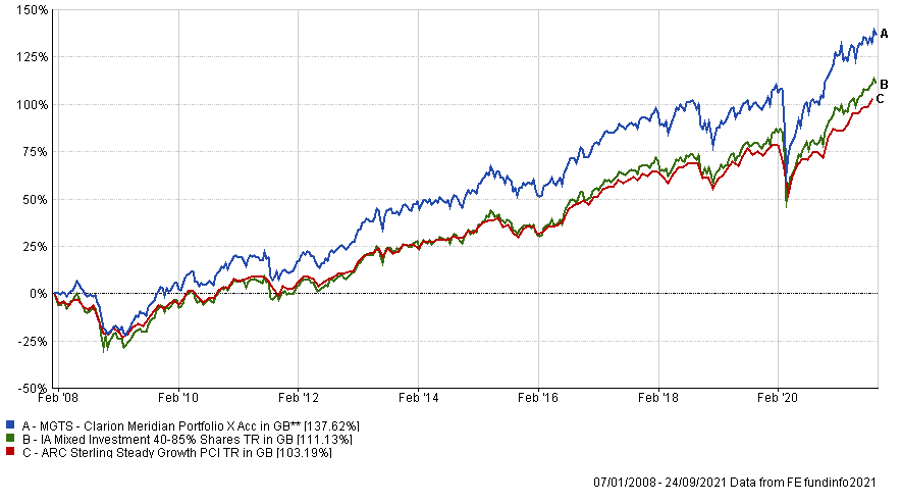
The charts below show the tactical asset allocation of the Meridian Portfolio against the neutral/strategic asset allocation as well as the historical performance of the portfolio against a relevant benchmark(s) since the start of the available data.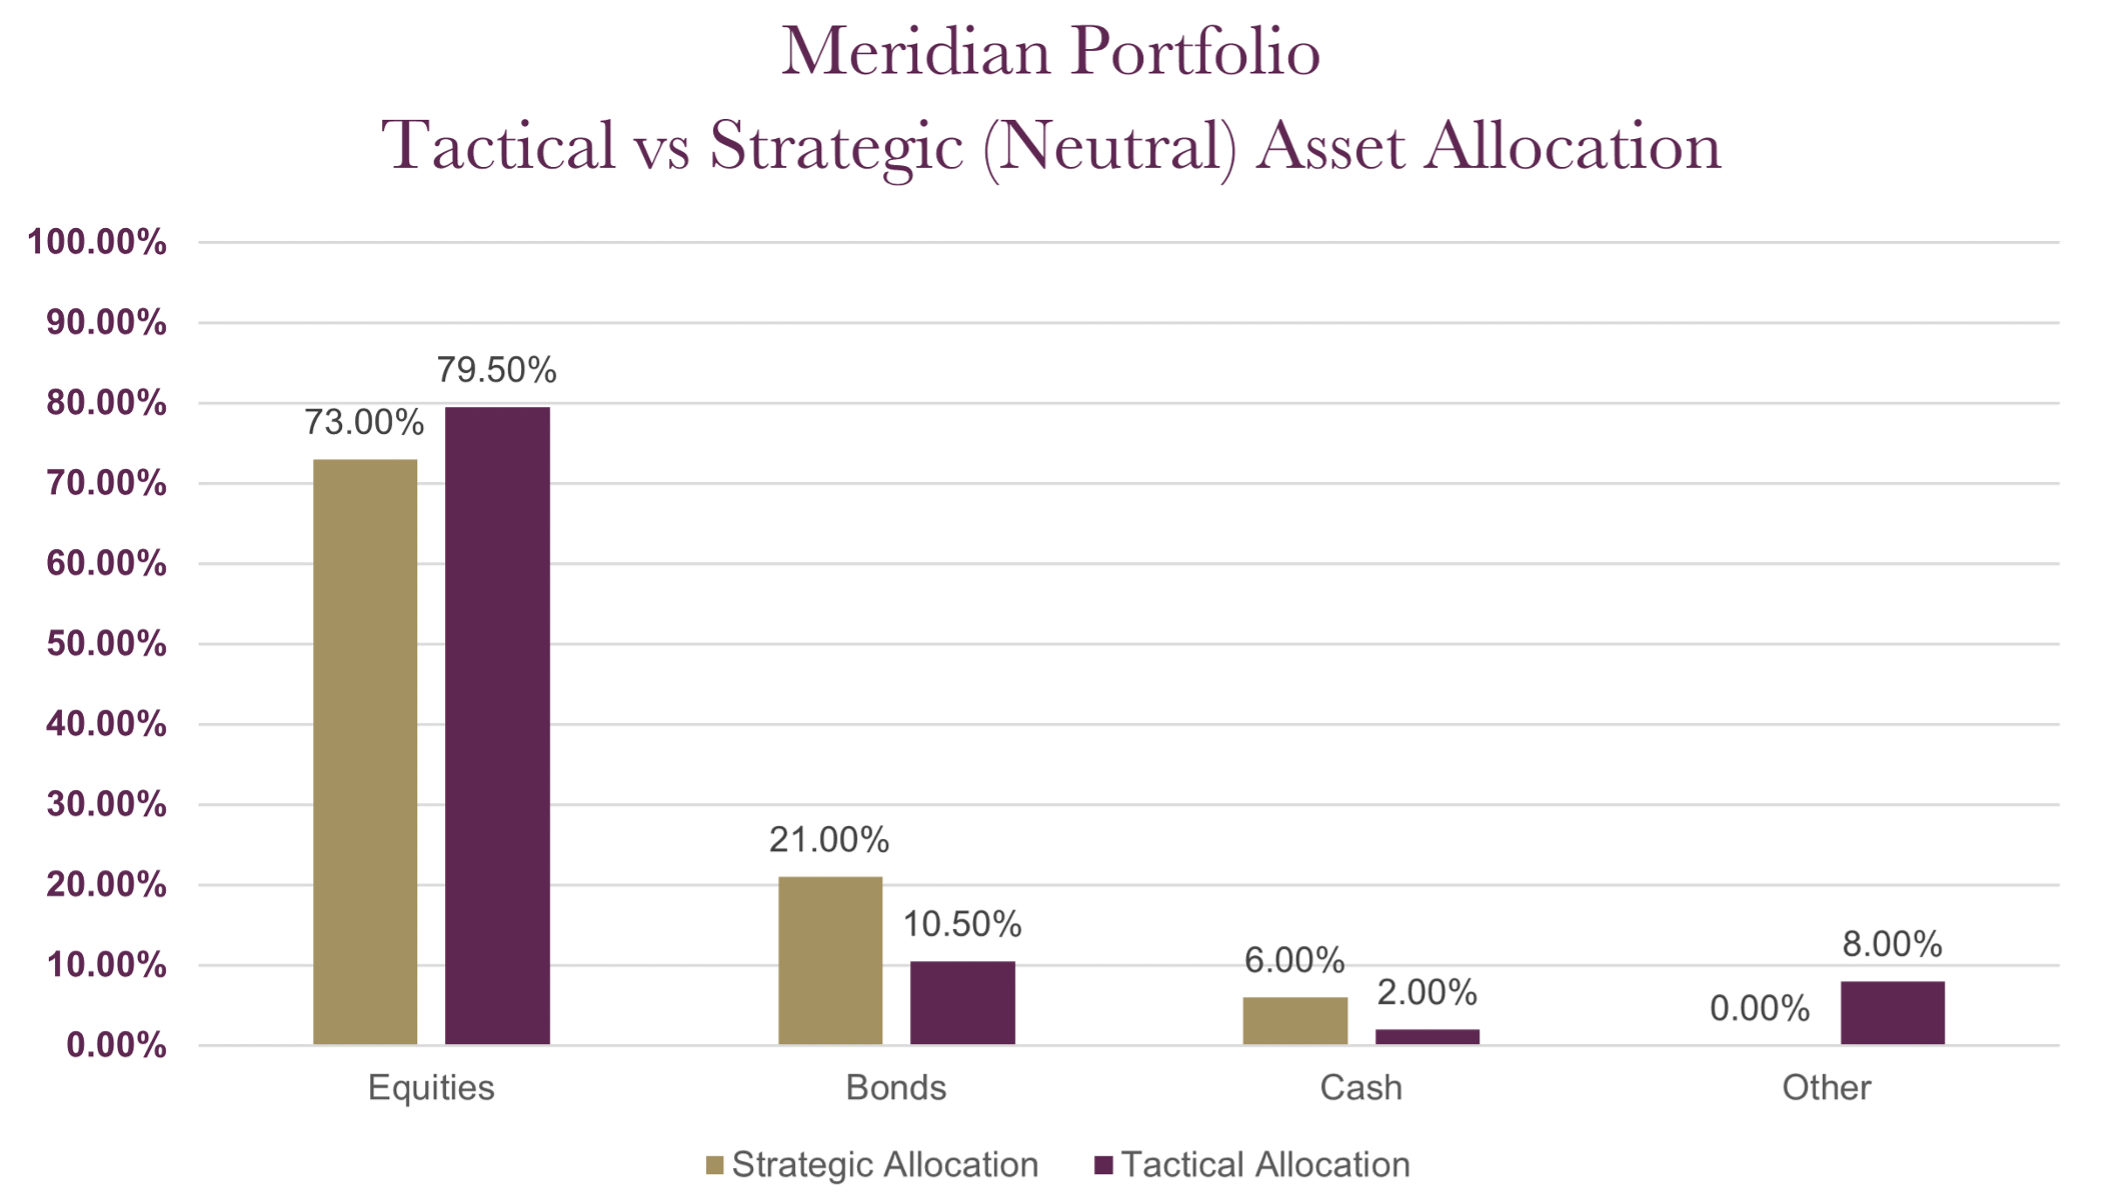
The table below shows the annualised performance to the last quarter end:
| 30/06/20 to 30/06/21 | 30/06/19 to 30/06/20 | 30/06/18 to 30/06/19 | 30/06/17 to 30/06/18 | 30/06/16 to 30/06/17 | |
| MGTS Clarion Meridian X Acc | 19.62% | -0.98% | 0.73% | 5.00% | 17.71% |
| CIM DT06 Meridian Portfolio | 19.73% | -0.62% | 3.08% | 5.17% | |
| ARC Steady Growth PCI | 15.37% | -0.51% | 3.54% | 4.92% | |
| IA Mixed Investment 40-85% Shares | 16.99% | -0.48% | 3.19% | 4.48% | 15.76% |
Changes to the Meridian fund & model
The charts below show the tactical asset allocation of the Explorer Portfolio against the neutral/strategic asset allocation as well as the historical performance of the portfolio against a relevant benchmark(s) since the start of the available data.
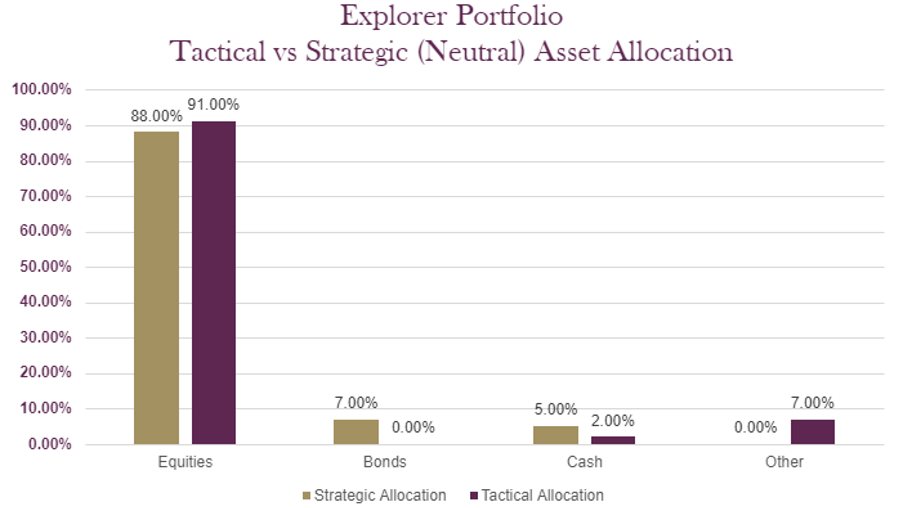
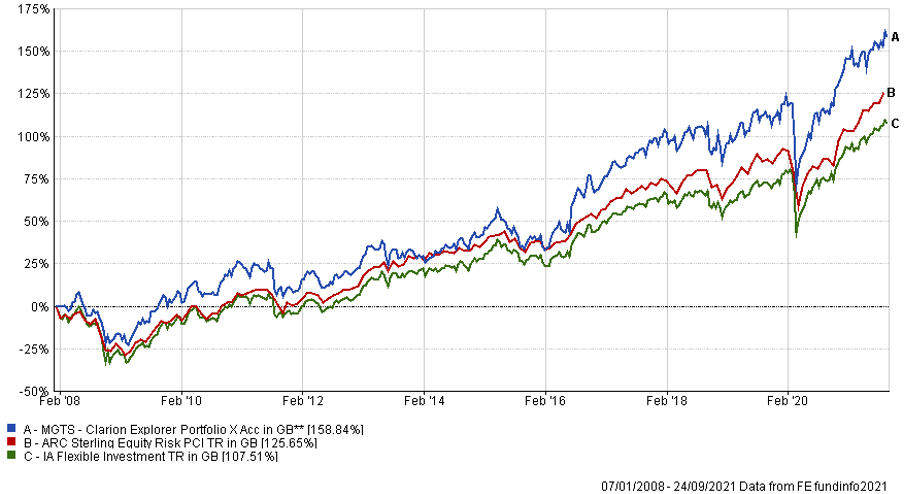
The table below shows the annualised performance to the last quarter end:
| 30/06/20 to 30/06/21 | 30/06/19 to 30/06/20 | 30/06/18 to 30/06/19 | 30/06/17 to 30/06/18 | 30/06/16 to 30/06/17 | |
| MGTS Clarion Explorer R Acc | 22.72% | -1.22% | 5.33% | 6.96% | 21.79% |
| CIM DT07 Explorer Portfolio | 22.39% | -1.22% | 5.61% | 8.57% | |
| ARC Equity Risk PCI | 20.24% | -1.13% | 4.02% | 6.36% | 17.05% |
| IA Flexible Investment | 19.24% | -0.04% | 2.70% | 4.85% | 17.69% |
Changes to the Explorer fund & model
The charts below show the tactical asset allocation of the Voyager Portfolio against the neutral/strategic asset allocation as well as the historical performance of the portfolio against a relevant benchmark(s) since the start of the available data.
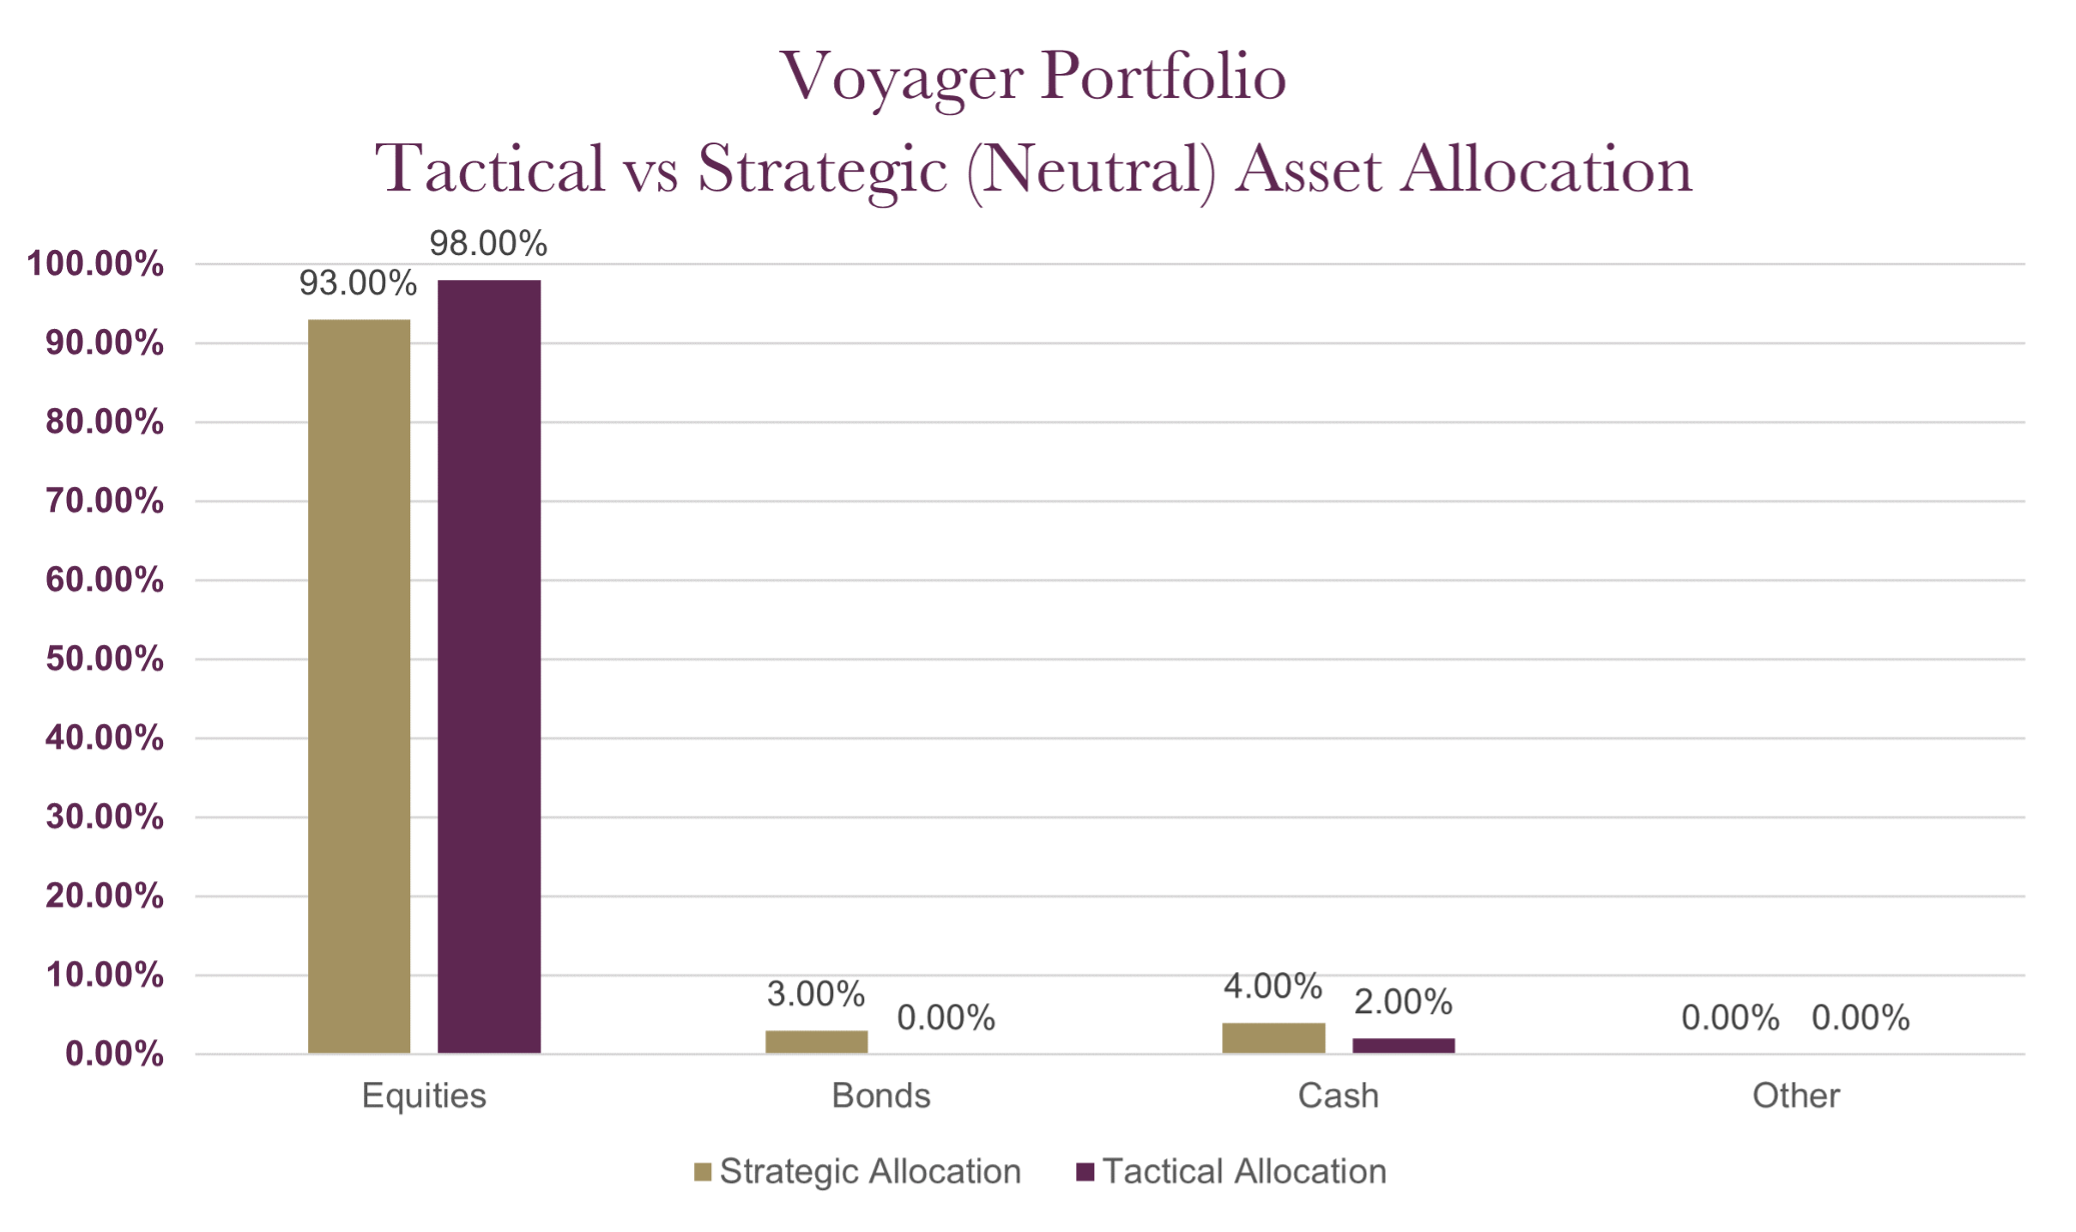
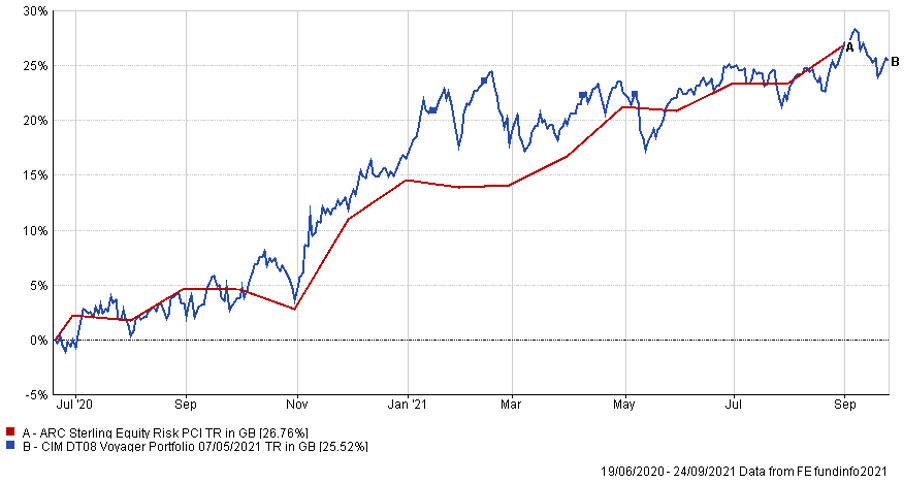
The table below shows the annualised performance to the last quarter end:
| 30/06/20 to 30/06/21 | 30/06/19 to 30/06/20 | 30/06/18 to 30/06/19 | 30/06/17 to 30/06/18 | 30/06/16 to 30/06/17 | |
| CIM DT08 Voyager Portfolio | 24.74% | ||||
| ARC Equity Risk PCI | 20.24% | -1.13% | 4.02% | 6.36% | 17.05% |
Changes to the Voyager fund & model
The charts below show the tactical asset allocation of the Adventurer Portfolio against the neutral/strategic asset allocation as well as the historical performance of the portfolio against a relevant benchmark(s) since the start of the available data.
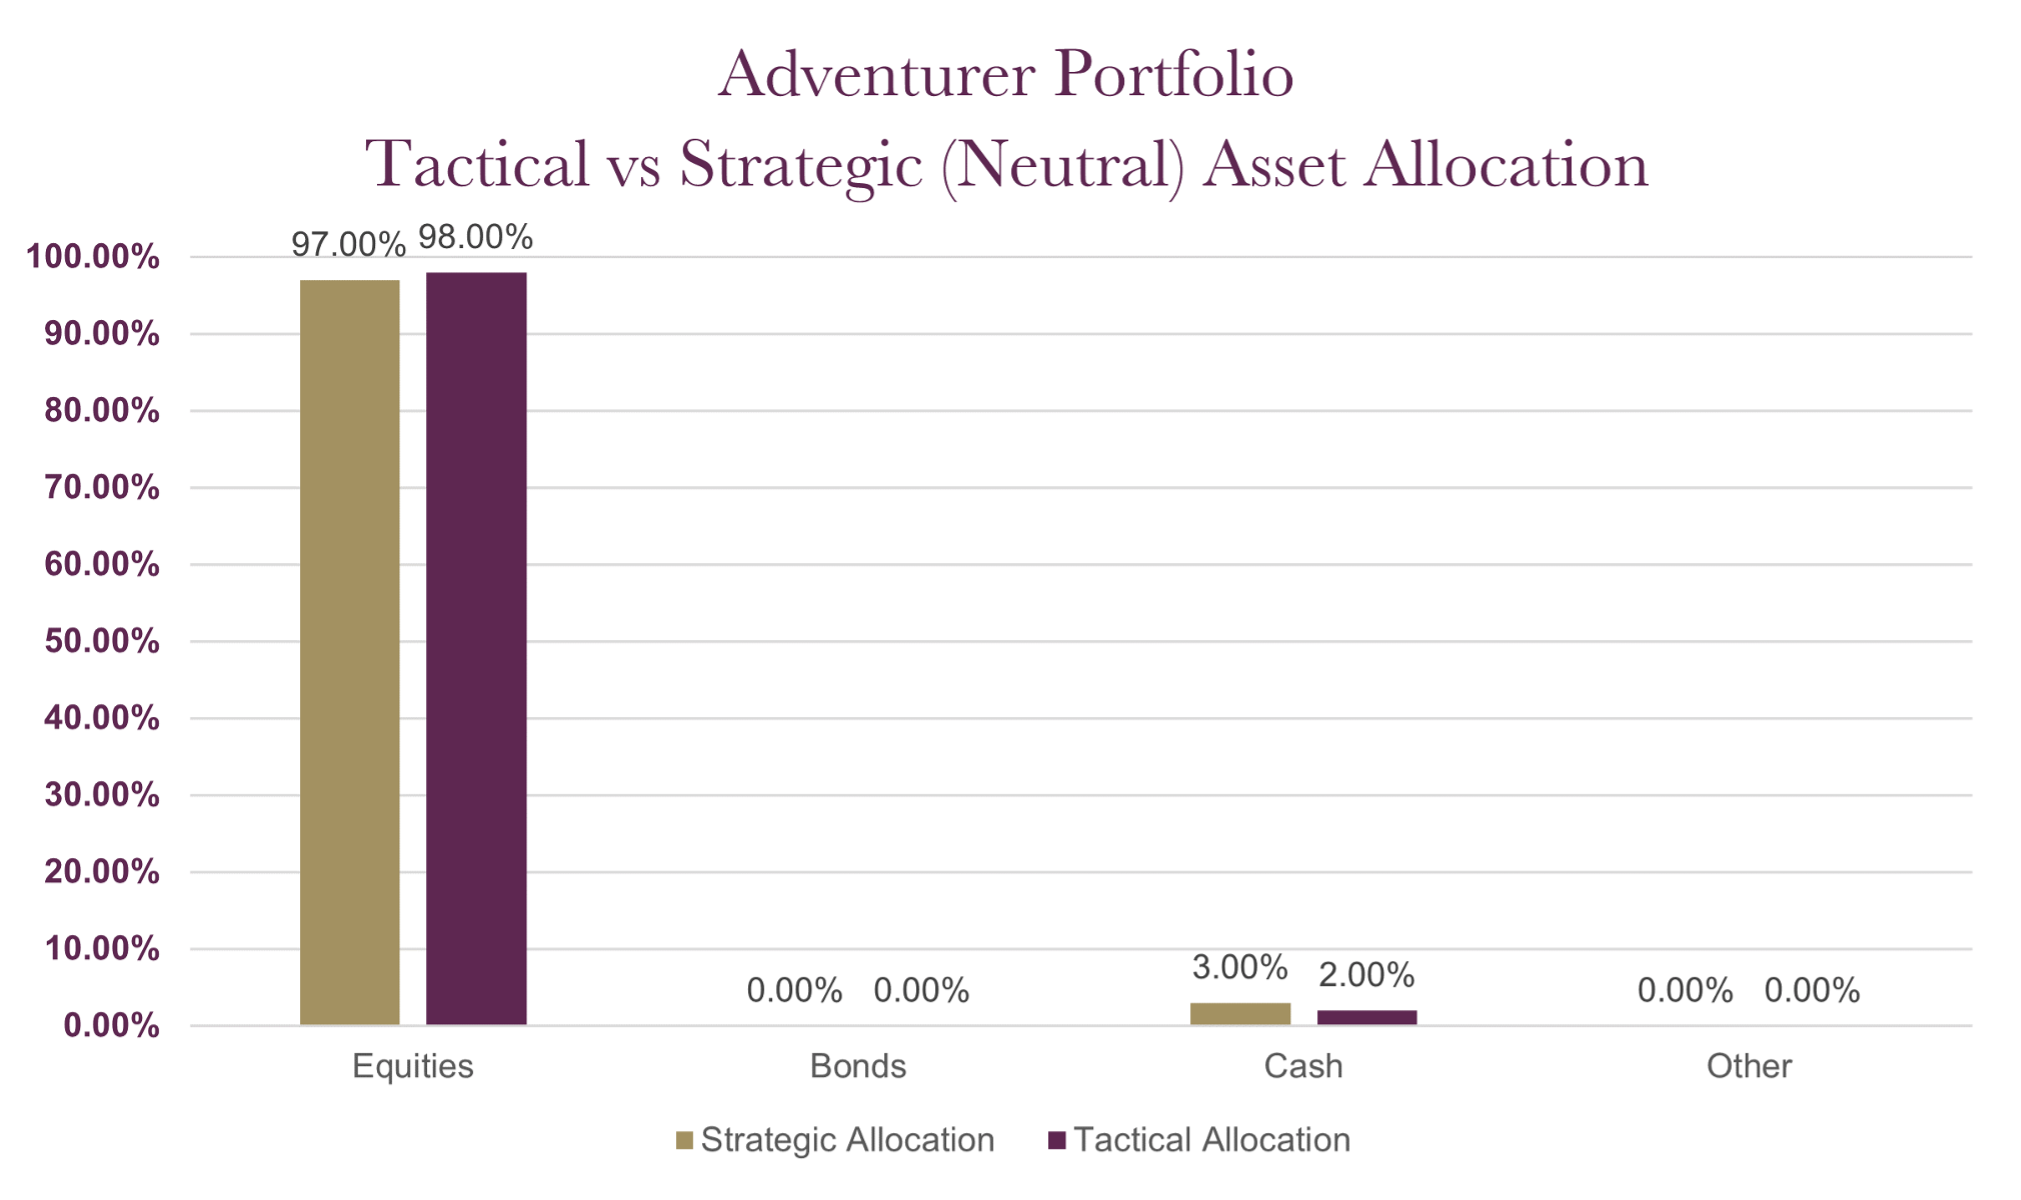
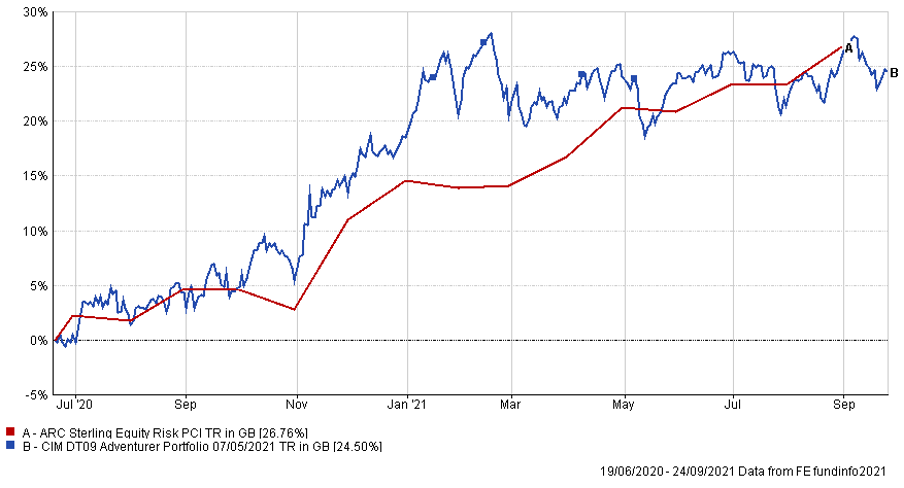
The table below shows the annualised performance to the last quarter end:
| 30/06/20 to 30/06/21 | 30/06/19 to 30/06/20 | 30/06/18 to 30/06/19 | 30/06/17 to 30/06/18 | 30/06/16 to 30/06/17 | |
| CIM DT09 Adventurer Portfolio | 25.49% | ||||
| ARC Equity Risk PCI | 20.24% | -1.13% | 4.02% | 6.36% | 17.05% |
Changes to the Adventurer model
The charts below show the tactical asset allocation of the Pioneer Portfolio against the neutral/strategic asset allocation as well as the historical performance of the portfolio against a relevant benchmark(s) since the start of the available data.
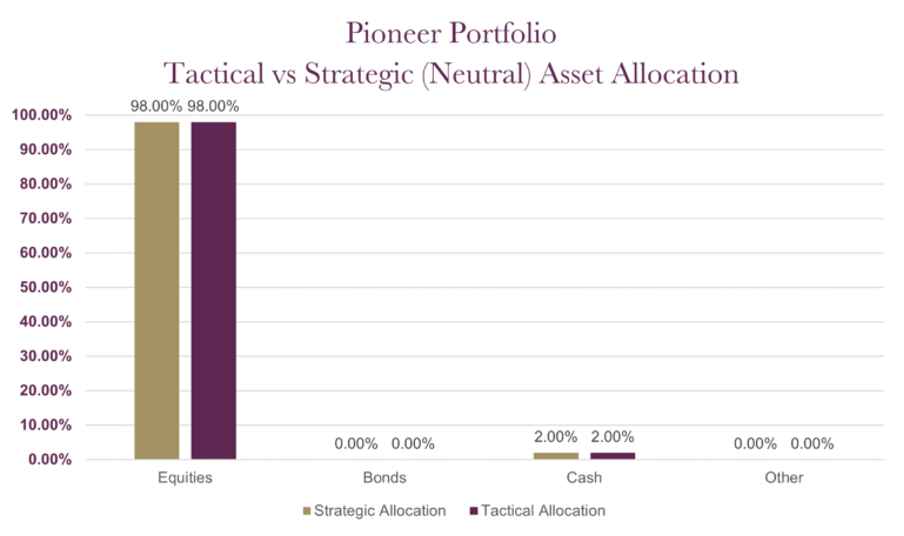
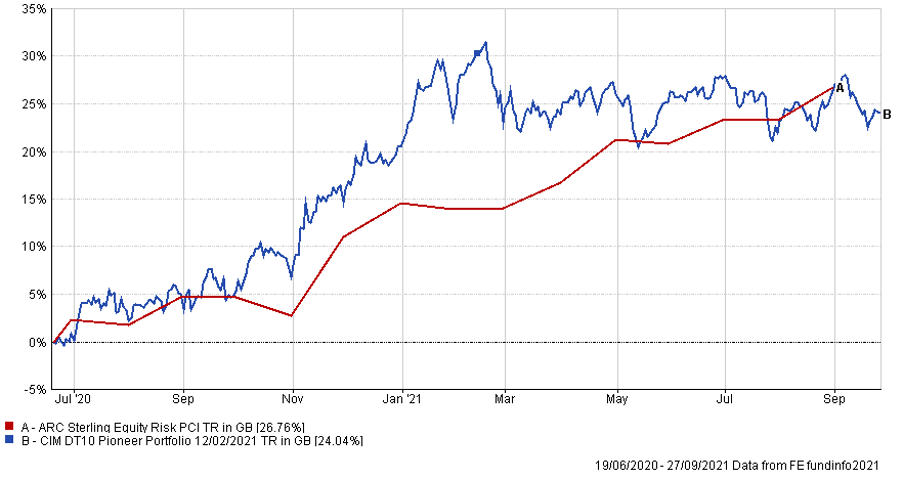
The table below shows the annualised performance to the last quarter end:
| 30/06/20 to 30/06/21 | 30/06/19 to 30/06/20 | 30/06/18 to 30/06/19 | 30/06/17 to 30/06/18 | 30/06/16 to 30/06/17 | |
| CIM DT10 Pioneer Portfolio | 26.74% | ||||
| ARC Equity Risk PCI | 20.24% | -1.13% | 4.02% | 6.36% | 17.05% |
Changes to the Pioneer model
Any investment performance figures referred to relate to past performance which is not a reliable indicator of future results and should not be the sole factor of consideration when selecting a product or strategy. The value of investments, and the income arising from them, can go down as well as up and is not guaranteed, which means that you may not get back what you invested. Unless indicated otherwise, performance figures are stated in British Pounds. Where performance figures are stated in other currencies, changes in exchange rates may also cause an investment to fluctuate in value.
If you’d like more information about this article, or any other aspect of our true lifelong financial planning, we’d be happy to hear from you. Please call +44 (0)1625 466 360 or email [email protected].
Click here to sign-up to The Clarion for regular updates.