True lifelong financial planning for the serious business of life.
True lifelong financial planning
for the serious business of life.
True lifelong financial planning for the serious business of life.
True lifelong financial planning
for the serious business of life.
Tags: Adventurer Portfolio, Defender Portfolio, Discretionary Investment Management, Explorer Portfolio, funds, investment, Meridian Portfolio, MGTS Clarion Explorer, MGTS Clarion Meridian, MGTS Clarion Prudence, MTGS Clarion Navigator, Navigator Portfolio, Pioneer Portfolio, Prudence Portfolio, Voyager Portfolio
Category:
Investment management
The Clarion Investment Committee met on Wednesday 14th September. The following notes summarise the main points of consideration in the Investment Committee discussions.
The UK’s energy support package announced earlier this month is a huge response to the cost-of-living crisis, costing roughly twice as much as the COVID furlough scheme. Supporters see it as bold and necessary. Critics condemn it as untargeted and risky for Britain’s finances. What they agree on is that, in terms of cost and reach, this is a shock and awe policy move.
For a fuller version of Clarion’s Economic and Stock Market Commentary, written by Clarion Group Chairman Keith Thompson, please click here
Bonds remain broadly unappealing as an asset allocation choice in a rising interest rate and high inflation environment, where capital losses at the long end of the yield curve appear likely. In the UK and US the risk/reward factoring of bonds point to the shorter end of the curve which is inverted at current yields. Quantitative tightening ought to have a more substantial effect on longer dated bonds as these comprise the majority of central bank balance sheets. The investment committee continue to allocate fixed interest exposure to short-duration and tactical bonds which ought to outperform on a relative basis in the current environment.
We hold a neutral position in North American markets with exposure at the lower end of the major indices and smaller companies, which offer more attractive valuations in comparison to some of the larger cap tech stocks.
From an investment perspective, the US has led global markets throughout the pandemic and is home to some of the largest and most profitable companies in the world. This year has seen a steady decline in valuations similar to the rest of the world. This was mainly centred around rising inflation and interest rates. We will continue to have some exposure to US big tech as we see such holdings acting more like consumer staples.
The more highly rated less profitable US tech companies are potentially more at risk from further falls due to Federal Reserve intervention.
UK equities trade at attractive relative valuations on a historical basis, and the tilt towards lower rated value stocks should aid outperformance in the current environment. Revenue is increasingly derived from overseas across both the FTSE100 and FTSE 250, meaning many companies are less reliant on the domestic economy and could benefit from the stronger dollar as income is converted back to sterling.
Asia Pacific equities have short-term headwinds as Covid continues to cause problems, particularly in China. The property development market in China is also an unsolved lingering issue. Over the longer term the ability to continue loosening monetary policy in the region and lower inflation pressure bodes well for potential equity outperformance.
We are positive for the prospects of emerging markets for demographic reason and also because they are home to the one of the most sought-after electronic components of the decade – the semiconductor chip. We liken the current unprecedented demand for semi-conductor chips to the demand for oil in the 1970’s. This demand will be ever increasing the closer we get to a fully digital and more autonomous world.
So many of the world’s products now require either a memory chip or a logic chip and there are only a handful of companies that currently produce these. Consequently, the US is racing to expand chip manufacturing in America to help their domestic companies continue to operate competitively. However, due to the scale of the task, it will be a long time until US companies no longer rely on emerging market producers to meet their demand for semi-conductor chips. Given the above, we continue to strongly believe that the demand for logic chips will only increase year on year, especially as we enter the age of Artificial Intelligence, where semi-conductor chips are relied upon even more heavily.
We believe the future trend will be competition amongst companies to secure a supply of these exceptionally sought-after chips in order to continue producing their products. Consequently, we believe the companies producing semiconductor chips will continue to perform exceedingly well.
We avoid investments with a single country remit investing into China, India, Russia and Brazil.
In view of the heightened level of global economic uncertainty, after careful deliberation there was unanimous agreement to only make very minor changes to the Clarion portfolios. The key themes reflected in the strategic benchmark review can be summarised below:
Continuing to hold diversified high-quality assets over the longer term remains the appropriate method for allocation of investor capital.
Keith W Thompson
Clarion Group Chairman
September 2022
Creating better lives now and in the future for our clients, their families and those who are important to them.
The chart below shows the historical performance of the Defender Portfolio against a relevant benchmark since the start of the available data.
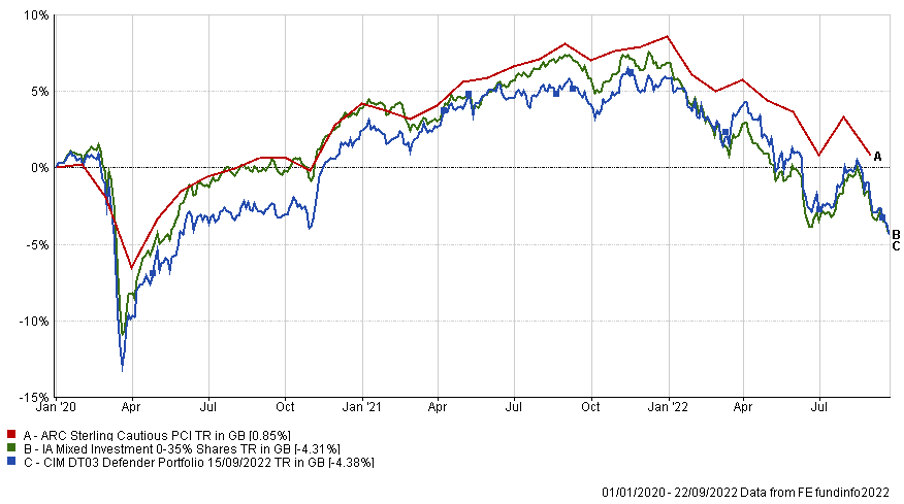
The table below shows the annualised performance to the last quarter end:
| 30/06/21 30/06/20
to to 30/06/22 30/06/21 |
|
| CIM DT03 Defender Portfolio | -6.88% 7.80% |
| ARC Sterling Cautious PCI | -5.21% 7.25% |
| IA Mixed Investment 0-35% Shares | -8.57% 6.86% |
The chart below shows the historical performance of the Prudence Portfolio against a relevant benchmark since the start of the available data.
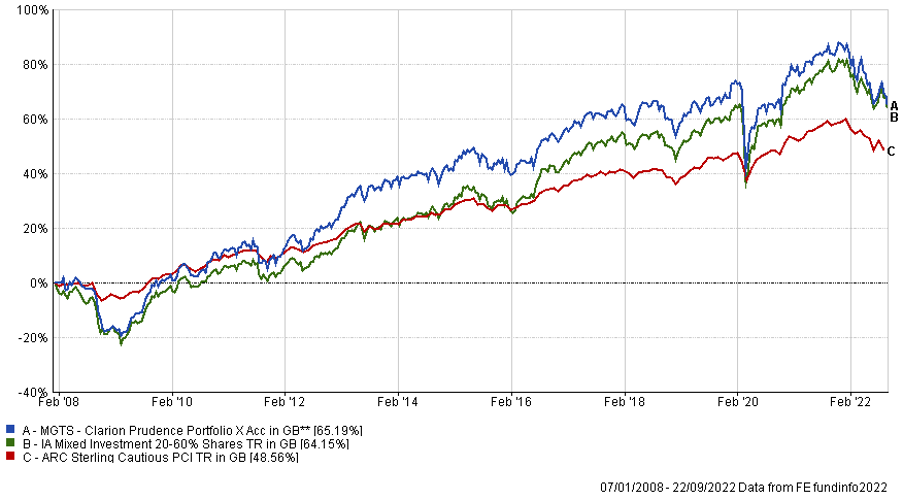
The table below shows the annualised performance to the last quarter end:
| 30/06/21 to 30/06/22 | 30/06/20 to 30/06/21 | 30/06/19 to 30/06/20 | 30/06/18 to 30/06/19 | 30/06/17 to 30/06/18 | |
| MGTS Clarion Prudence X Acc | -8.97% | 12.32% | -1.60% | 0.69% | 2.35% |
| CIM DT04 Prudence Portfolio | -9.06% | 12.26% | -1.27% | 1.43% | 3.56% |
| ARC Sterling Cautious PCI | -5.21% | 7.25% | 1.66% | 2.37% | 1.41% |
| IA Mixed Investment 20-60% Shares | -7.09% | 12.74% | -0.63% | 2.89% | 2.44% |
The chart below shows the historical performance of the Navigator Portfolio against a relevant benchmark since the start of the available data.
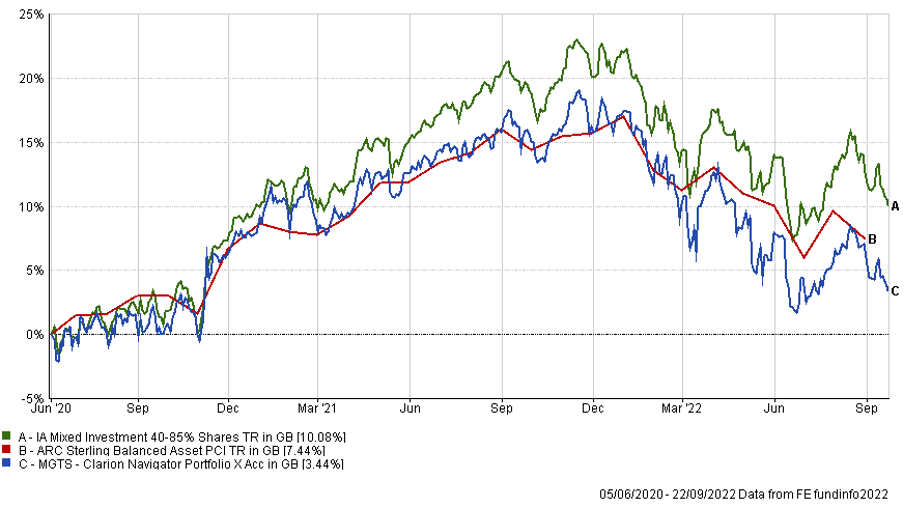
The table below shows the annualised performance to the last quarter end:
| 30/06/21
to 30/06/22 |
30/06/20
to 30/06/21 |
|
| MGTS Clarion Navigator X Acc | -9.53% | 15.12% |
| CIM DT05 Navigator Portfolio | -10.01% | 16.14% |
| IA Mixed Investment 40-85% Shares | -7.16% | 17.29% |
ARC Sterling Balanced Asset PCI -6.63% 11.84%
The chart below shows the historical performance of the Meridian Portfolio against a relevant benchmark since the start of the available data.
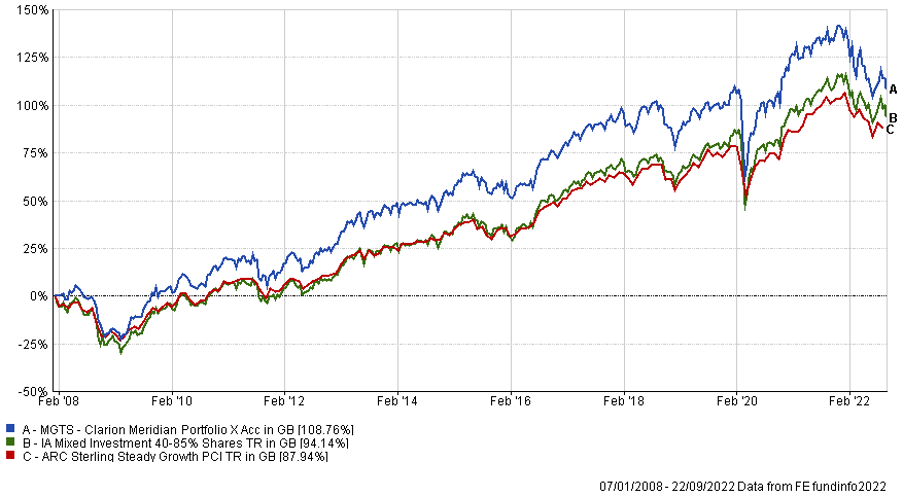
The table below shows the annualised performance to the last quarter end:
| 30/06/21 to 30/06/22 | 30/06/20 to 30/06/21 | 30/06/19 to 30/06/20 | 30/06/18 to 30/06/19 | 30/06/17 to 30/06/18 | |
| MGTS Clarion Meridian X Acc | -11.58% | 19.62% | -0.98% | 0.73% | 5.00% |
| CIM DT06 Meridian Portfolio | -12.00% | 19.73% | -0.51% | 3.26% | 5.36% |
| ARC Steady Growth PCI | -7.67%% | 15.87% | -0.51% | 3.54% | 4.92% |
| IA Mixed Investment 40-85% Shares | -7.16% | 17.29% | -0.11% | 3.62% | 4.85% |
The chart below shows the historical performance of the Explorer Portfolio against a relevant benchmark since the start of the available data.
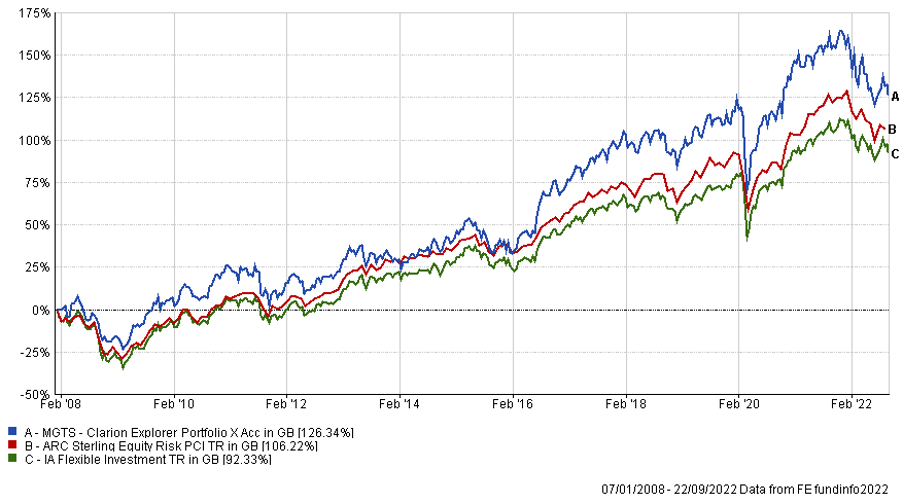
The table below shows the annualised performance to the last quarter end:
| 30/06/21 to 30/06/22 | 30/06/20 to 30/06/21 | 30/06/19 to 30/06/20 | 30/06/18 to 30/06/19 | 30/06/17 to 30/06/18 | |
| MGTS Clarion Explorer X Acc | -11.98% | 22.72% | -1.22% | 5.33% | 6.96% |
| CIM DT07 Explorer Portfolio | -12.73% | 22.46% | -1.09% | 5.69% | 8.60 |
| ARC Equity Risk PCI | -8.92% | 20.57% | -1.13% | 4.02% | 6.36% |
| IA Flexible Investment | -7.09% | 19.48% | 0.31% | 2.95% | 5.04% |
The chart below shows the historical performance of the Voyager Portfolio against a relevant benchmark since the start of the available data.
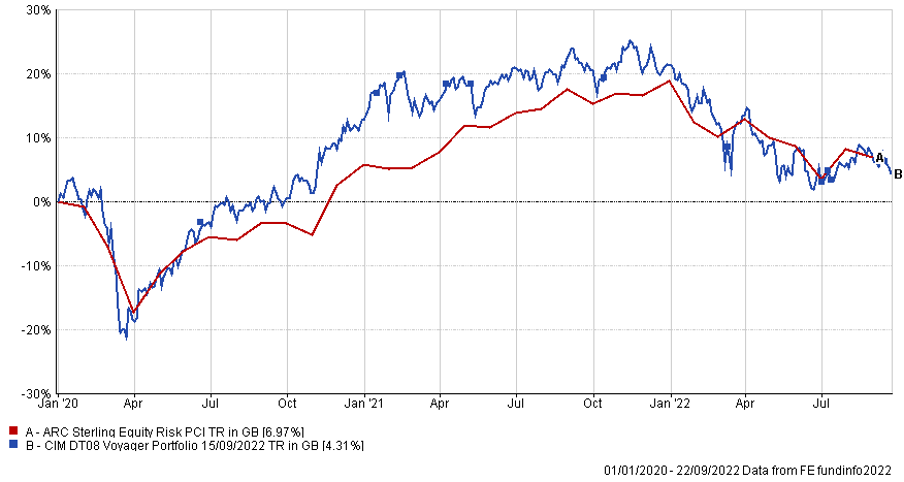
The table below shows the annualised performance to the last quarter end:
| 30/06/21
to 30/06/22 |
30/06/20
to 30/06/21 |
|||||
| CIM DT08 Voyager Portfolio | -14.46% | 24.81% | ||||
| ARC Equity Risk PCI | -8.92% | 20.57% |
The chart below shows the historical performance of the Adventurer Portfolio against a relevant benchmark since the start of the available data.
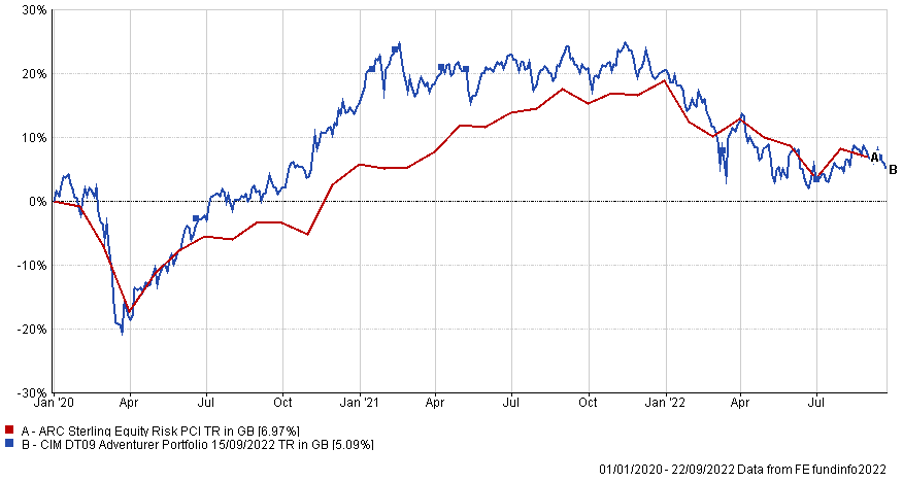
The table below shows the annualised performance to the last quarter end:
| 30/06/21
to 30/06/22 |
30/06/20
to 30/06/21 |
||||
| CIM DT09 Adventurer Portfolio | -15.60% | 25.54% | |||
| ARC Equity Risk PCI | -8.92% | 20.57% |
The chart below shows the historical performance of the Pioneer Portfolio against a relevant benchmark since the start of the available data.
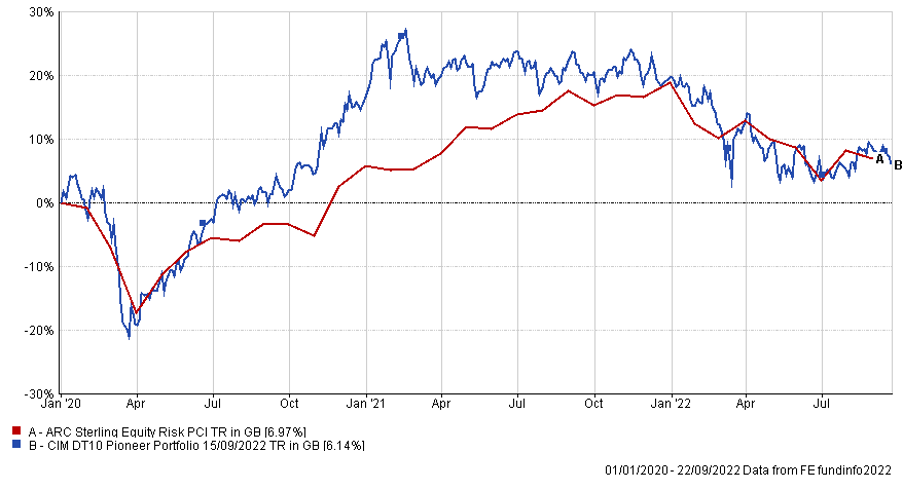
The table below shows the annualised performance to the last quarter end:
| 30/06/21
to 30/06/22 |
30/06/20
to 30/06/21 |
||||
| CIM DT10 Pioneer Portfolio | -15.18% | 26.74% | |||
| ARC Equity Risk PCI | -8.92% | 20.57% |
Any investment performance figures referred to relate to past performance which is not a reliable indicator of future results and should not be the sole factor of consideration when selecting a product or strategy. The value of investments, and the income arising from them, can go down as well as up and is not guaranteed, which means that you may not get back what you invested. Unless indicated otherwise, performance figures are stated in British Pounds. Where performance figures are stated in other currencies, changes in exchange rates may also cause an investment to fluctuate in value.
The content of this article does not constitute financial advice and you may wish to seek professional advice based on your individual circumstances before making any financial decisions.
If you’d like more information about this article, or any other aspect of our true lifelong financial planning, we’d be happy to hear from you. Please call +44 (0)1625 466 360 or email enquiries@clarionwealth.co.uk.
Click here to sign-up to The Clarion for regular updates.