Tags: Adventurer Portfolio, Defender Portfolio, Discretionary Investment Management, Explorer Portfolio, funds, investment, Meridian Portfolio, MGTS Clarion Explorer, MGTS Clarion Meridian, MGTS Clarion Prudence, MTGS Clarion Navigator, Navigator Portfolio, Pioneer Portfolio, Prudence Portfolio, Voyager Portfolio
Category:
Investment management
The Clarion Investment Committee met on the 2nd of February 2023. The following notes summarise the main points of consideration in the investment Committee discussions.
(These notes are as at the actual date of the Investment Committee since which time major central banks have continued with the theme of tightening monetary policy with further interest rate rises although now at a slightly slower pace and inflationary pressures have continued to ease slightly. These developments were widely anticipated by the Clarion Investment Committee and factored into the investment strategy decisions outlined below).
The IMF’s latest World Economic Outlook Growth Projections reported the UK as the only developed economy likely to contract over 2023. The UK’s real GDP is expected to shrink by 0.6% according to the report, with strongest growth among developed economies in Japan (1.8%) and Canada (1.5%).
In developing countries, India is expected to grow the most (6.1%) and China second (5.3%). The IMF cited that the UK’s recovery from Covid was too strong and as a result inflation in the UK became rampant with pent-up demand and excess savings far exceeding supply in many goods. This is reflected with the UK’s GDP growth of 4.1% in 2022 only being topped by Spain in advanced economies.
The UK has been struggling with productivity growth rates dropping more than in other countries after the global financial crisis and business investment has not grown since the Brexit referendum. Nonetheless, the UK still has great potential. The level of education in the economy is one of the highest in Europe, inflation is on a downward trend and the UK market still trades on attractive valuations compared to other developed economies despite the gains of last year.
‘Walkout Wednesday’ on 1st February saw the most UK public sector workers striking on a single day in over a decade. Over 500,000 people joined union action in walkouts of teachers, rail workers, civil servants, and university staff. Unions are still looking for a c.10% salary increase in line with inflation, while the Government is trying to negotiate increases down to around the 4% mark. Public support has been a driver for both parties and varies between sectoral strikes, which is probably delaying the outcome. The government feel they need to stand firm to protect the taxpayer from further expenditure in the public sector and to combat inflation which has led to the cost-of-living crisis.
The very same cost of living crisis is what is motivating the unions as they feel the public do not want public sector workers to feel the worst of the crisis. The negotiation table remains stuck between a rock and a hard place with little sign of progress yet.
Germany’s Chancellor Olaf Scholz has now acquiesced to Ukraine’s demands for armoured vehicles and offered 14 Leopard 2A6 tanks to aid Ukraine in the war with Russia despite fear of the conflict becoming a wider NATO-Russia war. Following Germany’s approval, more tanks could come from countries like Finland, the Netherlands, Poland, and Norway. The progress in supplies developed quickly into calls from Ukraine’s government for Jets and more heavy armour, with the Dutch government confirming that it would consider supplying some of its planes. The likelihood of this leading to a significant escalation is slim considering the amount of weaponry already supplied to Ukraine, but it does little to help in negotiating a peace treaty as the war looks to prolong into 2023.
A two-year report by Hindenburg Research into the world’s formerly third-richest person Gautam Adani concluded that he could be undertaking “the largest con in corporate history”. The report states that various stock and accounting manipulation techniques have led to fraud and money laundering in the Adani Group conglomerate. Markets reacted by wiping more that £7bn of Adani’s fortune in one day. Shares in Adani Gas, which is supposed to have been loaded with hidden debt, fell below the Indian exchange’s maximum loss limit of 10% before trading ceased. The activist fund is named after the Hindenburg disaster and state their mission as exposing avoidable financial disasters. Adani Group deny the allegations noting the timing of the report before an Adani Group IPO and the short position taken by the fund (openly used by the fund to finance their mission) as more than coincidental.
For a fuller version of Clarion’s Economic and Stock Market Commentary, written by Clarion Group Chairman Keith Thompson, please click here.
In the Investment Committee’s (IC) view, longer-dated bonds are likely to be overvalued, despite a rise in their yields following falls in bond markets in 2022. With inflation expectations softening, the short end of the yield curve in the US is expected to subside, while the longer end could remain elevated. However, it might not rise aggressively from current levels.
In the UK, the longer end of the yield curve continues to be under strain from inflationary pressure, given the tightness of the UK labour market. The IC feel that spreads on corporate bonds are not attractive at the moment and could widen in the near term if economic conditions worsen. Accordingly, the IC have chosen to allocate primarily to investment grade corporate bonds with a slight tilt to shorter duration, although the portfolio duration has been tactically increased during significant sell-offs in bonds in the second half of 2022.
A recent increase in the flow of investor assets into the growth-oriented areas of the equity market, such as technology stocks, has been noted. However, the IC do not wish to participate in this short-term reversal at this stage and believe the recent development will be short-lived and more speculative assets trading on high multiples will remain volatile.
The Clarion portfolios are tilted to benefit from revaluations in Asia, Emerging Markets, and the UK, which we currently favour. With China re-opening its economy, demand in the Asia Pacific and Emerging Markets regions is expected to pick up. In the higher risk portfolios, we have opened a small direct exposure to China aimed to capture the ‘China recovery’ theme. We also expect a rise in demand for commodities, which should result in outperformance of large cap UK stocks.
It is the IC view that small and mid-cap companies present a lucrative opportunity and should be the main beneficiaries when markets begin to anticipate the end of a recession. We continue to hold a dedicated mid-cap exposure for this reason, and we are discussing adding a small-cap fund to our higher-risk portfolios.
The key themes are as follows:
We have entered a period of “Great Normalisation”, during which market participants are likely to experience further volatility before markets stabilise and prepare for the next stage of growth.
In the committee’s view, central banks are likely to shift from the previous inflation target of 2% to a higher figure or a floating range, which will most likely be around 3-4%. The amount of economic destruction required to bring inflation back to a 2% target would be too great to be justifiable. Coupled with multiple developed economies (US and Europe) trying to ease the reliance on supply chains from China, inflation is likely to be stickier, although much lower than current levels, than initially thought.
Continuing to hold a globally diversified portfolio of high-quality assets is important to protect and grow the value of savings over the long term and remains the appropriate method for allocation of investor capital. Cash is unattractive as inflationary pressures look to be structurally long term.
Keith W Thompson
Clarion Group Chairman
February 2023
Creating better lives now and in the future for our clients, their families and those who are important to them.
The chart below shows the historical performance of the Defender Portfolio against a relevant benchmark since the start of the available data.
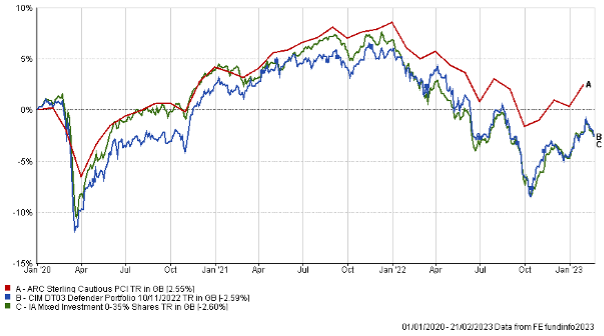
The table below shows the annualised performance to the last quarter end:
| 30/12/21 30/12/20
to to 30/12/22 30/12/21 |
|
| CIM DT03 Defender Portfolio | -9.82% 3.69% |
| ARC Sterling Cautious PCI | -7.39% 4.23% |
| IA Mixed Investment 0-35% Shares | -10.87% 2.84% |
The chart below shows the historical performance of the Prudence Portfolio against a relevant benchmark since the start of the available data.
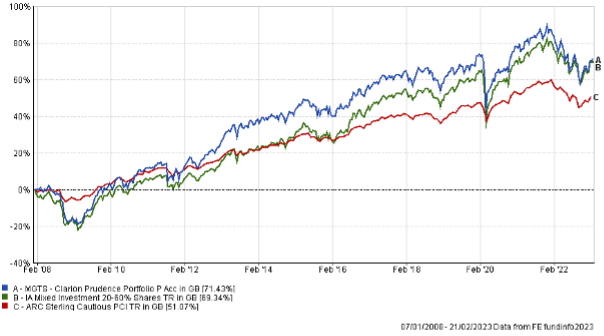
The table below shows the annualised performance to the last quarter end:
| 30/12/21 to 30/12/22 | 30/12/20 to 30/12/21 | 30/12/19 to 30/12/20 | 30/12/18 to 30/12/19 | 30/12/17 to 30/12/18 | |
| MGTS Clarion Prudence P Acc | -11.99% | 5.61% | 2.13% | 12.50% | -5.90% |
| CIM DT04 Prudence Portfolio | -11.87% | 6.28% | 3.05% | 12.13% | -5.23% |
| ARC Sterling Cautious PCI | -7.39% | 4.23% | 4.20% | 8.05% | -3.63% |
| IA Mixed Investment 20-60% Shares | -9.47% | 7.20% | 3.51% | 11.84% | -5.10% |
The chart below shows the historical performance of the Navigator Portfolio against a relevant benchmark since the start of the available data.
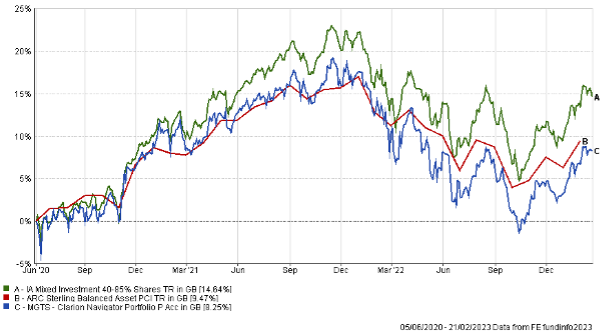
The table below shows the annualised performance to the last quarter end:
| 30/12/21
to 30/12/22 |
30/12/20
to 30/12/21 |
|
| MGTS Clarion Navigator P Acc | -12.36% | 7.59% |
| CIM DT05 Navigator Portfolio | -11.74% | 8.22% |
| IA Mixed Investment 40-85% Shares | -10.04% | 10.94% |
ARC Sterling Balanced Asset PCI -8.75% 7.64%
The chart below shows the historical performance of the Meridian Portfolio against a relevant benchmark since the start of the available data.
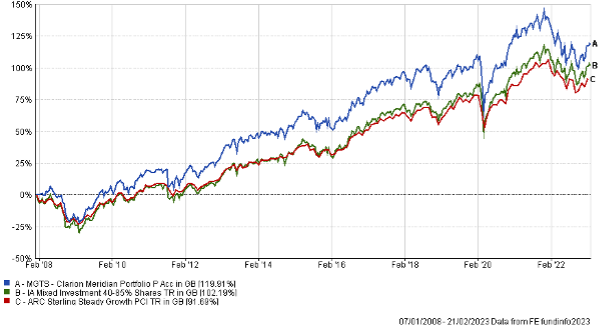
The table below shows the annualised performance to the last quarter end:
| 30/12/21 to 30/12/22 | 30/12/20 to 30/12/21 | 30/12/19 to 30/12/20 | 30/12/18 to 30/12/19 | 30/12/17 to 30/12/18 | |
| MGTS Clarion Meridian P Acc | -13.24% | 8.25% | 6.15% | 15.51% | -7.84% |
| CIM DT06 Meridian Portfolio | -12.58% | 9.02% | 7.39% | 15.67% | -6.89% |
| ARC Steady Growth PCI | -9.76% | 10.24% | 4.56% | 15.00% | -5.64% |
| IA Mixed Investment 40-85% Shares | -10.04% | 10.94% | 5.32% | 15.78% | -6.11% |
The chart below shows the historical performance of the Explorer Portfolio against a relevant benchmark since the start of the available data.
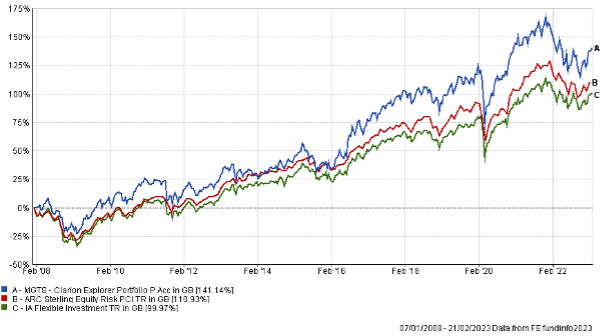
The table below shows the annualised performance to the last quarter end:
| 30/12/21 to 30/12/22 | 30/12/20 to 30/12/21 | 30/12/19 to 30/12/20 | 30/12/18 to 30/12/19 | 30/12/17 to 30/12/18 | |
| MGTS Clarion Explorer P Acc | -13.16% | 8.91% | 9.12% | 16.94% | -6.41% |
| CIM DT07 Explorer Portfolio | -12.90% | 9.72% | 9.83% | 16.31% | -5.61% |
| ARC Equity Risk PCI | -10.86% | 12.31% | 5.82% | 18.04% | -6.50% |
| IA Flexible Investment | -8.98% | 11.30% | 6.70% | 15.66% | -6.72% |
The chart below shows the historical performance of the Voyager Portfolio against a relevant benchmark since the start of the available data.
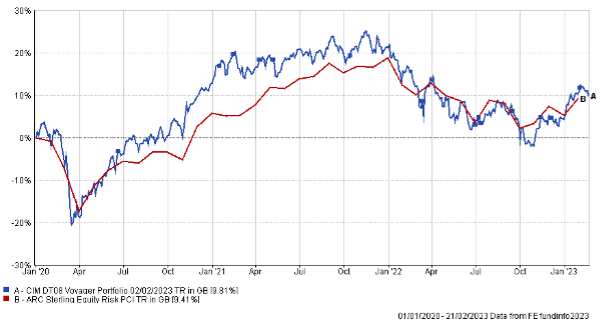
The table below shows the annualised performance to the last quarter end:
| 30/12/21
to 30/12/22 |
30/12/20
to 30/12/21 |
|||||
| CIM DT08 Voyager Portfolio | -13.99% | 7.66% | ||||
| ARC Equity Risk PCI | -10.86% | 12.31% |
The chart below shows the historical performance of the Adventurer Portfolio against a relevant benchmark since the start of the available data.
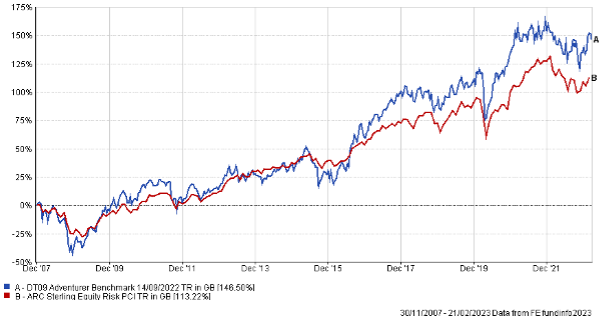
The table below shows the annualised performance to the last quarter end:
| 30/12/21
to 30/12/22 |
30/12/20
to 30/12/21 |
||||
| CIM DT09 Adventurer Portfolio | -12.88% | 4.43% | |||
| ARC Equity Risk PCI | -10.86% | 12.31% |
The chart below shows the historical performance of the Pioneer Portfolio against a relevant benchmark since the start of the available data.
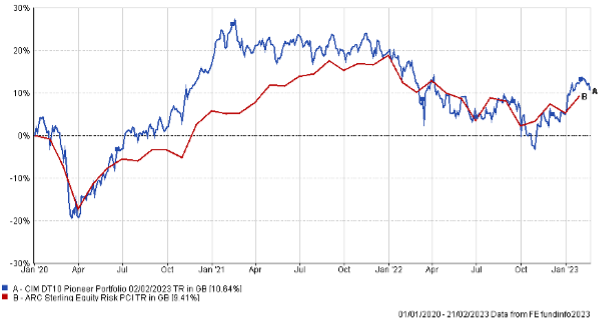
The table below shows the annualised performance to the last quarter end:
| 30/12/21
to 30/12/22 |
30/12/20
to 30/12/21 |
||||
| CIM DT10 Pioneer Portfolio | -12.20% | 2.66% | |||
| ARC Equity Risk PCI | -10.86% | 12.31% |
The content of this article does not constitute financial advice and you may wish to seek professional advice based on your individual circumstances before making any financial decisions.
Any investment performance figures referred to relate to past performance which is not a reliable indicator of future results and should not be the sole factor of consideration when selecting a product or strategy. The value of investments, and the income arising from them, can go down as well as up and is not guaranteed, which means that you may not get back what you invested. Unless indicated otherwise, performance figures are stated in British Pounds. Where performance figures are stated in other currencies, changes in exchange rates may also cause an investment to fluctuate in value.
If you’d like more information about this article, or any other aspect of our true lifelong financial planning, we’d be happy to hear from you. Please call +44 (0)1625 466 360 or email [email protected].
Click here to sign-up to The Clarion for regular updates.