True lifelong financial planning for the serious business of life.
True lifelong financial planning
for the serious business of life.
True lifelong financial planning for the serious business of life.
True lifelong financial planning
for the serious business of life.
Tags: Adventurer Portfolio, Defender Portfolio, Discretionary Investment Management, Explorer Portfolio, funds, investment, Meridian Portfolio, MGTS Clarion Explorer, MGTS Clarion Meridian, MGTS Clarion Prudence, MTGS Clarion Navigator, Navigator Portfolio, Pioneer Portfolio, Prudence Portfolio, Voyager Portfolio
Category:
Investment management
This article provides a brief overview of the topics discussed in the recent investment committee meeting (11th May 2022) and the decisions made following those discussions.
The following notes summarise the main points discussed by the Investment Committee.
The Clarion Investment Committee met on Wednesday 11th May with thoughts dominated by the horrific war in Ukraine and the terrible unfolding humanitarian crisis.
However, with no resolution to this tragedy yet in sight, the IC focused its discussions around the economic and market implications of the war on already surging inflation and how central banks are responding, as well as the ongoing supply chain pressures and further Covid-19 lockdown measures in China.
Covid and the Russian invasion of Ukraine have wreaked immeasurable social and humanitarian costs, along with changing the outlook for the future. While these two events are not interconnected, their impact on the broader economy has been very similar. Choking off supply and driving inflation higher, leading to an expectation of interest rates being even higher than forecasted.
This dynamic has been beneficial for many companies within the financial sector but conversely the environment is very difficult for growth style businesses on high earnings multiples and the more cyclical or consumer focused businesses.
The impact of high energy crisis on the consumer confidence and corporate margins are yet to fully materialize. But the days of the high “transitory” inflation debate have long since been surpassed by growing hawkish central banks actions and rhetoric, as they attempt to put the inflation genie back into the bottle.
The IC was acutely aware of the potential stagflation risks that lie ahead, particularly for the bond markets, as a new secular regime becomes set to replace the extended period of economic stability, low inflation, positive economic growth and the belief that the boom-and-bust cycle had been overcome.
With the prospect of higher inflation and interest rates and elevated periods of economic and stock market volatility now firmly on the agenda, monetary policy makers are facing a particularly challenging balancing act. The risk of a policy mistake by increasing interest rates too fast and too far, most notably by US Federal Reserve (Fed), could result in a recession.
Or if not, a major hangover induced by the pullback of excessive fiscal and monetary stimulus (reversing QE/reducing bond holdings), feeling like recession. The extent of tightening and implications for economic growth, alongside burgeoning budget deficits raises serious concerns for global bond markets.
The IC highlighted the slow creeping increase in correlations between equities and bonds and the growing portfolio risks associated with any disorderly increase in bond yields because of potential policy overshoot.
Currency trends have shifted firmly towards the dollar, with sterling falling against the dollar on the back of poor retail data to a two-year low. The yen, traditionally a haven currency in volatile times, has slumped against the dollar as a result of the Bank of Japan maintaining its yield curve control through buying unlimited amounts of 10-year government debt at a 0.25% yield. The euro is also currently trading at a five year low against the dollar. A strong dollar has, in the past, been a headwind against emerging market economies, many of which issue debt in dollar denominations.
Russia has followed through on its threat to continental gas supplies as it cut off Poland and Bulgaria for refusing to pay in roubles. European natural gas prices rose as a result by c.24%. The possibility of such an action being taken against a major country like Germany, which is heavily reliant on Russian gas, could certainly push Europe into recession and see a dramatic escalation of global wholesale prices which, in turn, would keep inflation levels in the west elevated.
With the conflict in Ukraine now concentrated in the East of the country and the Russian army meeting stiff urban resistance thanks to military equipment from western countries, the risk to markets is most likely to come from a Russian instigated energy war.
The impact of lockdowns in China and mass testing in Beijing, as the country’s zero-Covid policy is put firmly to the test by the omicron variant, has weighed on the region’s equity markets.
The People’s Bank of China reiterated its support for markets and has ample room to cut interest rates and stimulate the economy if required compared to western central banks, as inflation remains comparatively low. Along with the Bank of Japan’s continued loose monetary policy, there is scope for a notable divergence of central bank policy from east to west that may reveal tactical investment opportunities.
Bond markets remain a tough hunting ground for real returns, with long-duration holders, the winners of the decade-plus long bond bull run, likely to see considerable capital losses if held to maturity. This is before the Federal Reserve has begun its expected sales of $60bn worth of treasuries each month announced at the May meeting. With quantitative easing reversing, the yield curve should, in theory, return to relative normality, with the short end flattening and the long end rising. This would see short-dated bonds outperform.
Despite the increase in economic and market volatility over the last year, the IC still see value in equity markets and remain confident in our robust investment process which has survived and prospered through previous challenging periods such as the dot-com tech crash, the global financial crisis, the Covid 19 pandemic and to a lesser extent the uncertainty over Brexit.
UK equities continue to trade at a deep discount relative to other developed equity markets on a historical basis. The value tilt across the FTSE indices and high yield ought to be attractive in the current inflationary environment, and the collapse of growth style equities will be giving many asset managers pause for thought. The Investment Committee maintain the conviction in an overweight UK position in the Clarion Portfolio Funds and model portfolios.
Asian equities trade at attractive earnings multiples at present, having suffered a difficult 2021 and 2022 so far, and over the long term these look to have significant capital growth potential, with accommodative monetary policy in place. The short-term outlook remains challenging with rolling lockdowns and slowing growth and exports, but these concerns are not ultimately insurmountable, and the demographic trends of increasing domestic consumer wealth and spending in the region are positive. The Committee maintain an overweight position in Asia Pacific equities on this basis.
Growth equities have already been selling off substantially, and the US markets continue to throw curveballs at investor expectations, such as the calamity of Netflix’s latest earnings, where a relatively small subscriber loss pulled the rug out from under perennial growth expectations and the stock fell over 20% overnight.
Again, it is notable that the Federal Reserve has barely begun to move in terms of interest rate rises and quantitative tightening, and the wheels already look to be coming off the highly speculative areas of the tech wagon and cryptocurrencies. One only has to briefly glance at Cathie Wood’s sinking ARKK ETF to witness the bloodbath, where investors have lost half their capital year to date, and two thirds over six months. The Committee believe there are better value opportunities in US smaller companies (trading at their widest discount in p/e terms to the S&P 500 in two decades) and at the bottom end of the major indices.
Continuing to hold diversified high-quality assets over the longer term remains the appropriate method for allocation of investor capital.
Keith W Thompson
Clarion Group Chairman
May 2022
For a fuller version of Clarion’s Economic and Stock Market Commentary, written by Clarion Group Chairman Keith Thompson, please click here
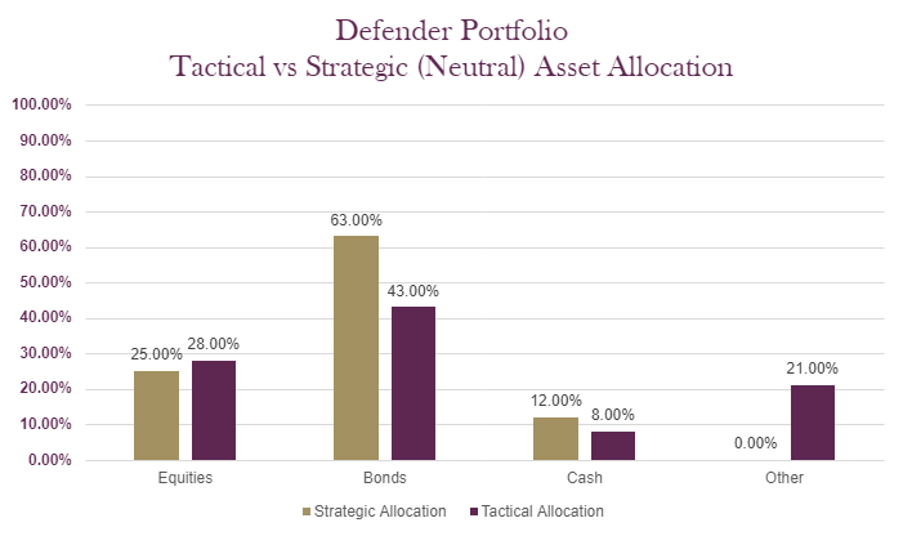
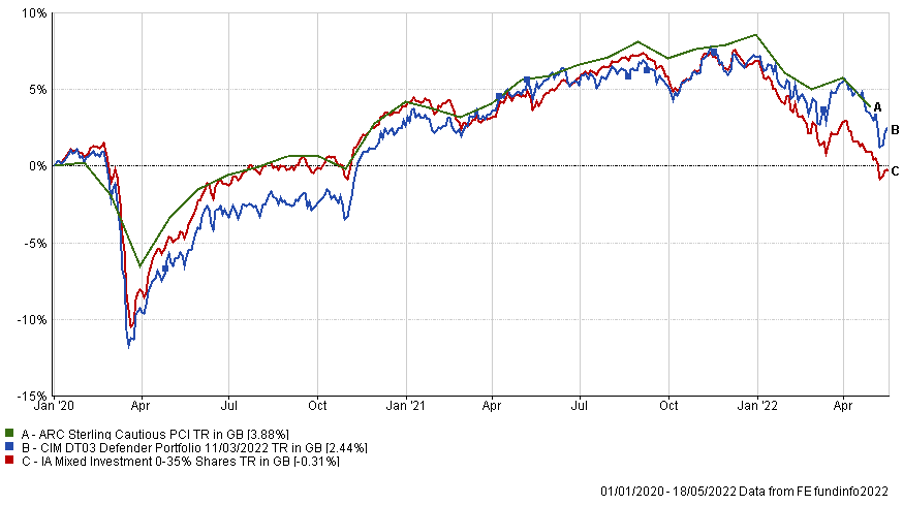
The charts below show the tactical asset allocation of the Defender Portfolio against the neutral/strategic asset allocation as well as the historical performance of the portfolio against a relevant benchmark since the start of the available data.
*Past performance data covering the most recent five-year period is unavailable therefore only past performance data available since inception of the fund is illustrated.
The table below shows the annualised performance to the last quarter end:
| 31/03/21 31/03/20
to to 31/03/22 31/03/21 |
|
| CIM DT03 Defender Portfolio | 1.94% 14.04% |
| ARC Sterling Cautious PCI | 1.82% 11.34% |
| IA Mixed Investment 0-35% Shares | -0.20% 12.09% |
Changes to the Defender model
There were no changes made to the Defender portfolio in May 2022
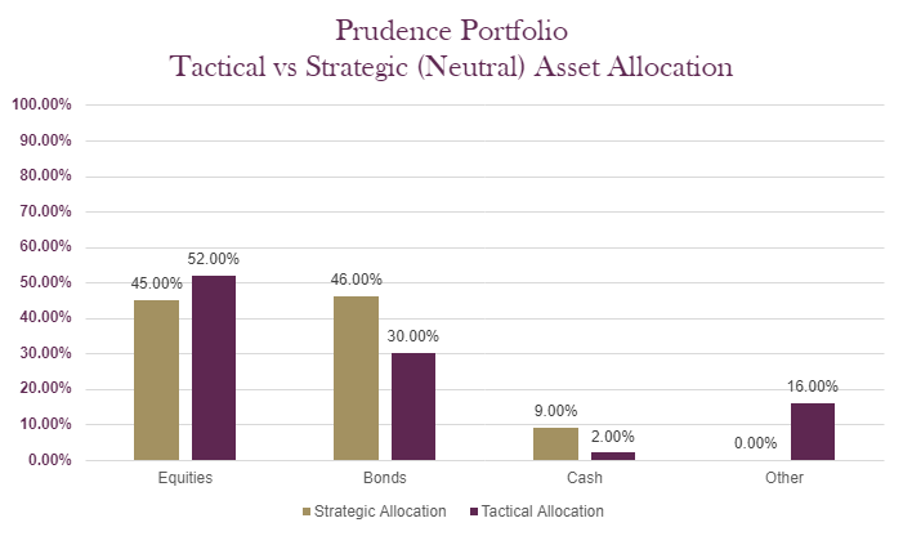
The charts below show the tactical asset allocation of the Prudence Portfolio against the neutral/strategic asset allocation as well as the historical performance of the portfolio against a relevant benchmark(s) since the start of the available data.
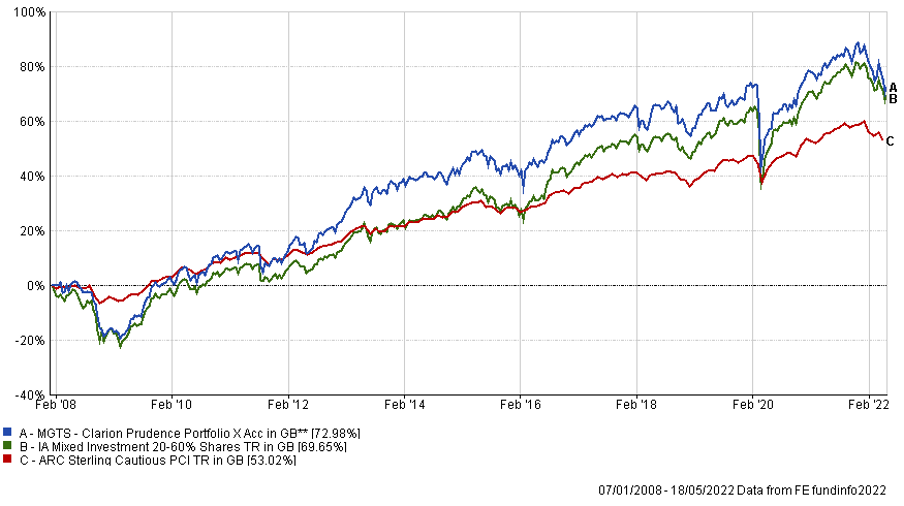
The table below shows the annualised performance to the last quarter end:
| 31/03/21 to 31/03/22 | 31/03/20 to 31/03/21 | 31/03/19 to 31/03/20 | 31/03/18 to 31/03/19 | 31/03/17 to 31/03/18 | |
| MGTS Clarion Prudence X Acc | 2.22% | 18.18% | -7.89% | 3.87% | -1.24% |
| CIM DT04 Prudence Portfolio | 2.88% | 18.24% | -7.42% | 4.15% | |
| ARC Sterling Cautious PCI | 1.82% | 11.34% | -2.29% | 1.71% | 0.65% |
| IA Mixed Investment 20-60% Shares | 2.73% | 19.83% | -7.19% | 2.86% | 0.83% |
Changes to the Prudence fund & model
There were no changes made to the Prudence portfolio in May 2022
The charts below show the tactical asset allocation of the Navigator Portfolio against the neutral/strategic asset allocation as well as the historical performance of the portfolio against a relevant benchmark(s) since the start of the available data.
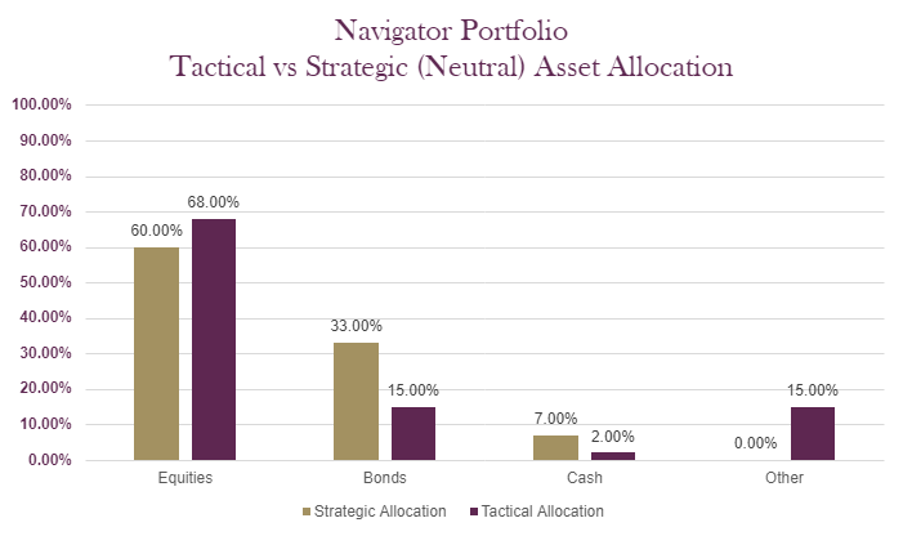
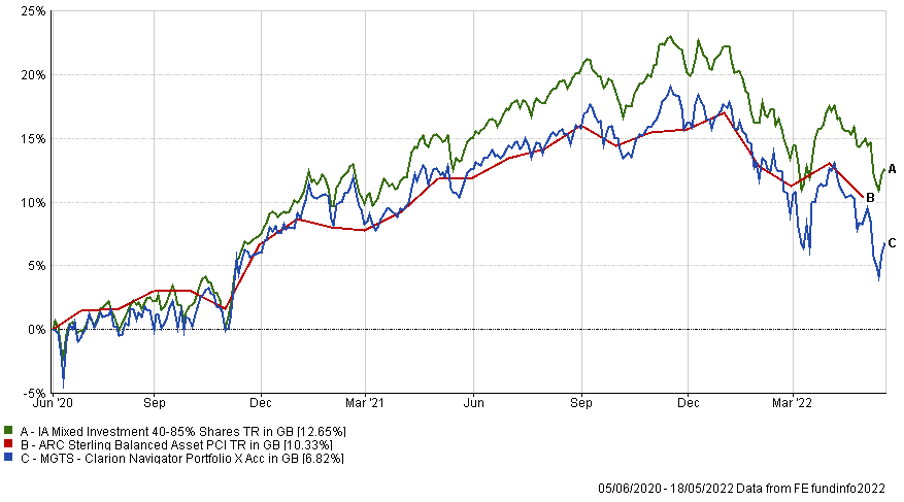
*Past performance data covering the most recent five-year period is unavailable therefore only past performance data available since inception of the fund is illustrated.
The table below shows the annualised performance to the last quarter end:
| 31/03/21 to 31/03/22 | |
| MGTS Clarion Navigator X Acc | 2.71% |
| CIM DT05 Navigator Portfolio | 3.09% |
| IA Mixed Investment 40-85% Shares | 5.23% |
| ARC Sterling Balanced Asset PCI | 3.63% |
Changes to the Navigator fund & model
There were no changes made to the Navigator portfolio in May 2022
The charts below show the tactical asset allocation of the Meridian Portfolio against the neutral/strategic asset allocation as well as the historical performance of the portfolio against a relevant benchmark(s) since the start of the available data.
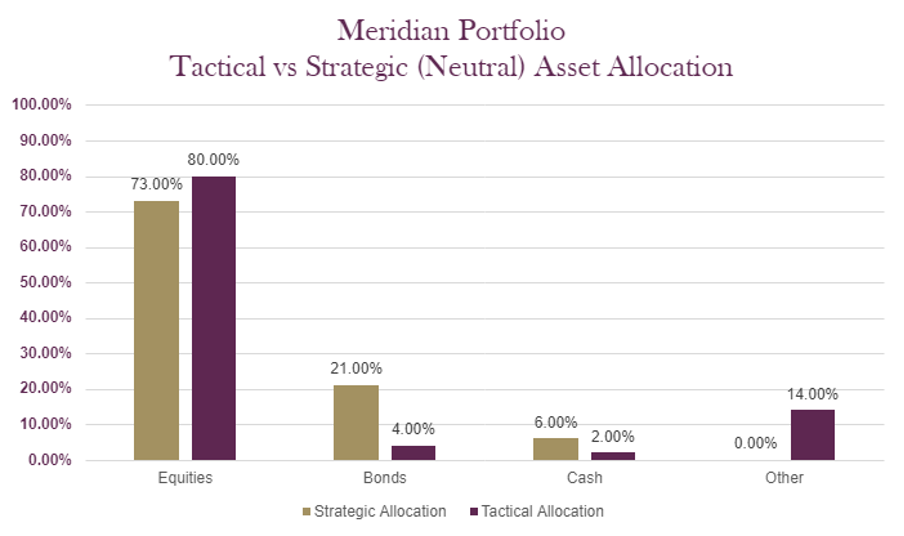
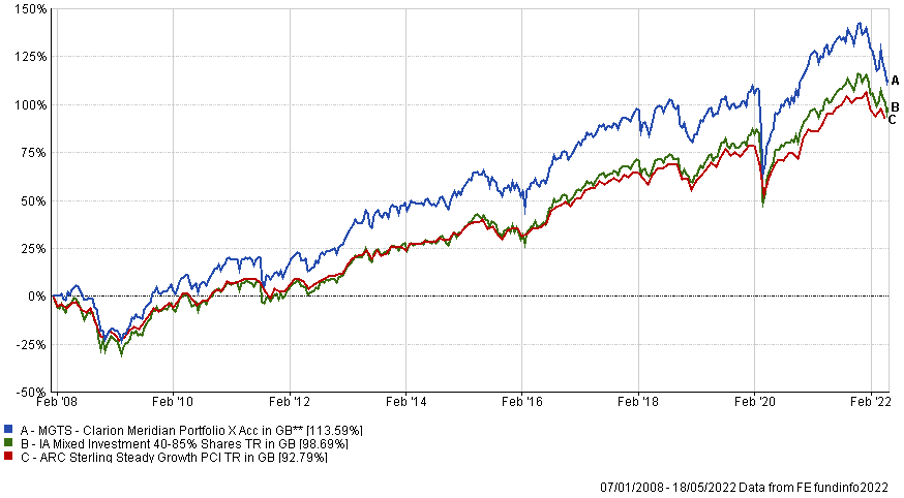
The table below shows the annualised performance to the last quarter end:
| 31/03/21 to 31/03/22 | 31/03/20 to 31/03/21 | 31/03/19 to 31/03/20 | 31/03/18 to 31/03/19 | 31/03/17 to 31/03/18 | |
| MGTS Clarion Meridian X Acc | 1.40% | 30.01% | -10.01% | 4.27% | -0.40% |
| CIM DT06 Meridian Portfolio | 1.76% | 30.90% | -9.43% | 4.28% | |
| ARC Steady Growth PCI | 5.13% | 23.53% | -7.71% | 4.85% | 1.31% |
| IA Mixed Investment 40-85% Shares | 5.23% | 26.44% | -7.99% | 4.30% | 1.54% |
Changes to the Meridian fund & model
There were no changes made to the Meridian portfolio in May 2022
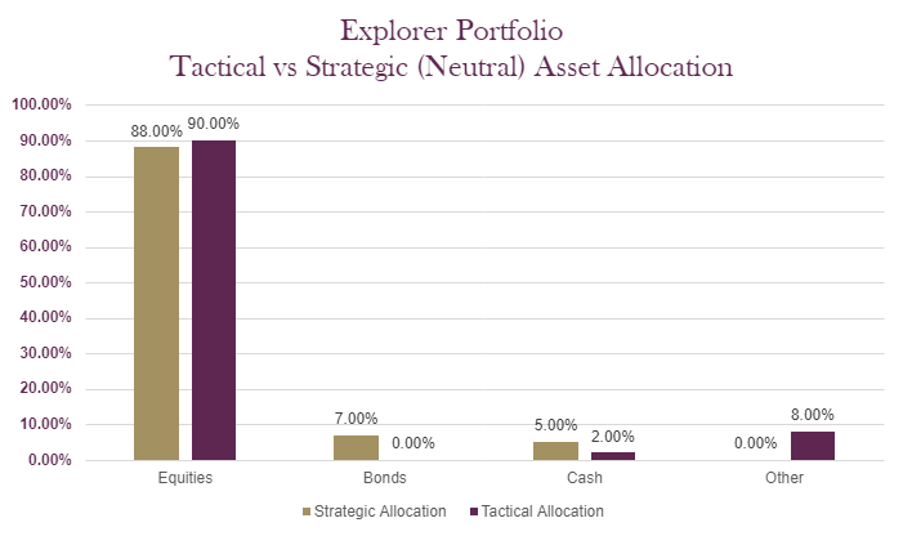
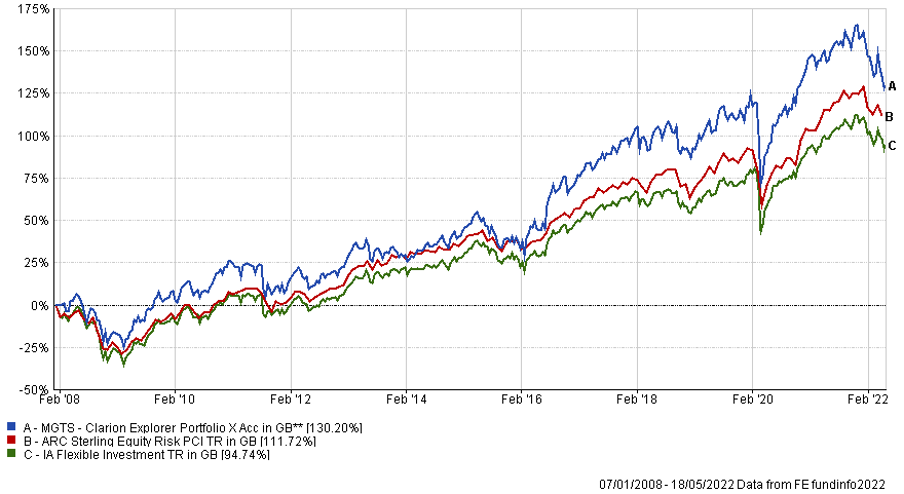
The charts below show the tactical asset allocation of the Explorer Portfolio against the neutral/strategic asset allocation as well as the historical performance of the portfolio against a relevant benchmark(s) since the start of the available data.
The table below shows the annualised performance to the last quarter end:
| 31/03/21 to 31/03/22 | 31/03/20 to 31/03/21 | 31/03/19 to 31/03/20 | 31/03/18 to 31/03/19 | 31/03/17 to 31/03/18 | |
| MGTS Clarion Explorer X Acc | 1.79% | 34.64% | -9.05% | 4.23% | 3.50% |
| CIM DT07 Explorer Portfolio | 1.61% | 35.28% | -10.10% | 5.22% | |
| ARC Equity Risk PCI | 5.63% | 30.35% | -9.65% | 6.04% | 1.77% |
| IA Flexible Investment | 4.95% | 29.10% | -8.14% | 3.31% | 2.36% |
Changes to the Explorer fund & model
There were no changes made to the Explorer portfolio in May 2022
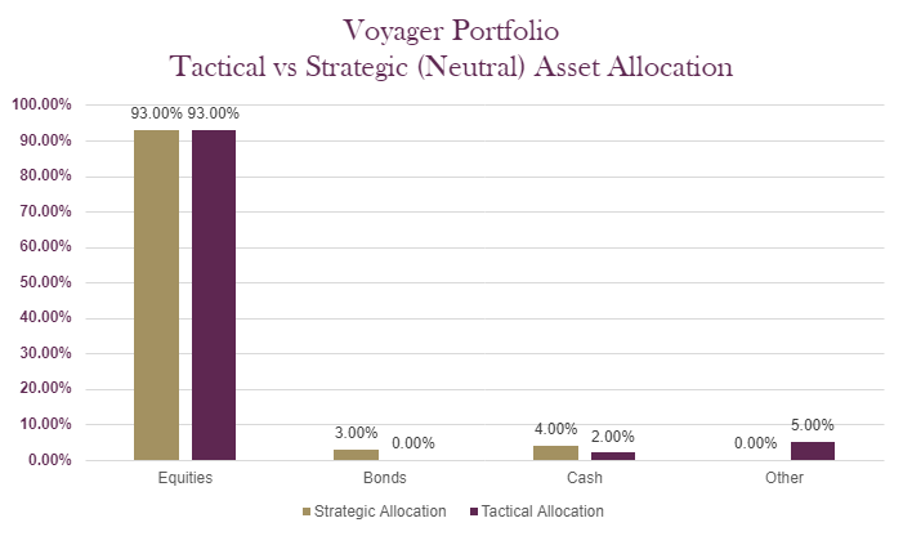
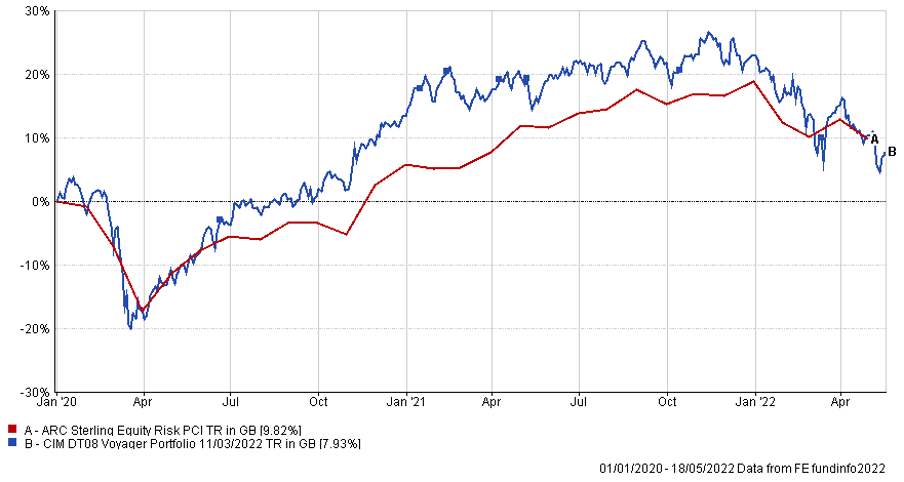
The charts below show the tactical asset allocation of the Voyager Portfolio against the neutral/strategic asset allocation as well as the historical performance of the portfolio against a relevant benchmark(s) since the start of the available data.
*Past performance data covering the most recent five-year period is unavailable therefore only past performance data available since inception of the fund is illustrated.
The table below shows the annualised performance to the last quarter end:
| 31/03/21
to 31/03/22 |
31/03/20
to 31/03/21 |
|||||
| CIM DT08 Voyager Portfolio | -1.32% | 40.16% | ||||
| ARC Equity Risk PCI | 5.63% | 30.35% |
Changes to the Voyager fund & model
There were no changes made to the Voyager portfolio in May 2022
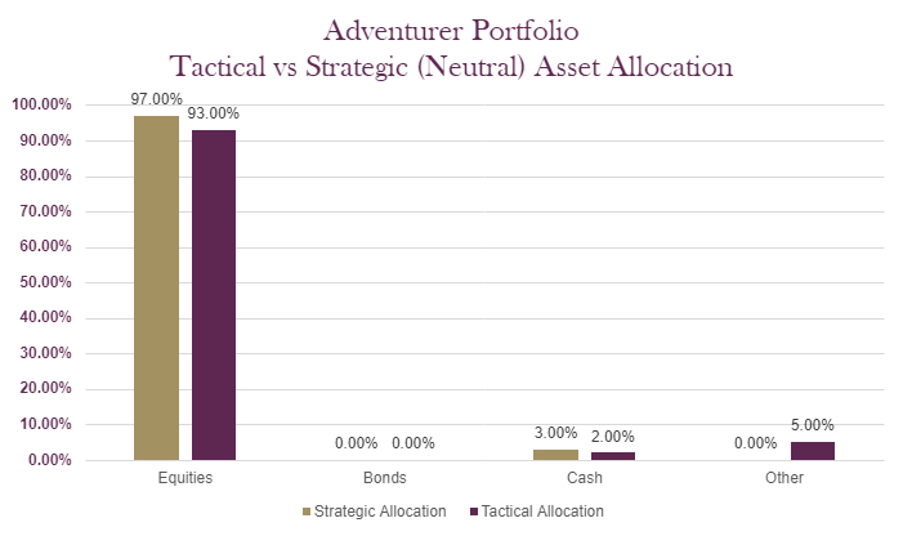
The charts below show the tactical asset allocation of the Adventurer Portfolio against the neutral/strategic asset allocation as well as the historical performance of the portfolio against a relevant benchmark(s) since the start of the available data.
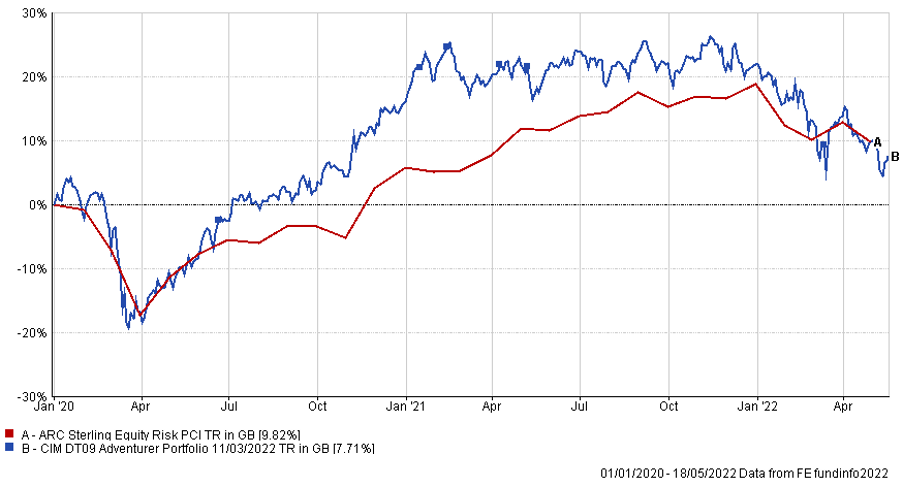
*Past performance data covering the most recent five-year period is unavailable therefore only past performance data available since inception of the fund is illustrated.
The table below shows the annualised performance to the last quarter end:
| 31/03/21
to 31/03/22 |
31/03/20
to 31/03/21 |
||||
| CIM DT09 Adventurer Portfolio | -4.50% | 43.24% | |||
| ARC Equity Risk PCI | 5.63% | 30.35% |
Changes to the Adventurer model
There were no changes made to the Adventurer portfolio in May 2022
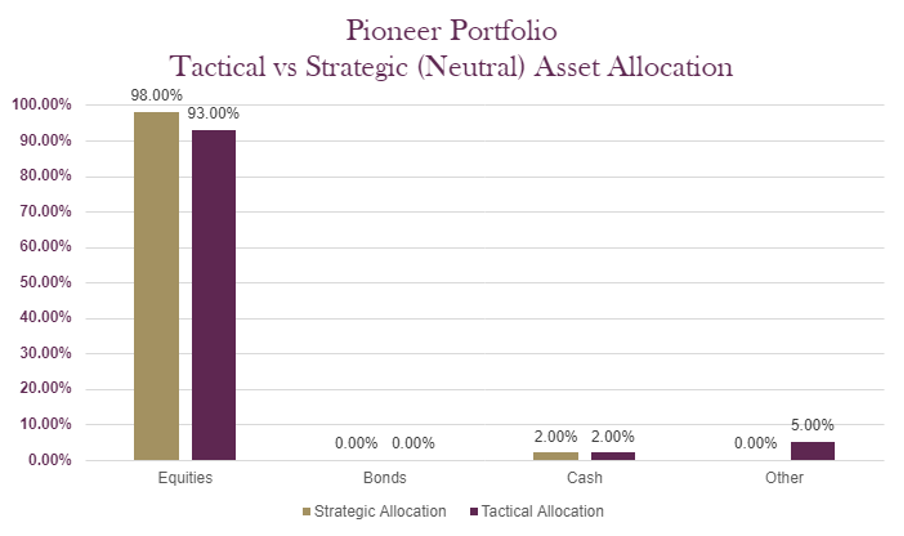
The charts below show the tactical asset allocation of the Pioneer Portfolio against the neutral/strategic asset allocation as well as the historical performance of the portfolio against a relevant benchmark(s) since the start of the available data.
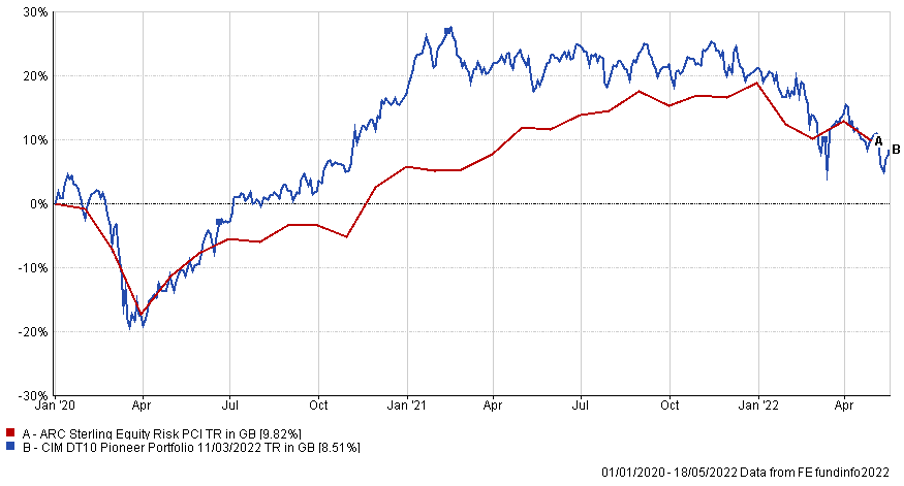
*Past performance data covering the most recent five-year period is unavailable therefore only past performance data available since inception of the fund is illustrated.
The table below shows the annualised performance to the last quarter end:
| 31/03/21
to 31/03/22 |
31/03/20
to 31/03/21 |
||||
| CIM DT10 Pioneer Portfolio | -5.56% | 46.53% | |||
| ARC Equity Risk PCI | 5.63% | 30.35% |
Changes to the Pioneer model
There were no changes made to the Pioneer portfolio in May 2022
The content of this article does not constitute financial advice and you may wish to seek professional advice based on your individual circumstances before making any financial decisions.
Any investment performance figures referred to relate to past performance which is not a reliable indicator of future results and should not be the sole factor of consideration when selecting a product or strategy. The value of investments, and the income arising from them, can go down as well as up and is not guaranteed, which means that you may not get back what you invested. Unless indicated otherwise, performance figures are stated in British Pounds. Where performance figures are stated in other currencies, changes in exchange rates may also cause an investment to fluctuate in value.
If you’d like more information about this article, or any other aspect of our true lifelong financial planning, we’d be happy to hear from you. Please call +44 (0)1625 466 360 or email enquiries@clarionwealth.co.uk.
Click here to sign-up to The Clarion for regular updates.